- XAUUSD
- XAGUSD
- WTI
- USDX
Markets
Analysis
User
24/7
Economic Calendar
Education
Data
- Names
- Latest
- Prev


Signal Accounts for Members
All Signal Accounts
All Contests


Spot Palladium Extended Its Gains To 2.00% On The Day, Currently Trading At $1293.78 Per Ounce
Polysilicon Futures Contracts Saw A Short-term Surge, With Intraday Gains Widening To 6.00%, Currently Trading At 38,850 Yuan/ton. Palladium Futures Contracts Rose Over 6.00% Intraday, Currently Trading At 314.80 Yuan/gram
Coking Coal Futures Contract 2609 Surged During The Day, With Gains Widening To 4%, Reaching A High Of 2087 Yuan/ton, And A Trading Volume Of Approximately 6.365 Billion Yuan; Open Interest Increased By Nearly 7300 Lots During The Day, With Both Trading Volume And Open Interest Activity Rising Simultaneously
The Main Platinum Futures Contract Rose More Than 4.00% Intraday, Currently Trading At 433.10 Yuan/gram
The Regional Governor Said The Russian City Of Toggliati, Home To Russian Automaker Avtovaz, Was Attacked By Drones
The Main Coking Coal Futures Contract Rose More Than 2.00% Intraday, Currently Trading At 2047.00 Yuan/ton
The Most Active Liquefied Petroleum Gas (LPG) Contract Fell 5% Intraday, Currently Trading At 5386 Yuan/ton
Central Bank Indonesia: It Will Continue To Optimize The Rupiah Stabilization Measures Through Consistent And Moderate Non-deliverable Forward (NDF) Interventions In The Offshore, Onshore, And Spot Markets
The Most Active PET Bottle Chip Futures Contract Fell 2.00% Intraday, Currently Trading At 7516 Yuan/ton. The Most Active Paraxylene (PX) Futures Contract Fell 2.00% Intraday, Currently Trading At 8664 Yuan/ton. The Most Active Styrene (EB) Futures Contract Fell 2.00% Intraday, Currently Trading At 8383.00 Yuan/ton
Guangdong’s Foreign Trade Has Recorded Double-digit Growth For Five Consecutive Months This Year
China's Central Bank (PBOC) Announced Today That It Conducted 393 Billion Yuan Of 7-day Reverse Repurchase Operations, With A Bid Amount Of 393 Billion Yuan And A Winning Bid Amount Of 393 Billion Yuan. The Operation Rate Was 1.40%, Unchanged From The Previous Rate
The Main Liquefied Petroleum Gas (LPG) Contract Fell 4.00% Intraday, Currently Trading At 5440.00 Yuan/ton
The Main Lithium Carbonate Futures Contract Rose More Than 3.00% Intraday, Currently Trading At 177,000 Yuan/ton
Polysilicon 2609 Futures Saw A Significant Strengthening During The Session, With Gains Widening To 5%, Reaching A High Of 38,465 Yuan/ton, And A Trading Volume Of Approximately 2.944 Billion Yuan; Trading Activity Was High
The Main Lithium Carbonate Futures Contract Rose More Than 2.00% Intraday, Currently Trading At 174,820 Yuan/ton

Indonesia Retail Sales YoY (Apr)A:--
F: --
P: --
South Africa Mining Output YoY (Apr)A:--
F: --
P: --
South Africa Gold Production YoY (Apr)A:--
F: --
P: --
U.K. Refinitiv/Ipsos Primary Consumer Sentiment Index (PCSI) (Jun)A:--
F: --
P: --
Turkey 1-Week Repo RateA:--
F: --
P: --
Turkey Late Liquidity Window Rate (LON) (Jun)A:--
F: --
P: --
Turkey Overnight Lending Rate (O/N) (Jun)A:--
F: --
P: --
Mexico Industrial Output YoY (Apr)A:--
F: --
P: --
Brazil Services Growth YoY (Apr)A:--
F: --
P: --
Euro Zone ECB Main Refinancing RateA:--
F: --
P: --
Euro Zone ECB Deposit RateA:--
F: --
P: --
Euro Zone ECB Marginal Lending RateA:--
F: --
P: --
ECB Monetary Policy Statement
U.S. Core PPI MoM (SA) (May)A:--
F: --
U.S. Core PPI YoY (May)A:--
F: --
U.S. Weekly Continued Jobless Claims (SA)A:--
F: --
U.S. Initial Jobless Claims 4-Week Avg. (SA)A:--
F: --
P: --
U.S. PPI MoM (SA) (May)A:--
F: --
U.S. PPI YoY (May)A:--
F: --
U.S. Weekly Initial Jobless Claims (SA)A:--
F: --
P: --
Canada Building Permits MoM (SA) (Apr)A:--
F: --
ECB Press Conference
Germany Current Account (Not SA) (Apr)A:--
F: --
Russia Trade Balance (Apr)A:--
F: --
P: --
U.S. EIA Weekly Natural Gas Stocks ChangeA:--
F: --
P: --
China, Mainland M1 Money Supply YoY (May)--
F: --
P: --
China, Mainland M0 Money Supply YoY (May)--
F: --
P: --
China, Mainland M2 Money Supply YoY (May)--
F: --
P: --
Argentina CPI MoM (May)A:--
F: --
P: --
U.S. Weekly Treasuries Held by Foreign Central BanksA:--
F: --
P: --
U.K. Construction Output YoY (Apr)--
F: --
P: --
U.K. GDP YoY (SA) (Apr)--
F: --
P: --
U.K. Services Index MoM--
F: --
P: --
U.K. Trade Balance EU (SA) (Apr)--
F: --
P: --
U.K. Industrial Output MoM (Apr)--
F: --
P: --
U.K. Manufacturing Output MoM (Apr)--
F: --
P: --
U.K. Monthly GDP 3M/3M Change (Apr)--
F: --
P: --
U.K. Trade Balance Non-EU (SA) (Apr)--
F: --
P: --
U.K. Trade Balance (Apr)--
F: --
P: --
U.K. Construction Output MoM (SA) (Apr)--
F: --
P: --
U.K. Industrial Output YoY (Apr)--
F: --
P: --
U.K. Trade Balance (SA) (Apr)--
F: --
P: --
U.K. Manufacturing Output YoY (Apr)--
F: --
P: --
U.K. GDP MoM (Apr)--
F: --
P: --
France HICP Final MoM (May)--
F: --
P: --
U.K. Inflation Rate Expectations--
F: --
P: --
China, Mainland Outstanding Loans Growth YoY (May)--
F: --
P: --
India CPI YoY (May)--
F: --
P: --
India Deposit Gowth YoY--
F: --
P: --
Brazil CPI YoY (May)--
F: --
P: --
U.S. 5-10 Year-Ahead Inflation Expectations (Jun)--
F: --
P: --
U.S. Weekly Total Rig Count--
F: --
P: --
U.S. Weekly Total Oil Rig Count--
F: --
P: --
U.K. Rightmove House Price Index YoY (Jun)--
F: --
P: --
Saudi Arabia CPI YoY (May)--
F: --
P: --
Euro Zone Industrial Output YoY (Apr)--
F: --
P: --
Euro Zone Trade Balance (Not SA) (Apr)--
F: --
P: --
Euro Zone Trade Balance (SA) (Apr)--
F: --
P: --
Euro Zone Industrial Output MoM (Apr)--
F: --
P: --
Euro Zone Total Reserve Assets (May)--
F: --
P: --


No matching data
The S&P 500 is back to its glorious self this year, overcoming some challenges a few months ago to rise 14% year to date. It's resilient, like the U.S. economy, driven by the largest of its 500 components.
There are a number of ways to invest in the S&P 500, and one of the most popular methods today is investing in an exchange-traded fund (ETF) that tracks it. The largest one is the Vanguard S&P 500 ETF (VOO 0.01%), which has $1.4 trillion in assets, but there are several others.
You might think it's a great time to buy in as the market rises, but it's not that simple.
The S&P 500 has been a wealth-building machine for decades. It gains on average more than 10% annually; Compounded over time, especially with consistent additions, that turns into a lot of money for investors.
As the market rises, investors can benefit from increasing stock prices. And when you invest in an ETF that tracks the S&P 500, it takes all of the guesswork out of investing.
It also gives you exposure to the best companies on the market today, and since it's a weighted index, it's heavily skewed toward artificial intelligence (AI). The largest companies in the U.S. by market cap are the largest companies in the index, and today, these are all AI companies. The Vanguard ETF's top holdings are Nvidia, Microsoft, Apple, and Amazon, and they collectively account for 25% of the total portfolio.
These stocks have incredible long-term tailwinds. Investing in an S&P 500 ETF gives you access to these opportunities while minimizing the risk of investing in only one company.
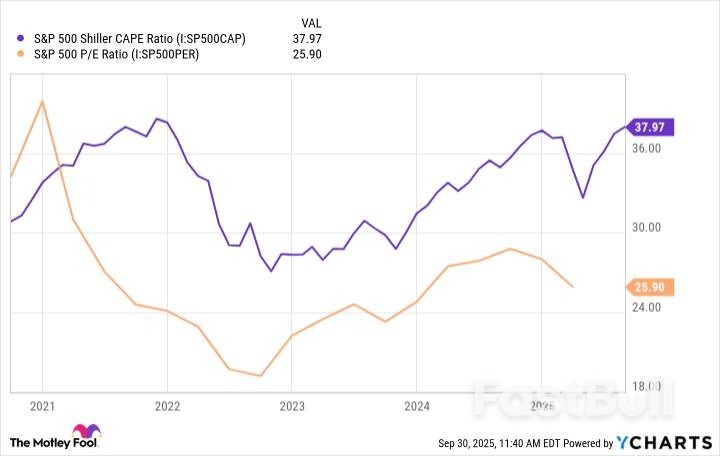
That being said, the best time to buy is on the dip, not at the top. The S&P 500 is breaking records all the time these days, and it's near its most expensive valuation. The average S&P price-to-earnings (P/E) ratio is almost 38, a five-year high. The cyclically adjusted P/E ratio, or CAPE ratio, which adjusts for inflation, is also near highs -- outside of a spike in 2021 right before the market crashed.

What does that mean for investors? Nothing concrete, but the nature of the market is that there are always going to be dips, corrections, and even crashes on the way to the top. The market has always recovered and gone on to bigger and better, but as the S&P 500 becomes more and more expensive, the potential for some kind of correction looks likely.
No one knows when there might be a dip, or worse. You can't time the market, and even though it's heading higher today, it could keep that up for a long time. It would be a shame to miss out on the growth because of fear of a correction. Keep in mind the potential for some near-term rebalancing as the market becomes even more expensive.
I would caution anyone who might need their funds in the near future to invest in safe, perhaps dividend-yielding stocks and keep some distance from anything that looks overpriced, including an S&P 500 ETF. But if you're in it for the long term, and you have the ability to weather downturns, it's always a good time to invest in the market, and an S&P 500 ETF is an excellent way to do that.
The risk of loss in trading financial instruments such as stocks, FX, commodities, futures, bonds, ETFs and crypto can be substantial. You may sustain a total loss of the funds that you deposit with your broker. Therefore, you should carefully consider whether such trading is suitable for you in light of your circumstances and financial resources.
No decision to invest should be made without thoroughly conducting due diligence by yourself or consulting with your financial advisors. Our web content might not suit you since we don't know your financial conditions and investment needs. Our financial information might have latency or contain inaccuracy, so you should be fully responsible for any of your trading and investment decisions. The company will not be responsible for your capital loss.
Without getting permission from the website, you are not allowed to copy the website's graphics, texts, or trademarks. Intellectual property rights in the content or data incorporated into this website belong to its providers and exchange merchants.
Not Logged In
Log in to access more features
Log In
Sign Up