

Markets
News
Analysis
User
24/7
Economic Calendar
Education
Data
- Names
- Latest
- Prev


Signal Accounts for Members
All Signal Accounts
All Contests
 France HICP Final MoM (Nov)
A:--
F: --
P: --
 China, Mainland Outstanding Loans Growth YoY (Nov)
A:--
F: --
P: --
China, Mainland M2 Money Supply YoY (Nov)A:--
F: --
P: --
China, Mainland M0 Money Supply YoY (Nov)A:--
F: --
P: --
China, Mainland M1 Money Supply YoY (Nov)A:--
F: --
P: --
 India CPI YoY (Nov)
A:--
F: --
P: --
India Deposit Gowth YoYA:--
F: --
P: --
 Brazil Services Growth YoY (Oct)
A:--
F: --
P: --
 Mexico Industrial Output YoY (Oct)
A:--
F: --
P: --
 Russia Trade Balance (Oct)
A:--
F: --
P: --
 Philadelphia Fed President Henry Paulson delivers a speech
 Canada Building Permits MoM (SA) (Oct)
A:--
F: --
P: --
Canada Wholesale Sales YoY (Oct)A:--
F: --
P: --
Canada Wholesale Inventory MoM (Oct)A:--
F: --
P: --
Canada Wholesale Inventory YoY (Oct)A:--
F: --
P: --
Canada Wholesale Sales MoM (SA) (Oct)A:--
F: --
P: --
 Germany Current Account (Not SA) (Oct)
A:--
F: --
P: --
U.S. Weekly Total Rig CountA:--
F: --
P: --
U.S. Weekly Total Oil Rig CountA:--
F: --
P: --
 Japan Tankan Small Manufacturing Outlook Index (Q4)
A:--
F: --
P: --
Japan Tankan Large Non-Manufacturing Diffusion Index (Q4)A:--
F: --
P: --
Japan Tankan Large Non-Manufacturing Outlook Index (Q4)A:--
F: --
P: --
Japan Tankan Large Manufacturing Outlook Index (Q4)A:--
F: --
P: --
Japan Tankan Small Manufacturing Diffusion Index (Q4)A:--
F: --
P: --
Japan Tankan Large Manufacturing Diffusion Index (Q4)A:--
F: --
P: --
Japan Tankan Large-Enterprise Capital Expenditure YoY (Q4)A:--
F: --
P: --
 U.K. Rightmove House Price Index YoY (Dec)
A:--
F: --
P: --
China, Mainland Industrial Output YoY (YTD) (Nov)A:--
F: --
P: --
China, Mainland Urban Area Unemployment Rate (Nov)A:--
F: --
P: --
 Saudi Arabia CPI YoY (Nov)
A:--
F: --
P: --
 Euro Zone Industrial Output YoY (Oct)
--
F: --
P: --
Euro Zone Industrial Output MoM (Oct)--
F: --
P: --
Canada Existing Home Sales MoM (Nov)--
F: --
P: --
Euro Zone Total Reserve Assets (Nov)--
F: --
P: --
U.K. Inflation Rate Expectations--
F: --
P: --
Canada National Economic Confidence Index--
F: --
P: --
Canada New Housing Starts (Nov)--
F: --
P: --
U.S. NY Fed Manufacturing Employment Index (Dec)--
F: --
P: --
U.S. NY Fed Manufacturing Index (Dec)--
F: --
P: --
Canada Core CPI YoY (Nov)--
F: --
P: --
Canada Manufacturing Unfilled Orders MoM (Oct)--
F: --
P: --
U.S. NY Fed Manufacturing Prices Received Index (Dec)--
F: --
P: --
U.S. NY Fed Manufacturing New Orders Index (Dec)--
F: --
P: --
Canada Manufacturing New Orders MoM (Oct)--
F: --
P: --
Canada Core CPI MoM (Nov)--
F: --
P: --
Canada Trimmed CPI YoY (SA) (Nov)--
F: --
P: --
Canada Manufacturing Inventory MoM (Oct)--
F: --
P: --
Canada CPI YoY (Nov)--
F: --
P: --
Canada CPI MoM (Nov)--
F: --
P: --
Canada CPI YoY (SA) (Nov)--
F: --
P: --
Canada Core CPI MoM (SA) (Nov)--
F: --
P: --
Canada CPI MoM (SA) (Nov)--
F: --
P: --
Federal Reserve Board Governor Milan delivered a speech U.S. NAHB Housing Market Index (Dec)--
F: --
P: --
 Australia Composite PMI Prelim (Dec)
--
F: --
P: --
Australia Services PMI Prelim (Dec)--
F: --
P: --
Australia Manufacturing PMI Prelim (Dec)--
F: --
P: --
Japan Manufacturing PMI Prelim (SA) (Dec)--
F: --
P: --
U.K. Unemployment Claimant Count (Nov)--
F: --
P: --
U.K. Unemployment Rate (Nov)--
F: --
P: --
U.K. 3-Month ILO Unemployment Rate (Oct)--
F: --
P: --

No matching data
Latest Views
Latest Views
Trending Topics
Top Columnists
Latest Update
White Label
Data API
Web Plug-ins
Affiliate Program
View All
No data
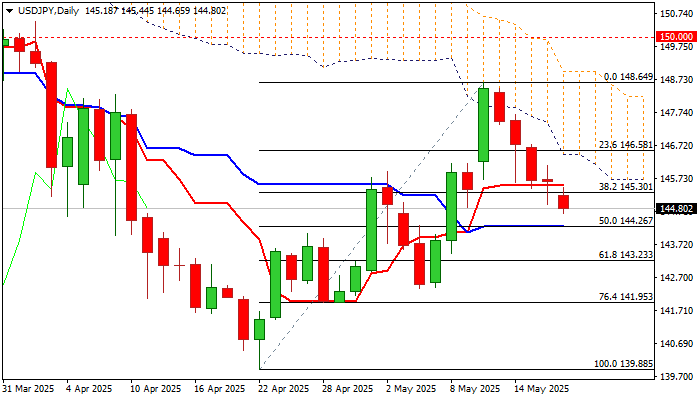
USDJPY continues to descend for the fifth consecutive day, after a double upside rejection and a bull-trap at 148.49 Fibo barrier (76.4% of 151.15/139.88) contributed to the change of direction.
USDJPY continues to descend for the fifth consecutive day, after a double upside rejection and a bull-trap at 148.49 Fibo barrier (76.4% of 151.15/139.88) contributed to the change of direction.
Weaker dollar (which acted as a safe haven on trade uncertainty) following relief on US-China trade agreement and signal that BoJ may resume with tightening (which boosts demand for yen) were the main drivers.
Bears eye pivotal support at 144.26 (50% retracement of 139.88/148.64 recovery leg, reinforced by daily Kijun-sen and bull-trendline off 139.88), loss of which would further weaken near-term structure and risk deeper drop.
The action remains weighed by falling thick daily cloud, daily MA’s in predominantly bearish configuration and long upper shadow weekly candle of last week which points to growing offers and potential formation of reversal pattern on weekly chart.
However, bears are likely to face increased headwinds at 144.26 support that may keep the price in consolidation before attempts through 144.26 trigger.
Near-term action is expected to remain biased lower while below daily Tenkan-sen (145.51).
Res: 145.30; 145.51; 146.10; 146.58
Sup: 144.26; 143.84; 143.23; 142.38
“Sell America” talk is back in markets after Moody’s Ratings stripped the American government of its top credit rating, blaming successive presidents and congressional lawmakers for a ballooning budget deficit it said showed little sign of narrowing.
That comes after President Donald Trump’s blast of reciprocal tariffs in early April spurred widespread selling of US assets — a move that had been partially reversed after he suspended many of those levies and then cut a trade truce with China.
For markets, the trade and debt trajectory concerns are becoming interwoven. For the sell America camp, Trump’s tariffs risk driving up inflation, slowing the economy and souring appetite for Treasuries and the dollar. For the buy America side, an influx of investment into US manufacturing will spur growth and make it easier to service a debt pile that the Congressional Budget Office warned in January was on track to surpass record debt levels set after World War II, reaching 107% of GDP by 2029.
Unsurprisingly, Treasury Secretary Scott Bessent belongs in the latter camp. Asked about Moody’s decision during an interview on NBC’s Meet the Press with Kristen Welker, Bessent shifted the blame toward the prior administration and said “Moody’s is a lagging indicator — that’s what everyone thinks of credit agencies.”
“Who cares? Qatar doesn’t. Saudi doesn’t. The UAE doesn’t,” Bessent said of the Moody’s downgrade. “They’re all pushing money in and they’ve made 10-year investment plans.”
Nor, it seems, do Japan, the UK, Canada and Belgium. Treasury figures on Friday showed they were among the countries whose Treasuries holdings rose in March — a month that saw a second straight jump in foreign purchases to a fresh record high.
Meantime, a move by China to shrink its holdings of Treasuries was seen as a portfolio adjustment rather than a revolt against American assets. Brad Setser, a former US Treasury official now at the Council on Foreign Relations, wrote on X that he viewed China’s shift more as “a move to reduce duration than any real move out of the dollar.”
The Treasury holdings data preceded the April turmoil in the Treasuries market, meaning the next couple of readings will be poured over with great interest. Especially after strong gains in several Asian currencies earlier this month.
Given the speculation about a diversification out of American assets, Gavekal Research has mapped out the potential for repatriation of capital to the region.
Eleven major Asian economies over the past decade doubled their holdings of foreign assets to some $40 trillion in gross terms, or $10.5 trillion net, Udith Sikand, the group’s senior emerging markets analyst, wrote in a recent note. While precise data are sketchy, most of the accumulation appears to have been in dollars, and the rise has been led by the private and semi-official sectors — not central banks, he said.
If those investors conclude that returns in the US going forward won’t be what they were, and if they’re increasingly lured to rising yields in Asia, “the size of the potential flows is enormous,” Sikand said. “South Korea, Japan, Singapore, Taiwan and Hong Kong between them have net international positions excluding official reserves of more than $5 trillion.”
“If even a small portion of these assets flow back into Asian currencies, the exchange rate appreciation will be substantial,” in Asian currencies, Sikand wrote.
Reports in the coming week may give the fullest reading to date of how major economies are faring with trade disruptions, halfway through Trump’s 90-day hiatus on so-called reciprocal tariffs.
Chinese consumer and industry data on Monday will be followed by purchasing manager indexes on Thursday from around the world, pointing to the growth impact from the policy of widespread US levies — unveiled by Trump on April 2, then put on hold on April 9.
A collective view of the fallout could emerge from Group of Seven finance ministers, depending on whether they can agree on a communique when they meet in Canada starting on Tuesday.
Elsewhere, housing data in the US, inflation releases from Japan to the UK to Canada, a likely interest-rate cut in Australia and minutes of the ECB’s April decision are among the highlights.
These positive fundamental factors marry well with the tailwinds that stem from increased corporate equity buybacks and a broad array of systematic and mechanical flows, with CTAs buyers of S&P 500 futures as the index rises above key buy trigger levels. Options dealers – who had recently been big sellers of call options – subsequently bought SPY ETFs, Nvidia and Tesla to adjust their deltas. While the further reduction in S&P 500 20-day realised volatility has also seen volatility-targeting funds increase both their US equity exposure and leverage within the portfolio.
The performance of the SPX has been wholly impressive - not just from absolute performance (the SPX has rallied 23% from the April low) – but also from the fact that in the past 15 trading sessions, we've only seen one day with the S&P 500 closing 1% lower. However, after this run, the daily chart is showing signs of exhaustion, with the buyers hesitating to push the index above 5900.

For now, I remain skewed and open-minded to the prospect of further upside and will remain so until price closes (daily timeframe) below both the 8-day EMA and the rising uptrend (drawn from the 9 April low). With the index seeing ever diminishing daily high-low trading ranges, we see the technical set-up forming a rising wedge pattern – again, until the index closes below the rising trend support, I am open to scenario that the index could push further higher and where an upside break of 5930 would see the index target 6000 and from there the ATH's of 6144.
With the S&P 500 in a mature trending state, with lower volatility and range compression, the environment (for those trading on higher timeframes) has favoured long momentum and carry strategies.

Statistical relationships between S&P 500 companies have broken down, with the 1-month realised correlation between S&P 500 companies falling to 19% - the 28th percentile of the 12-month range. Lower correlations are not only indicative of reduced volatility but also highlight an improved environment for stock pickers, with recent investor flows headed towards high beta, high growth and cyclical equities.

While US large-cap tech and consumer discretionary plays have outperformed, we see good participation in the rally, with 86% of S&P 500 companies now above the 20-day MA, a 10 ppt increase from last week. We also see 80% of S&P 500 companies above the 50-day MA, with 30% of companies closing at a 4-week high. One can view the market internals as a guide on the participation, while others may see the market internals as a contrarian indicator, with the current standing suggestive that we're reaching the ‘Greed' phase in the rally, with much of the good news in the price.
We see that volumes in both the SPX cash and futures have been consistently in line with the 15-day average, and from here I will be watching for any marked increase in volumes on down days.
Earnings this week from Target and Home Depot will get focus from traders, and the guidance that these retailers offer on how they see the tariff landscape evolve and how they plan to manage their margins has the potential to impact the broad index. The US fiscal also gets increased attention with Trump looking to pass his tax policy through the House – a factor that has many considering future deficit levels and how this translates into higher Treasury supply and ultimately US Treasury pricing. With yields across the Treasury curve pushing range highs, a further push higher could start to weigh more on the equity market, although it's the rate of change (in yield) that matters most to equity valuation.
Often the biggest factor that could compel further upside or an increased bout of profit taking is price itself - and with market players having aggressively covered shorts, running down portfolio hedges and amassing a reasonable long position in high beta equity and S&P 500 futures, if the S&P 500 rolls over and breaks trend support that in itself could lead to other players reducing their equity exposure.
So, in summary, I remain with a long bias for the S&P 500 but will be guided by the price action and technicals and would reassess as and when price breaks below these triggers.
Good luck to all.
728 RM B 7/F GEE LOK IND BLDG NO 34 HUNG TO RD KWUN TONG KLN HONG KONG


White Label
Data API
Web Plug-ins
Poster Maker
Affiliate Program
The risk of loss in trading financial instruments such as stocks, FX, commodities, futures, bonds, ETFs and crypto can be substantial. You may sustain a total loss of the funds that you deposit with your broker. Therefore, you should carefully consider whether such trading is suitable for you in light of your circumstances and financial resources.
No decision to invest should be made without thoroughly conducting due diligence by yourself or consulting with your financial advisors. Our web content might not suit you since we don't know your financial conditions and investment needs. Our financial information might have latency or contain inaccuracy, so you should be fully responsible for any of your trading and investment decisions. The company will not be responsible for your capital loss.
Without getting permission from the website, you are not allowed to copy the website's graphics, texts, or trademarks. Intellectual property rights in the content or data incorporated into this website belong to its providers and exchange merchants.
Not Logged In
Log in to access more features

FastBull Membership
Not yet
Purchase


Log In
Sign Up


