• Trade
  • Markets
  • Copy
  • Contests
  • News
  • 24/7
  • Calendar
  • Q&A
  • Chats
Trending
Screeners
SYMBOL
LAST
BID
ASK
HIGH
LOW
NET CHG.
%CHG.
SPREAD
SPX
S&P 500 Index
6827.42
6827.42
6827.42
6899.86
6801.80
-73.58
-1.07%
--
DJI
Dow Jones Industrial Average
48458.04
48458.04
48458.04
48886.86
48334.10
-245.98
-0.51%
--
IXIC
NASDAQ Composite Index
23195.16
23195.16
23195.16
23554.89
23094.51
-398.69
-1.69%
--
USDX
US Dollar Index
98.000
98.080
98.000
98.070
97.920
+0.050
+ 0.05%
--
EURUSD
Euro / US Dollar
1.17288
1.17295
1.17288
1.17447
1.17276
-0.00106
-0.09%
--
GBPUSD
Pound Sterling / US Dollar
1.33643
1.33652
1.33643
1.33740
1.33546
-0.00064
-0.05%
--
XAUUSD
Gold / US Dollar
4339.08
4339.42
4339.08
4347.21
4294.68
+39.69
+ 0.92%
--
WTI
Light Sweet Crude Oil
57.469
57.499
57.469
57.601
57.194
+0.236
+ 0.41%
--

Community Accounts

Signal Accounts
--
Profit Accounts
--
Loss Accounts
--
View More

Become a signal provider

Sell trading signals to earn additional income

View More

Guide to Copy Trading

Get started with ease and confidence

View More

Signal Accounts for Members

All Signal Accounts

Best Return
  • Best Return
  • Best P/L
  • Best MDD
Past 1W
  • Past 1W
  • Past 1M
  • Past 1Y

All Contests

  • All
  • Trump Updates
  • Recommend
  • Stocks
  • Cryptocurrencies
  • Central Banks
  • Featured News
Top News Only
Share

Swiss Government Sees 2027 CPI At +0.5%

Share

Swiss Government Sees 2026 CPI At +0.2% (Previous Forecast Was +0.5%)

Share

Reuters Calculation - India's Nov Services Trade Surplus At $17.9 Billion

Share

India Trade Secretary: Reduction In Imports In November Due To Fall In Gold, Oil And Coal Shipments

Share

India Trade Secretary: Gold Imports Have Declined In Nov By About 60%

Share

India Trade Secretary: Exports In Sectors Such Engineering, Electronics , Gems And Jewellery Aided November Figures

Share

India's Nov Merchandise Trade Deficit At $24.53 Billion - Reuters Calculation (Poll $32 Billion)

Share

India's Nov Merchandise Imports At $62.66 Billion

Share

India's Nov Merchandise Exports At $38.13 Billion

Share

Stats Office - Swiss November Producer/Import Prices -1.6% Year-On-Year (Versus-1.7% In Prior Month)

Share

Stats Office - Swiss November Producer/Import Prices -0.5% Month-On-Month (Versus-0.3% In Prior Month)

Share

Thailand To Hold Elections On Feb 8 - Multiple Local Media Reports

Share

Taiwan Dollar Falls 0.6% To 31.384 Per USA Dollar, Lowest Since December 3

Share

Stats Office - Botswana November Consumer Inflation At 0.0% Month-On-Month

Share

Stats Office - Botswana November Consumer Inflation At 3.8% Year-On-Year

Share

Statistics Bureau - Kazakhstan's Jan-Nov Industrial Output +7.4% Year-On-Year

Share

Fca: Sets Out Plans To Help Build Mortgage Market Of Future

Share

Eurostoxx 50 Futures Up 0.38%, DAX Futures Up 0.43%, FTSE Futures Up 0.37%

Share

[Delivery Of New US Presidential Aircraft Delayed Again] According To The Latest Timeline Released By The US Air Force, The Delivery Of The First Of The Two Newly Commissioned Air Force One Presidential Aircraft Will Not Be Earlier Than 2028. This Means That The Delivery Of The New Air Force One Has Been Delayed Once Again

Share

German Nov Wholesale Prices +0.3% Month-On-Month

TIME
ACT
FCST
PREV
France HICP Final MoM (Nov)

A:--

F: --

P: --

China, Mainland Outstanding Loans Growth YoY (Nov)

A:--

F: --

P: --

China, Mainland M2 Money Supply YoY (Nov)

A:--

F: --

P: --

China, Mainland M0 Money Supply YoY (Nov)

A:--

F: --

P: --

China, Mainland M1 Money Supply YoY (Nov)

A:--

F: --

P: --

India CPI YoY (Nov)

A:--

F: --

P: --

India Deposit Gowth YoY

A:--

F: --

P: --

Brazil Services Growth YoY (Oct)

A:--

F: --

P: --

Mexico Industrial Output YoY (Oct)

A:--

F: --

P: --

Russia Trade Balance (Oct)

A:--

F: --

P: --

Philadelphia Fed President Henry Paulson delivers a speech
Canada Building Permits MoM (SA) (Oct)

A:--

F: --

P: --

Canada Wholesale Sales YoY (Oct)

A:--

F: --

P: --

Canada Wholesale Inventory MoM (Oct)

A:--

F: --

P: --

Canada Wholesale Inventory YoY (Oct)

A:--

F: --

P: --

Canada Wholesale Sales MoM (SA) (Oct)

A:--

F: --

P: --

Germany Current Account (Not SA) (Oct)

A:--

F: --

P: --

U.S. Weekly Total Rig Count

A:--

F: --

P: --

U.S. Weekly Total Oil Rig Count

A:--

F: --

P: --

Japan Tankan Small Manufacturing Outlook Index (Q4)

A:--

F: --

P: --

Japan Tankan Large Non-Manufacturing Diffusion Index (Q4)

A:--

F: --

P: --

Japan Tankan Large Non-Manufacturing Outlook Index (Q4)

A:--

F: --

P: --

Japan Tankan Large Manufacturing Outlook Index (Q4)

A:--

F: --

P: --

Japan Tankan Small Manufacturing Diffusion Index (Q4)

A:--

F: --

P: --

Japan Tankan Large Manufacturing Diffusion Index (Q4)

A:--

F: --

P: --

Japan Tankan Large-Enterprise Capital Expenditure YoY (Q4)

A:--

F: --

P: --

U.K. Rightmove House Price Index YoY (Dec)

A:--

F: --

P: --

China, Mainland Industrial Output YoY (YTD) (Nov)

A:--

F: --

P: --

China, Mainland Urban Area Unemployment Rate (Nov)

A:--

F: --

P: --

Saudi Arabia CPI YoY (Nov)

A:--

F: --

P: --

Euro Zone Industrial Output YoY (Oct)

--

F: --

P: --

Euro Zone Industrial Output MoM (Oct)

--

F: --

P: --

Canada Existing Home Sales MoM (Nov)

--

F: --

P: --

Euro Zone Total Reserve Assets (Nov)

--

F: --

P: --

U.K. Inflation Rate Expectations

--

F: --

P: --

Canada National Economic Confidence Index

--

F: --

P: --

Canada New Housing Starts (Nov)

--

F: --

P: --

U.S. NY Fed Manufacturing Employment Index (Dec)

--

F: --

P: --

U.S. NY Fed Manufacturing Index (Dec)

--

F: --

P: --

Canada Core CPI YoY (Nov)

--

F: --

P: --

Canada Manufacturing Unfilled Orders MoM (Oct)

--

F: --

P: --

U.S. NY Fed Manufacturing Prices Received Index (Dec)

--

F: --

P: --

U.S. NY Fed Manufacturing New Orders Index (Dec)

--

F: --

P: --

Canada Manufacturing New Orders MoM (Oct)

--

F: --

P: --

Canada Core CPI MoM (Nov)

--

F: --

P: --

Canada Trimmed CPI YoY (SA) (Nov)

--

F: --

P: --

Canada Manufacturing Inventory MoM (Oct)

--

F: --

P: --

Canada CPI YoY (Nov)

--

F: --

P: --

Canada CPI MoM (Nov)

--

F: --

P: --

Canada CPI YoY (SA) (Nov)

--

F: --

P: --

Canada Core CPI MoM (SA) (Nov)

--

F: --

P: --

Canada CPI MoM (SA) (Nov)

--

F: --

P: --

Federal Reserve Board Governor Milan delivered a speech
U.S. NAHB Housing Market Index (Dec)

--

F: --

P: --

Australia Composite PMI Prelim (Dec)

--

F: --

P: --

Australia Services PMI Prelim (Dec)

--

F: --

P: --

Australia Manufacturing PMI Prelim (Dec)

--

F: --

P: --

Japan Manufacturing PMI Prelim (SA) (Dec)

--

F: --

P: --

U.K. Unemployment Claimant Count (Nov)

--

F: --

P: --

U.K. Unemployment Rate (Nov)

--

F: --

P: --

U.K. 3-Month ILO Unemployment Rate (Oct)

--

F: --

P: --

Q&A with Experts
    • All
    • Chatrooms
    • Groups
    • Friends
    Connecting
    .
    .
    .
    Type here...
    Add Symbol or Code

      No matching data

      All
      Trump Updates
      Recommend
      Stocks
      Cryptocurrencies
      Central Banks
      Featured News
      • All
      • Russia-Ukraine Conflict
      • Middle East Flashpoint
      • All
      • Russia-Ukraine Conflict
      • Middle East Flashpoint
      Search
      Products

      Charts Free Forever

      Chats Q&A with Experts
      Screeners Economic Calendar Data Tools
      Membership Features
      Data Warehouse Market Trends Institutional Data Policy Rates Macro

      Market Trends

      Market Sentiment Order Book Forex Correlations

      Top Indicators

      Charts Free Forever
      Markets

      News

      News Analysis 24/7 Columns Education
      From Institutions From Analysts
      Topics Columnists

      Latest Views

      Latest Views

      Trending Topics

      Top Columnists

      Latest Update

      Signals

      Copy Rankings Latest Signals Become a signal provider AI Rating
      Contests
      Brokers

      Overview Brokers Assessment Rankings Regulators News Claims
      Broker listing Forex Brokers Comparison Tool Live Spread Comparison Scam
      Q&A Complaint Scam Alert Videos Tips to Detect Scam
      More

      Business
      Events
      Careers About Us Advertising Help Center

      White Label

      Data API

      Web Plug-ins

      Affiliate Program

      Awards Institution Evaluation IB Seminar Salon Event Exhibition
      Vietnam Thailand Singapore Dubai
      Fans Party Investment Sharing Session
      FastBull Summit BrokersView Expo
      Recent Searches
        Top Searches
          Markets
          News
          Analysis
          User
          24/7
          Economic Calendar
          Education
          Data
          • Names
          • Latest
          • Prev

          View All

          No data

          Scan to Download

          Faster Charts, Chat Faster!

          Download App
          English
          • English
          • Español
          • العربية
          • Bahasa Indonesia
          • Bahasa Melayu
          • Tiếng Việt
          • ภาษาไทย
          • Français
          • Italiano
          • Türkçe
          • Русский язык
          • 简中
          • 繁中
          Open Account
          Search
          Products
          Charts Free Forever
          Markets
          News
          Signals

          Copy Rankings Latest Signals Become a signal provider AI Rating
          Contests
          Brokers

          Overview Brokers Assessment Rankings Regulators News Claims
          Broker listing Forex Brokers Comparison Tool Live Spread Comparison Scam
          Q&A Complaint Scam Alert Videos Tips to Detect Scam
          More

          Business
          Events
          Careers About Us Advertising Help Center

          White Label

          Data API

          Web Plug-ins

          Affiliate Program

          Awards Institution Evaluation IB Seminar Salon Event Exhibition
          Vietnam Thailand Singapore Dubai
          Fans Party Investment Sharing Session
          FastBull Summit BrokersView Expo

          S&P 500 Technical Analysis – We Have Two Main Risks Ahead

          Glendon

          Economic

          Stocks

          Summary:

          The S&P 500 continuesto be supported given the lack of bearish drivers. Last Thursday’s NFP lookedlike it could offer a bigger pullback on a hawkish repricing in interest rateexpectations but the positive data came with lower wage growth, which is greatfor the stock market.

          FundamentalOverview

          The S&P 500 continuesto be supported given the lack of bearish drivers. Last Thursday’s NFP lookedlike it could offer a bigger pullback on a hawkish repricing in interest rateexpectations but the positive data came with lower wage growth, which is greatfor the stock market.

          In the short-term, the onlyrisk I can see is further hawkish repricing in interest rates expectations, butwe will likely need a hot CPI for that. That should provide a deeper pullback. Butgiven that the Fed's reaction function remains to either wait more or cut, themarket should eventually get back to its upward trend.

          We now have two main risksahead for the bulls: tariffs noise and US CPI. The White House is expected tosign trade deals and send letters with the new tariff rates to countries thathave not reached a deal yet. The good news is that we have once again adeadline, which is August 1st. Therefore, it looks like the usual negotiationstactic to speed up the process and accept the US requests.

          On the other hand, we havethe US CPI coming up next week. To keep the trend going, we would likely needsoft inflation figures as a hot report should trigger a deeper pullback.

          S&P 500Technical Analysis – Daily Timeframe

          S&P 500 Daily

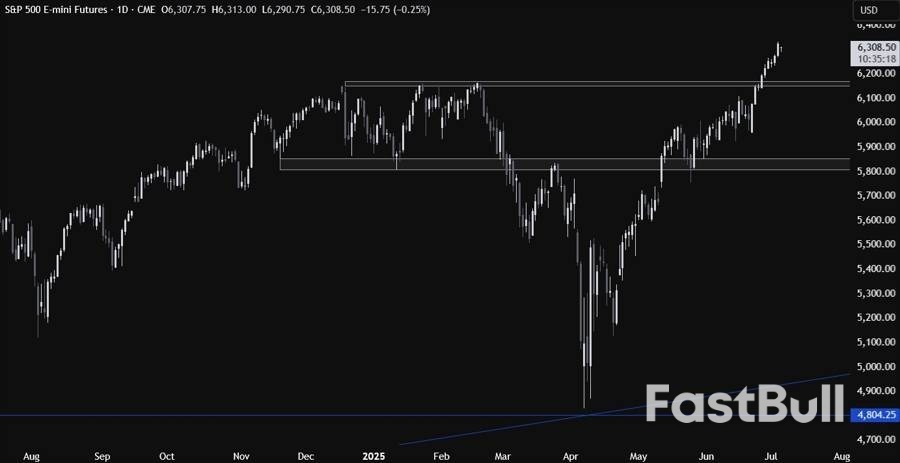
          On the daily chart, we cansee that the S&P 500 continued to print new all-time highs pretty much everydayonce the price broke above the February highs. From a risk managementperspective, the buyers will have a better risk to reward setup around theprevious all-time high at 6,160-ish level to position for the continuation ofthe uptrend. The sellers, on the other hand, will want to see the price breakinglower to pile in for a drop into the 6,000 level next.

          S&P 500 TechnicalAnalysis – 4 hour Timeframe

          S&P 500 4 hour

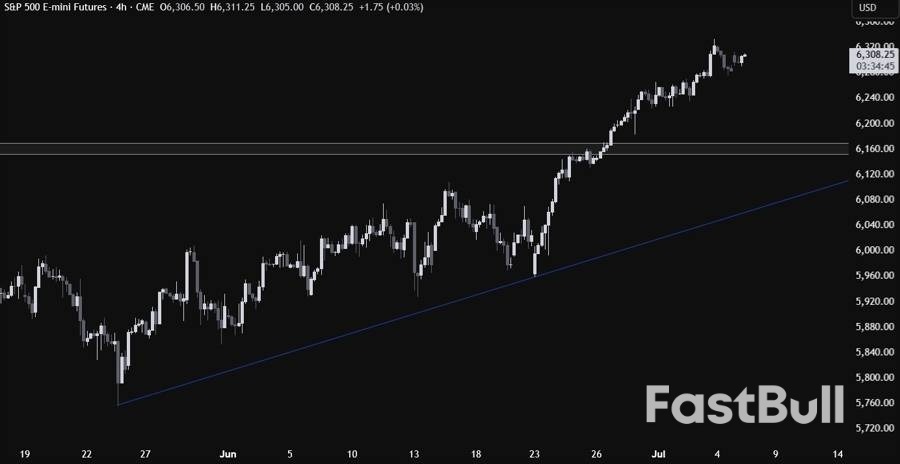
          On the 4 hour chart, we cansee that we have an upward trendline defining the uptrend. If we were toget a pullback all the way into the trendline, we can expect the dip-buyers tolean on it to position for a rally into new all-time highs with a better riskto reward setup. The sellers, on the other hand, will look for a break lower toincrease the bearish bets into the 5,800 level next.

          S&P 500 TechnicalAnalysis – 1 hour Timeframe

          S&P 500 1 hour

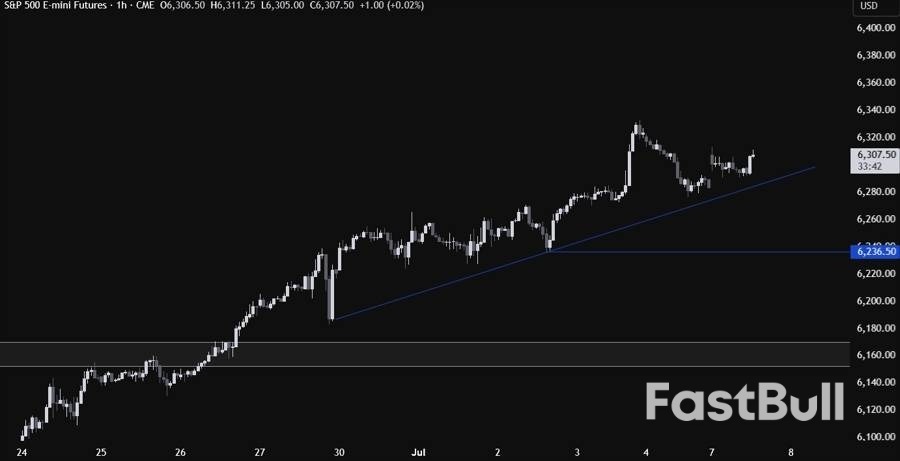
          On the 1 hour chart, we cansee that we have a minor upward trendline defining the bullish momentum on thistimeframe. The buyers will likely continue to lean on the trendline to keeppushing into new highs, while the sellers will look for a break lower to targeta deeper pullback into the 6,236 level first and, upon a further break lower,into the 6,160 price area.

          Source: ForexLive

          To stay updated on all economic events of today, please check out our Economic calendar
          Risk Warnings and Disclaimers
          You understand and acknowledge that there is a high degree of risk involved in trading. Following any strategies or investment methods may lead to potential losses. The content on the site is provided by our contributors and analysts for information purposes only. You are solely responsible for determining whether any trading assets, securities, strategy, or any other product is suitable for investing based on your own investment objectives and financial situation.
          Add to Favorites
          Share

          Stocks and dollar drift as US shifts tariff goal posts, oil skids

          Adam

          Stocks

          Forex

          Stocks edged downwards and the dollar drifted near multi-year lows on Monday, after U.S. officials flagged a delay on tariffs but failed to provide specifics on the changes, while oil prices slid as OPEC+ opened the supply spigots more than expected.
          The United States is close to finalising several trade agreements in the coming days and will notify other countries of higher tariff rates by July 9, President Donald Trump said on Sunday, with the higher rates to take effect on August 1.
          "President Trump's going to be sending letters to some of our trading partners saying that if you don't move things along, then on August 1 you will boomerang back to your April 2 tariff level," U.S. Treasury Secretary Scott Bessent told CNN.
          Trump in April announced a 10% base tariff rate on most countries and higher "reciprocal" rates ranging up to 50%, with an original deadline of this Wednesday.
          However, Trump also said levies could range in value from "maybe 60% or 70%", and threatened an extra 10% on countries aligning themselves with the "Anti-American policies" of the BRICS group of Brazil, Russia, India and China.
          With very few actual trade deals done, analysts had always suspected the date would be pushed out, though it was still not clear if the new deadline applied to all trading partners or just some.
          Investors have grown somewhat used to the uncertainty surrounding U.S. trade policy and the initial market reaction was cautious. S&P 500 futures fell 0.44% and Nasdaq futures were down 0.6% in early European trading hours.
          Europe's benchmark STOXX index was down just 0.02%, while MSCI's broadest index of Asia-Pacific shares outside Japan (.MIAPJ0000PUS), eased 0.6%.
          The muted market reaction to the latest tariff twist showed that investors were becoming more attuned to the cycle of dramatic lurches in U.S. trade policy under Trump, analysts said.
          "The market now feels as if it has a handle on which countries or types of products will be most affected," said Scott Chronert, investment strategist for Citigroup.
          "That doesn’t mean every scenario is priced in – it’s still set up for episodes of volatility. As always, people will sell first and ask questions later."
          OPEC+ SQUEEZE
          Safe-haven bonds were better bid, with 10-year Treasury yields down almost 2 basis points at 4.3379% .
          Major currencies were mixed as the dollar index nudged up 0.4% to 97.292. The euro held at $1.1738 , just short of last week's top of $1.1830, while the dollar was 0.3% firmer at 145.02 yen .
          The export-exposed Australian dollar was again used as a proxy for trade risk and fell 0.8% to $0.6500.
          The dollar has been undermined by investor concerns about Trump's often chaotic tariff policy and what that might do to economic growth and inflation.
          The same worries have kept the Federal Reserve from cutting rates and minutes of its last meeting should offer more colour on when the majority of members might resume easing.
          It is a relatively quiet week for Fed speakers with only two district presidents on the docket, while economic data is also sparse.
          The Reserve Bank of Australia is widely expected to cut its rates by a quarter point to 3.60% at a meeting on Tuesday, the third easing this cycle, and markets imply an eventual destination for rates of 2.85% or 3.10%.
          New Zealand's central bank meets on Wednesday and is likely to hold rates at 3.25%, having already slashed by 225 basis points over the past year.
          In commodity markets, gold slipped 0.7% to $3,311 an ounce , though it did gain almost 2% last week as the dollar fell.
          Oil prices slid anew after the Organization of the Petroleum Exporting Countries and their allies, a group known as OPEC+, agreed on Saturday to raise production by a larger-than-expected 548,000 barrels per day in August.
          The group also warned that it could hike by a similar amount in September, leaving analysts with the impression it was trying to squeeze lower margin producers and particularly those pulling oil from U.S. shale.
          Brent dropped 0.4% to $68.01 a barrel, while U.S. crude fell 1.1% to $65.28 per barrel.

          Source: Reuters

          Risk Warnings and Disclaimers
          You understand and acknowledge that there is a high degree of risk involved in trading. Following any strategies or investment methods may lead to potential losses. The content on the site is provided by our contributors and analysts for information purposes only. You are solely responsible for determining whether any trading assets, securities, strategy, or any other product is suitable for investing based on your own investment objectives and financial situation.
          Add to Favorites
          Share

          China’s Central Bank Probes Dollar Weakness as Yuan Stability Faces Policy Crossroads

          Gerik

          Economic

          Forex

          PBOC Survey Suggests Policy Alert Over Rapid Yuan Gains

          The People's Bank of China (PBOC) has initiated a quiet but significant step in response to global currency movements. According to multiple sources, the central bank recently surveyed financial institutions about the U.S. dollar’s weakening trend and the implications for the yuan. Though the PBOC did not publicly comment, the move is being interpreted as a signal of rising concern over the potential for abrupt appreciation of the Chinese currency in the context of mounting trade uncertainties.
          The timing of the survey is critical. It comes just days before the expiration of President Donald Trump's 90-day tariff pause on imports from numerous countries, and roughly a month before a broader set of China-specific triple-digit tariffs may be reimposed. These impending decisions heighten currency volatility risk and could exacerbate capital flow pressures for China.

          Dollar Index Suffers Historic Decline as Trade Policy Weighs

          The survey follows a steep decline in the U.S. dollar, which has seen its worst first-half performance since 1973. The dollar index (DXY), a benchmark measuring the greenback against a basket of six major currencies, is down 11% year-to-date and 6.6% since April 2 alone—coinciding with Trump's announcement of the "Liberation Day" tariffs.
          This dollar weakening is attributed to multiple intersecting forces: aggressive fiscal expansion, market repricing of Federal Reserve rate cut expectations, and increasing global pushback against Washington’s trade policies. For China, a weakening dollar can inadvertently place upward pressure on the yuan, tightening financial conditions at a time when domestic growth remains uneven.

          Yuan Strength Stable But Under Scrutiny

          Although the yuan has remained relatively stable, with a modest gain of 1.3% since April, its trajectory has become more sensitive due to declining dollar strength. This relationship is more than mathematical—there is a strategic context. A stronger yuan could weaken the competitiveness of Chinese exports, just as Beijing seeks to maintain external stability amid fragile domestic recovery and geopolitical pressure from U.S. tariffs.
          One interpretation of the PBOC’s outreach is that policymakers are preparing to preemptively manage currency expectations. A sharp yuan appreciation could trigger speculative inflows or lead to premature easing expectations, complicating the central bank’s monetary strategy. Additionally, it could embolden calls in Washington to escalate trade pressure under the guise of currency manipulation allegations.

          Policy Implications and Forward-Looking Signals

          While the PBOC’s inquiry is not a direct market intervention, it acts as a signal of policy attentiveness. It also reflects a potential shift from passive observation to more proactive calibration of capital and currency management tools. The bank may now be assessing whether to step in more visibly through open market operations, verbal intervention, or a recalibration of the yuan’s daily fixing mechanism to control appreciation pressure.
          The broader context includes ongoing trade negotiations with the U.S., where the currency value of the yuan plays a critical role. If the dollar continues to slide and the yuan appreciates too quickly, the PBOC may need to act decisively to contain financial spillovers. By initiating dialogue with major financial institutions, the PBOC is gathering market intelligence to prepare contingency plans.
          China’s central bank appears to be laying the groundwork for a more active posture in currency management as the global environment becomes increasingly reactive to U.S. policy moves. With the dollar falling sharply and geopolitical trade tensions resurfacing, the PBOC’s inquiry into dollar weakness underscores Beijing’s caution in allowing the yuan to appreciate too far, too fast. How Chinese policymakers respond next could shape capital flows, trade negotiations, and regional currency dynamics in the months ahead.

          Source: Reuters

          To stay updated on all economic events of today, please check out our Economic calendar
          Risk Warnings and Disclaimers
          You understand and acknowledge that there is a high degree of risk involved in trading. Following any strategies or investment methods may lead to potential losses. The content on the site is provided by our contributors and analysts for information purposes only. You are solely responsible for determining whether any trading assets, securities, strategy, or any other product is suitable for investing based on your own investment objectives and financial situation.
          Add to Favorites
          Share

          Wall Street Futures Dip as Investors Eye Tariff Clarity and Political Unrest

          Gerik

          Economic

          Futures Slip Amid Trade Policy Uncertainty

          Wall Street’s record-breaking rally hit a pause Monday as U.S. index futures declined, weighed down by renewed trade policy uncertainty and shifting political dynamics. At 5:30 a.m. ET, Dow futures fell 0.18%, S&P 500 futures dropped 0.45%, and Nasdaq 100 futures sank 0.61%, as markets struggled to price in the impact of potentially sweeping tariff measures threatened by President Donald Trump.
          Trump confirmed over the weekend that the White House will finalize new trade pacts in the coming days and will notify countries of revised tariff rates by July 9, with implementation set for August 1. While some countries have been granted a short reprieve, the tariff landscape remains fluid, which has created a risk-off tone at the start of a week lacking major economic releases.

          BRICS Tariff Threat Increases Market Fragility

          In a particularly aggressive shift, Trump threatened to impose an additional 10% tariff on any nation aligned with the "anti-American policies" of BRICS members Brazil, Russia, India, China, and South Africa. This stance injects new geopolitical risk into the market narrative, as the BRICS bloc encompasses major U.S. trading partners and global growth engines. The threat compounds the confusion following Trump’s earlier April proposal of base tariffs of 10%, with some as high as 50%, which remain partially delayed until July 9.
          The lack of detailed implementation strategy and the possibility of sudden policy reversals have increased perceived policy risk. Investors are reacting to what appears to be a reactive, non-transparent trade framework, which poses challenges for forward-looking investment strategies.

          Musk's Political Foray Adds Another Layer of Uncertainty

          Tesla shares plunged 6.6% in premarket trading following CEO Elon Musk’s announcement of a new political party. The move escalates Musk’s ongoing public feud with Trump and adds to investor concern about leadership distraction during a period of operational stress at Tesla. The company’s global vehicle sales have declined for two straight quarters, and its position in key markets like Europe and China has weakened due to intensifying EV competition.
          The political development is being viewed as a non-economic variable with tangible market consequences, particularly because Musk’s entanglements now potentially expose Tesla and other Musk-led ventures to regulatory risk, while further alienating them from federal incentives.

          Tech Sector Sees Profit-Taking After Recent Surge

          Tech stocks, which have been leading the 2025 market rally, were also under pressure. Nvidia, which recently neared a $4 trillion market cap, was down nearly 1% on Monday. The pullback suggests profit-taking after a massive run-up in valuations, as traders become more selective amid increased macro and policy uncertainty.
          Despite strong labor data reported last Thursday pushing the S&P 500 and Nasdaq to record highs market enthusiasm appears tempered by the unpredictability of fiscal and trade policy under Trump’s administration.

          Fed in Focus as Rate Outlook Shifts

          The Federal Reserve remains caught in a delicate balancing act. Trump’s expansive tax-and-spend bill, passed by House Republicans and projected to increase the national debt by $3.4 trillion, introduces both stimulus and inflation risk. While the package may temporarily boost GDP growth, it complicates the Fed’s rate-setting calculus at a time when markets had been anticipating rate cuts.
          Minutes from the Fed’s June meeting, expected Wednesday, are likely to offer critical insight into how policymakers are interpreting these fiscal developments. For now, markets have removed expectations of a July rate cut. The likelihood of a September cut has dropped to 66%, according to CME’s FedWatch tool.
          Investors began the week in a defensive posture, balancing strong macro data against fresh geopolitical risk and unresolved trade policy. The combination of Trump’s erratic tariff threats, Elon Musk’s political detour, and uncertainty about the Fed’s next move has introduced a layer of complexity that could constrain equity momentum through July. Until clarity emerges particularly on trade execution and monetary guidance volatility may return as investors reassess valuations against a shifting policy backdrop.

          Source: Reuters

          To stay updated on all economic events of today, please check out our Economic calendar
          Risk Warnings and Disclaimers
          You understand and acknowledge that there is a high degree of risk involved in trading. Following any strategies or investment methods may lead to potential losses. The content on the site is provided by our contributors and analysts for information purposes only. You are solely responsible for determining whether any trading assets, securities, strategy, or any other product is suitable for investing based on your own investment objectives and financial situation.
          Add to Favorites
          Share

          Trump’s Rate-Cut Pressure Risks Undermining Fed Credibility Before New Chair Arrives

          Gerik

          Economic

          Political Pressure Casts Shadow Over Fed’s Autonomy

          President Donald Trump’s escalating demands for lower interest rates have reignited concerns about political interference at the Federal Reserve. By openly promising to appoint a future Fed chair who supports rate cuts, Trump has introduced new uncertainty into monetary policy expectations and increased skepticism among investors about the central bank’s independence.
          Trump has acknowledged that his public criticism may be complicating Powell’s ability to act, writing that “strong criticism” makes it more difficult for the chair to lower rates. This admission reveals a feedback loop in which political rhetoric distorts market perception, potentially undermining confidence in the Fed’s ability to act based solely on economic data.

          Undermining the Next Chair’s Authority Before Appointment

          Trump’s insistence that he will nominate “somebody that wants to cut rates” preconditions both the nominee’s public reputation and the market’s expectations. Jon Faust, a former adviser to Powell, warned that such comments could make the nominee appear beholden to political motivations rather than institutional independence. This perception could erode credibility from the outset, regardless of the individual’s qualifications or intentions.
          The risk is not just reputational. If markets begin to anticipate policy decisions driven more by political preference than macroeconomic fundamentals, the Fed could face rising bond yields, increased inflation expectations, and a more volatile financial environment. Historical precedents, such as the Nixon-era pressure on the Fed, highlight the long-term economic costs of compromised independence.

          Powell Remains Defiant, But Policy Stays Cautious

          Jerome Powell has not directly responded to Trump’s provocations, instead reiterating that the Fed remains committed to its dual mandate of price stability and maximum employment. With inflation cooling and the economic outlook uncertain due to Trump’s own trade and fiscal policies, the Fed has chosen to delay rate cuts for now. Powell emphasized on July 1 that he and his colleagues want to deliver a stable economy, but remain cautious about premature easing.
          Trump’s frustration stems in part from what he views as a sluggish response to changing conditions. He points to lower global rates and recent disinflation trends as justification for cutting now. However, the Fed has signaled it wants more clarity, especially as tariffs and tax cuts could fuel inflationary pressures, contradicting Trump’s argument.

          Next Fed Chair Faces a Difficult Balancing Act

          The shortlist of potential successors includes several figures aligned with Trump’s economic views, including Scott Bessent, Kevin Hassett, David Malpass, and Kevin Warsh. Most of these candidates support rate cuts in the near term. One exception is Christopher Waller, a current Fed governor, who has also suggested cuts may be warranted soon but who has publicly defended the institution’s independence.
          The challenge for any nominee will be to simultaneously satisfy the political expectations of the White House while maintaining market trust. As Derek Tang of LHMeyer/Monetary Policy Analytics explains, the nominee will need to articulate a compelling, data-driven rationale for easing policy to preserve legitimacy. If inflation expectations spike after the announcement, it may indicate markets are losing faith in the Fed’s credibility.

          Structural Checks May Limit Political Influence, But Not Market Reaction

          Despite the political noise, institutional safeguards remain. The Fed chair is only one vote among 12 on the Federal Open Market Committee. Any future chair will need consensus to change the policy stance. Still, perception matters: if financial markets believe the chair is a proxy for the president’s agenda, it could distort bond pricing, fuel inflation fears, and reduce the effectiveness of monetary guidance.
          Julia Coronado, founder of MacroPolicy Perspectives, noted that future Fed leadership may not overtly dismantle independence, but subtle shifts toward politically convenient decisions could still have meaningful consequences. Even incremental erosion of institutional norms may introduce lasting volatility into financial markets and complicate economic management.

          Market Trust in the Fed Faces a Stress Test

          Trump’s vocal campaign to steer the Fed toward immediate rate cuts, and his intent to appoint a like-minded successor, present a direct test of central bank independence. While the next chair will inherit structural checks and a data-dependent policy environment, the public framing of the nomination process already risks undermining trust in the institution.
          Whether markets view the eventual nominee as credible will depend not only on their credentials but also on their ability to assert policy decisions rooted in economic logic, not political loyalty. Until then, financial markets will remain watchful for signs that the Fed’s carefully preserved autonomy is yielding to short-term political demands.

          Source: Reuters

          To stay updated on all economic events of today, please check out our Economic calendar
          Risk Warnings and Disclaimers
          You understand and acknowledge that there is a high degree of risk involved in trading. Following any strategies or investment methods may lead to potential losses. The content on the site is provided by our contributors and analysts for information purposes only. You are solely responsible for determining whether any trading assets, securities, strategy, or any other product is suitable for investing based on your own investment objectives and financial situation.
          Add to Favorites
          Share

          Europe’s Equity Rally Slows, But the Euro Still Tells a Winning Story

          Gerik

          Economic

          Forex

          European Equities Lose Momentum as Wall Street Recovers

          The early-year advantage for European equities has largely faded. As of Friday’s close, the STOXX 600 index is up 6.6% year-to-date, nearly equal to the S&P 500’s 6.8% gain. This marks a sharp contraction from March, when the STOXX 600 had led the US benchmark by a full 10 percentage points, sparking hopes of sustained European outperformance after years of lagging behind.
          The reversal stems partly from a renewed surge in US tech stocks and improving investor sentiment toward American assets. However, beneath the surface of equities, a different narrative continues to unfold one where the euro is the outperformer and may still shift the balance in favor of European holdings.

          US Tech Surge Reclaims Global Investor Attention

          A major factor behind Wall Street’s comeback is the strength of the technology sector. After initial jitters from renewed trade tensions, optimism returned when US tech executives delivered robust earnings guidance during the latest reporting season. Tech now accounts for about one-third of the S&P 500’s market capitalization, and since early April, the sector has rallied 24%, led by Nvidia’s extraordinary 45% surge.
          Europe lacks comparable exposure to mega-cap technology stocks, leaving its indices structurally underweight in the very companies driving global equity momentum. This structural difference explains part of the performance divergence and highlights why European equity rallies are more sector-dependent and vulnerable to shifts in investor preference.

          Valuation Disparities Offer Room for Cautious Optimism

          Despite Wall Street’s renewed strength, many investors remain wary. The S&P 500’s record levels have prompted concerns about stretched valuations, especially given the fragility exposed by recent tariff announcements. In contrast, European equities still trade at lower valuation multiples, which many analysts argue better reflect current earnings dynamics.
          Madeleine Ronner of DWS notes that while slower earnings growth had previously justified the valuation gap, the trajectory is changing. European corporate earnings per share are rebounding, narrowing the differential with the US and potentially justifying a valuation rerating. DWS forecasts similar GDP growth rates for the US and Europe in 2025 and 2026, reinforcing expectations for steady earnings expansion across European markets.

          Sector Concentration Masks Broader Equity Weakness

          Though the STOXX 600 has risen this year, its gains are highly concentrated. Defence and banking stocks account for more than half of the index’s returns despite making up only 16% of its total weight. Defence stocks alone are up 50% year-to-date, driven by renewed NATO commitments and Germany’s defense spending overhaul. Banks have added 28% amid rising rate environments.
          However, this narrow breadth reflects a lingering lack of confidence in the broader European equity space. The strong performance of these sectors masks weakness in consumer, industrial, and technology segments. This concentration, paired with high valuation multiples Rheinmetall trades at over 50 times forward earnings suggests that sector-specific gains may not be sustainable if macro conditions shift.

          Currency Gains Reinforce European Advantage

          Where Europe has clearly outperformed in 2025 is in the currency market. The euro has appreciated 14% against the US dollar this year, reaching levels not seen in nearly four years and approaching the $1.20 mark. Initially forecasted to weaken below parity, the euro’s rally has been driven by a shift in global investor behavior. As appetite for US assets declined and concerns about dollar depreciation rose, many international investors increased their currency hedges or diverted flows to the eurozone.
          George Saravelos of Deutsche Bank points out that dollar weakness now requires only a pause in foreign buying not net selling. This shift in sentiment is reinforcing euro strength even without major capital flight from the US.

          Currency Translation Shapes Investor Returns

          This currency dynamic significantly impacts equity returns. For euro-based investors, gains in US stocks have been eroded by the euro’s strength. Although the S&P 500 is at an all-time high in dollar terms, when priced in euros, it is 9% below its February peak. Conversely, the STOXX 600 priced in dollars hit a new record in late June, despite still trailing its own euro-denominated highs from March.
          This divergence emphasizes that currency risk is now a key driver of cross-border investment performance. For European investors, the stronger euro has shielded them from some of the volatility in global equities. For American investors, rising costs of foreign assets have made European stocks less accessible despite attractive fundamentals.
          While the early-year equity lead for Europe has faded under the pressure of a US tech rebound, the euro’s strength continues to provide a compelling case for European asset allocation. As corporate earnings growth in Europe gradually recovers and currency appreciation enhances returns, especially for domestic investors, the broader narrative of European resurgence remains intact albeit through the lens of FX performance rather than equity indices alone. For now, the outperformance baton may have passed from stocks to the single currency.

          Source: Reuters

          To stay updated on all economic events of today, please check out our Economic calendar
          Risk Warnings and Disclaimers
          You understand and acknowledge that there is a high degree of risk involved in trading. Following any strategies or investment methods may lead to potential losses. The content on the site is provided by our contributors and analysts for information purposes only. You are solely responsible for determining whether any trading assets, securities, strategy, or any other product is suitable for investing based on your own investment objectives and financial situation.
          Add to Favorites
          Share

          Asia mid-session: Tariff uncertainty weighs on Asia equities; Gold, Oil Slip as US dollar rebounds US_United_States_Government_Flag

          MarketPulse by OANDA Group
          Most major Asia Pacific equity indices started the week on a weaker note, as investors turned cautious ahead of the expiration of the White House’s 90-day pause on higher global reciprocal tariffs (excluding China), scheduled for Wednesday, 9 July.

          Asia Pacific equities (except Singapore) weaken as tariff uncertainty looms

          Japan’s Nikkei 225 slipped 0.6% to 39,576, while Hong Kong’s Hang Seng Index edged 0.3% lower to 23,845, though it remained above its 50-day moving average near 23,330. US equity futures were also under pressure, with both the S&P 500 and Nasdaq 100 E-mini contracts declining 0.5% during Asia trading hours. Bucking the regional trend, Singapore’s Straits Times Index rose 0.3% to notch a fresh all-time intraday high of 4,026.

          Conflicting tariff signals from the White House

          Confusion surrounding the tariff timeline added to market jitters. Commerce Secretary Lutnick indicated that the higher tariffs would be implemented from 1 August, suggesting room for a deadline extension. However, President Trump stated over the weekend that formal letters announcing tariff hikes would be sent out on Monday and Tuesday, ahead of the 9 July deadline.

          US dollar gains; commodity currencies underperform

          The US Dollar Index rebounded 0.2% to 97.15 but remained capped by its 20-day moving average near 97.85. In today’s Asian session, the Japanese yen (-0.4%), Australian dollar (-0.6%), and New Zealand dollar (-0.7%) were the weakest performers against the greenback.

          Gold and Oil retreat

          Gold (XAU/USD) slipped 0.8% intraday to US$3,310, falling below its 50-day moving average at US$3,320. West Texas Intermediate (WTI) crude oil extended last week’s losses, down 0.4% to US$66.85 per barrel, breaching its 200-day moving average at US$69.15. The decline was driven by oversupply concerns after OPEC+ agreed to increase August production by 548,000 barrels per day, well above market expectations of 411,000 barrels.

          Chart of the day – GBP/USD at risk of breaking below 20-day moving average

           Asia mid-session: Tariff uncertainty weighs on Asia equities; Gold, Oil Slip as US dollar rebounds US_United_States_Government_Flag _1
          The GBP/USD has failed to make any significant recoveries since last Wednesday, 7 July, dramatic intraday decline of -150 pips to a 6-day low of 1.3563 on the onset of a possible replacement of UK Chancellor Reeves.
          Thereafter, the sterling pound has managed to bounce after a retest at 1.3570 (also the 20-day moving average) against the US dollar, but the hourly RSI momentum indicator has continued to flash out bearish momentum conditions since 4 July (see Fig 2).
          These observations suggest a potential minor corrective decline sequence within its medium-term uptrend phase. Watch the 1.3670/3690 key short-term pivotal resistance, and a break below 1.3570 exposes the next intermediate support at 1.3470 (also the 50-day moving average)
          On the flip side, a clearance above 1.3690 invalidates the bearish scenario to kickstart another bullish impulsive up move sequence for the next intermediate resistances to come in at 1.3800/3830 and 1.3870.

          Source: OANDA

          Risk Warnings and Disclaimers
          You understand and acknowledge that there is a high degree of risk involved in trading. Following any strategies or investment methods may lead to potential losses. The content on the site is provided by our contributors and analysts for information purposes only. You are solely responsible for determining whether any trading assets, securities, strategy, or any other product is suitable for investing based on your own investment objectives and financial situation.
          Add to Favorites
          Share
          FastBull
          Copyright © 2025 FastBull Ltd

          728 RM B 7/F GEE LOK IND BLDG NO 34 HUNG TO RD KWUN TONG KLN HONG KONG

          TelegramInstagramTwitterfacebooklinkedin
          App Store Google Play Google Play
          Products
          Charts

          Chats

          Q&A with Experts
          Screeners
          Economic Calendar
          Data
          Tools
          Membership
          Features
          Function
          Markets
          Copy Trading
          Latest Signals
          Contests
          News
          Analysis
          24/7
          Columns
          Education
          Company
          Careers
          About Us
          Contact Us
          Advertising
          Help Center
          Feedback
          User Agreement
          Privacy Policy
          Business

          White Label

          Data API

          Web Plug-ins

          Poster Maker

          Affiliate Program

          Risk Disclosure

          The risk of loss in trading financial instruments such as stocks, FX, commodities, futures, bonds, ETFs and crypto can be substantial. You may sustain a total loss of the funds that you deposit with your broker. Therefore, you should carefully consider whether such trading is suitable for you in light of your circumstances and financial resources.

          No decision to invest should be made without thoroughly conducting due diligence by yourself or consulting with your financial advisors. Our web content might not suit you since we don't know your financial conditions and investment needs. Our financial information might have latency or contain inaccuracy, so you should be fully responsible for any of your trading and investment decisions. The company will not be responsible for your capital loss.

          Without getting permission from the website, you are not allowed to copy the website's graphics, texts, or trademarks. Intellectual property rights in the content or data incorporated into this website belong to its providers and exchange merchants.

          Not Logged In

          Log in to access more features

          FastBull Membership

          Not yet

          Purchase

          Become a signal provider
          Help Center
          Customer Service
          Dark Mode
          Price Up/Down Colors

          Log In

          Sign Up

          Position
          Layout
          Fullscreen
          Default to Chart
          The chart page opens by default when you visit fastbull.com