• Trade
  • Markets
  • Copy
  • Contests
  • News
  • 24/7
  • Calendar
  • Q&A
  • Chats
Trending
Screeners
SYMBOL
LAST
BID
ASK
HIGH
LOW
NET CHG.
%CHG.
SPREAD
SPX
S&P 500 Index
6827.42
6827.42
6827.42
6899.86
6801.80
-73.58
-1.07%
--
DJI
Dow Jones Industrial Average
48458.04
48458.04
48458.04
48886.86
48334.10
-245.98
-0.51%
--
IXIC
NASDAQ Composite Index
23195.16
23195.16
23195.16
23554.89
23094.51
-398.69
-1.69%
--
USDX
US Dollar Index
97.920
98.000
97.920
98.070
97.810
-0.030
-0.03%
--
EURUSD
Euro / US Dollar
1.17450
1.17457
1.17450
1.17596
1.17262
+0.00056
+ 0.05%
--
GBPUSD
Pound Sterling / US Dollar
1.33845
1.33852
1.33845
1.33961
1.33546
+0.00138
+ 0.10%
--
XAUUSD
Gold / US Dollar
4330.96
4331.30
4330.96
4350.16
4294.68
+31.57
+ 0.73%
--
WTI
Light Sweet Crude Oil
56.830
56.860
56.830
57.601
56.789
-0.403
-0.70%
--

Community Accounts

Signal Accounts
--
Profit Accounts
--
Loss Accounts
--
View More

Become a signal provider

Sell trading signals to earn additional income

View More

Guide to Copy Trading

Get started with ease and confidence

View More

Signal Accounts for Members

All Signal Accounts

Best Return
  • Best Return
  • Best P/L
  • Best MDD
Past 1W
  • Past 1W
  • Past 1M
  • Past 1Y

All Contests

  • All
  • Trump Updates
  • Recommend
  • Stocks
  • Cryptocurrencies
  • Central Banks
  • Featured News
Top News Only
Share

Portugal Treasury Expects 2026 Net Financing Needs At 29.4 Billion Euros, Up From 25.8 Billion In 2025

Share

Bank Of America Says With Indonesia's Smelter Now Ramping Up, It Expects Aluminium Supply Growth To Accelerate To 2.6% Year On Year In 2026

Share

Bank Of America Expects A Deficit In Aluminium Next Year And Sees Prices Pushing Above $3000/T

Share

Fed Data - USA Effective Federal Funds Rate At 3.64 Percent On 12 December On $102 Billion In Trades Versus 3.64 Percent On $99 Billion On 11 December

Share

Brazil's Petrobras Says No Impact Seen On Oil, Petroleum Products Output As Workers Start Planned Strike

Share

Statement: US Travel Group Warns New Proposed Trump Administration Requirements For Foreign Tourists To Provide Social Media Histories Could Mean Millions Of People Opting Not To Visit

Share

Blackrock: Kerry White Will Become Head Of Citi Investment Management At Citi Wealth

Share

Blackrock: Rob Jasminski, Head Of Citi Investment Management, Has Joined With Team

Share

Blackrock: Effective Dec 15, Citi Investment Management Employees Will Join Blackrock

Share

Blackrock: Formally Launch Citi Portfolio Solutions Powered By Blackrock

Share

According To Data From The Federal Reserve Bank Of New York, The Secured Overnight Funding Rate (Sofr) Was 3.67% On The Previous Trading Day (December 15), Compared To 3.66% The Day Before

Share

Peru Energy And Mines Ministry: Copper Production Up 4.8% Year-On-Year In October To 248192 Metric Tons

Share

Security Source: Ukrainian Drones Hits Russian Oil Infrastructure In Caspian Sea For Third Time

Share

Spot Palladium Extends Gains, Last Up 5% To $1562.7/Oz

Share

Mexico's Economy Ministry Announces Start Of Anti-Dumping Investigation And Anti-Subsidy Investigations Into USA Pork Imports

Share

Canada Nov CPI Common +2.8%, CPI Median +2.8%, CPI Trim +2.8% On Year

Share

NY Fed's Empire State Prices Paid Index +37.6 In December Versus+49.0 In November

Share

Canada Nov Consumer Prices +0.1% On Month, +2.2% On Year

Share

Canada Nov CPI Core -0.1% On Month, +2.9% On Year

Share

Canada Nov Core CPI, Seasonally Adjusted +0.2% On Month, Oct +0.3% (Unrevised)

TIME
ACT
FCST
PREV
Japan Tankan Small Manufacturing Outlook Index (Q4)

A:--

F: --

P: --

Japan Tankan Large Non-Manufacturing Outlook Index (Q4)

A:--

F: --

P: --

Japan Tankan Large Manufacturing Outlook Index (Q4)

A:--

F: --

P: --

Japan Tankan Small Manufacturing Diffusion Index (Q4)

A:--

F: --

P: --

Japan Tankan Large Manufacturing Diffusion Index (Q4)

A:--

F: --

P: --

Japan Tankan Large-Enterprise Capital Expenditure YoY (Q4)

A:--

F: --

P: --

U.K. Rightmove House Price Index YoY (Dec)

A:--

F: --

P: --

China, Mainland Industrial Output YoY (YTD) (Nov)

A:--

F: --

P: --

China, Mainland Urban Area Unemployment Rate (Nov)

A:--

F: --

P: --

Saudi Arabia CPI YoY (Nov)

A:--

F: --

P: --

Euro Zone Industrial Output YoY (Oct)

A:--

F: --

P: --

Euro Zone Industrial Output MoM (Oct)

A:--

F: --

P: --

Canada Existing Home Sales MoM (Nov)

A:--

F: --

P: --

Canada National Economic Confidence Index

A:--

F: --

P: --

Canada New Housing Starts (Nov)

A:--

F: --

P: --
U.S. NY Fed Manufacturing Employment Index (Dec)

A:--

F: --

P: --

U.S. NY Fed Manufacturing Index (Dec)

A:--

F: --

P: --

Canada Core CPI YoY (Nov)

A:--

F: --

P: --

Canada Manufacturing Unfilled Orders MoM (Oct)

A:--

F: --

P: --

U.S. NY Fed Manufacturing Prices Received Index (Dec)

A:--

F: --

P: --

U.S. NY Fed Manufacturing New Orders Index (Dec)

A:--

F: --

P: --

Canada Manufacturing New Orders MoM (Oct)

A:--

F: --

P: --

Canada Core CPI MoM (Nov)

A:--

F: --

P: --

Canada Trimmed CPI YoY (SA) (Nov)

A:--

F: --

P: --

Canada Manufacturing Inventory MoM (Oct)

A:--

F: --

P: --

Canada CPI YoY (Nov)

A:--

F: --

P: --

Canada CPI MoM (Nov)

A:--

F: --

P: --

Canada CPI YoY (SA) (Nov)

A:--

F: --

P: --

Canada Core CPI MoM (SA) (Nov)

A:--

F: --

P: --

Canada CPI MoM (SA) (Nov)

A:--

F: --

P: --

Federal Reserve Board Governor Milan delivered a speech
U.S. NAHB Housing Market Index (Dec)

--

F: --

P: --

Australia Composite PMI Prelim (Dec)

--

F: --

P: --

Australia Services PMI Prelim (Dec)

--

F: --

P: --

Australia Manufacturing PMI Prelim (Dec)

--

F: --

P: --

Japan Manufacturing PMI Prelim (SA) (Dec)

--

F: --

P: --

U.K. 3-Month ILO Employment Change (Oct)

--

F: --

P: --

U.K. Unemployment Claimant Count (Nov)

--

F: --

P: --

U.K. Unemployment Rate (Nov)

--

F: --

P: --

U.K. 3-Month ILO Unemployment Rate (Oct)

--

F: --

P: --

U.K. Average Weekly Earnings (3-Month Average, Including Bonuses) YoY (Oct)

--

F: --

P: --

U.K. Average Weekly Earnings (3-Month Average, Excluding Bonuses) YoY (Oct)

--

F: --

P: --

France Services PMI Prelim (Dec)

--

F: --

P: --

France Composite PMI Prelim (SA) (Dec)

--

F: --

P: --

France Manufacturing PMI Prelim (Dec)

--

F: --

P: --

Germany Services PMI Prelim (SA) (Dec)

--

F: --

P: --

Germany Manufacturing PMI Prelim (SA) (Dec)

--

F: --

P: --

Germany Composite PMI Prelim (SA) (Dec)

--

F: --

P: --

Euro Zone Composite PMI Prelim (SA) (Dec)

--

F: --

P: --

Euro Zone Services PMI Prelim (SA) (Dec)

--

F: --

P: --

Euro Zone Manufacturing PMI Prelim (SA) (Dec)

--

F: --

P: --

U.K. Services PMI Prelim (Dec)

--

F: --

P: --

U.K. Manufacturing PMI Prelim (Dec)

--

F: --

P: --

U.K. Composite PMI Prelim (Dec)

--

F: --

P: --

Euro Zone ZEW Economic Sentiment Index (Dec)

--

F: --

P: --

Germany ZEW Current Conditions Index (Dec)

--

F: --

P: --

Germany ZEW Economic Sentiment Index (Dec)

--

F: --

P: --

Euro Zone Trade Balance (Not SA) (Oct)

--

F: --

P: --

Euro Zone ZEW Current Conditions Index (Dec)

--

F: --

P: --

Euro Zone Trade Balance (SA) (Oct)

--

F: --

P: --

U.S. Retail Sales MoM (Excl. Automobile) (SA) (Oct)

--

F: --

P: --

Q&A with Experts
    • All
    • Chatrooms
    • Groups
    • Friends
    Connecting
    .
    .
    .
    Type here...
    Add Symbol or Code

      No matching data

      All
      Trump Updates
      Recommend
      Stocks
      Cryptocurrencies
      Central Banks
      Featured News
      • All
      • Russia-Ukraine Conflict
      • Middle East Flashpoint
      • All
      • Russia-Ukraine Conflict
      • Middle East Flashpoint
      Search
      Products

      Charts Free Forever

      Chats Q&A with Experts
      Screeners Economic Calendar Data Tools
      Membership Features
      Data Warehouse Market Trends Institutional Data Policy Rates Macro

      Market Trends

      Market Sentiment Order Book Forex Correlations

      Top Indicators

      Charts Free Forever
      Markets

      News

      News Analysis 24/7 Columns Education
      From Institutions From Analysts
      Topics Columnists

      Latest Views

      Latest Views

      Trending Topics

      Top Columnists

      Latest Update

      Signals

      Copy Rankings Latest Signals Become a signal provider AI Rating
      Contests
      Brokers

      Overview Brokers Assessment Rankings Regulators News Claims
      Broker listing Forex Brokers Comparison Tool Live Spread Comparison Scam
      Q&A Complaint Scam Alert Videos Tips to Detect Scam
      More

      Business
      Events
      Careers About Us Advertising Help Center

      White Label

      Data API

      Web Plug-ins

      Affiliate Program

      Awards Institution Evaluation IB Seminar Salon Event Exhibition
      Vietnam Thailand Singapore Dubai
      Fans Party Investment Sharing Session
      FastBull Summit BrokersView Expo
      Recent Searches
        Top Searches
          Markets
          News
          Analysis
          User
          24/7
          Economic Calendar
          Education
          Data
          • Names
          • Latest
          • Prev

          View All

          No data

          Scan to Download

          Faster Charts, Chat Faster!

          Download App
          English
          • English
          • Español
          • العربية
          • Bahasa Indonesia
          • Bahasa Melayu
          • Tiếng Việt
          • ภาษาไทย
          • Français
          • Italiano
          • Türkçe
          • Русский язык
          • 简中
          • 繁中
          Open Account
          Search
          Products
          Charts Free Forever
          Markets
          News
          Signals

          Copy Rankings Latest Signals Become a signal provider AI Rating
          Contests
          Brokers

          Overview Brokers Assessment Rankings Regulators News Claims
          Broker listing Forex Brokers Comparison Tool Live Spread Comparison Scam
          Q&A Complaint Scam Alert Videos Tips to Detect Scam
          More

          Business
          Events
          Careers About Us Advertising Help Center

          White Label

          Data API

          Web Plug-ins

          Affiliate Program

          Awards Institution Evaluation IB Seminar Salon Event Exhibition
          Vietnam Thailand Singapore Dubai
          Fans Party Investment Sharing Session
          FastBull Summit BrokersView Expo

          Japan Eyes Oil Diversification but Canadian Heavy Crude Presents Refining Hurdles

          Gerik

          Economic

          Summary:

          Japan’s top oil industry leader supports diversification away from Middle Eastern crude but cautions that importing Canadian heavy oil poses technical and economic challenges...

          Japan’s Oil Dependence on the Middle East Spurs Diversification Debate

          As Japan continues to import 95% of its crude oil from the Middle East, industry leaders are calling for greater diversification in supply sources. Shunichi Kito, president of the Petroleum Association of Japan (PAJ) and head of Idemitsu Kosan Japan’s second-largest refiner underscored this strategic need during a news conference on Thursday.
          However, while acknowledging the importance of reducing overreliance on Middle Eastern suppliers, Kito expressed caution about shifting to Canadian sources, citing the technical limitations of Japanese refineries when dealing with Canada’s heavy crude oil.

          Canada Explores Refining Partnerships in Asia to Expand Market Access

          The Government of Alberta, Canada’s largest oil-producing province, is reportedly in preliminary discussions with Japanese refiners to form a joint venture that would involve financial support for new infrastructure. According to sources familiar with the matter, Alberta is considering investment in building a coker unit in Japan, which is essential for processing bitumen-rich oil from Canada’s oil sands. This move is driven by Canada’s desire to reduce its near-total dependence on the United States for crude oil exports and open new long-term markets in Asia.
          However, no formal proposals have yet been submitted to Japanese refiners. “There is no specific request being made to us at this time,” Kito clarified when asked about Alberta’s intentions. Nonetheless, the notion of such a joint venture represents a strategic shift in North American oil diplomacy and could realign Japan’s import strategy if technical barriers are overcome.

          Heavy Oil Characteristics Complicate Refining Viability in Japan

          Kito emphasized that the physical properties of Canadian heavy oil make it difficult to refine within Japan’s existing infrastructure. Unlike the light and sweet crude oil varieties sourced from the Middle East, Canadian bitumen requires advanced conversion equipment such as coker units to handle its dense, sulfur-rich composition. Japanese refineries are largely optimized for lighter grades, and adapting them for heavy oil would require substantial capital investment, operational adjustments, and ongoing cost increases in processing.
          These technical complications create a causal relationship between oil quality and Japan’s import preferences. Without compatible refining technology in place, Canadian crude remains economically unattractive unless subsidized or accompanied by long-term offtake guarantees.

          Demand Decline Undermines Incentive for New Refining Infrastructure

          Japan's structural decline in domestic oil demand estimated at roughly 2% annually further weakens the case for investing in new refining infrastructure tailored to Canadian oil. Kito noted that with consumption on a downward trajectory, it is difficult to justify long-term capital expenditures on equipment such as cokers.
          While the decision to invest ultimately rests with individual companies, the macroeconomic environment discourages such moves. This signals that unless external financing or strong government policy incentives are introduced, refiner-led diversification away from Middle Eastern supply may remain limited in scope.
          While Japan recognizes the strategic importance of diversifying its oil import sources, including potential collaboration with Canada, practical and economic barriers continue to limit immediate progress. The mismatch between Japan’s current refining capabilities and the physical characteristics of Canadian heavy crude, combined with structural declines in demand, make such ventures challenging. Unless Alberta offers compelling investment terms or Japan embarks on a broader restructuring of its refining sector, diversification efforts may remain focused on lighter crude sources in other regions or alternative energy strategies altogether.

          Source: Reuters

          To stay updated on all economic events of today, please check out our Economic calendar
          Risk Warnings and Disclaimers
          You understand and acknowledge that there is a high degree of risk involved in trading. Following any strategies or investment methods may lead to potential losses. The content on the site is provided by our contributors and analysts for information purposes only. You are solely responsible for determining whether any trading assets, securities, strategy, or any other product is suitable for investing based on your own investment objectives and financial situation.
          Add to Favorites
          Share

          Treasury Yields Slip as Markets Digest Fed’s Gradual Rate Cut Strategy

          Gerik

          Economic

          Yields Decline After Measured Fed Rate Cut

          Yields across U.S. Treasury maturities edged lower on Thursday morning, reflecting investor reassessment of the Federal Reserve’s latest policy move and its implications for future monetary easing.
          The 10-year Treasury yield declined by over 3 basis points to 4.045%, while the 2-year yield dropped by more than 2 basis points to 3.524%. The 30-year bond yield also slipped by 3 basis points to 4.643%. These movements, though modest, highlight a cautious shift in sentiment following the Fed’s announcement of its first interest rate cut in 2025.

          Fed’s Cut Reflects Risk Management, Not Full Pivot

          In an 11-to-1 decision, the Federal Open Market Committee (FOMC) voted to lower its benchmark federal funds rate to a range of 4.00% to 4.25%. Fed Chair Jerome Powell emphasized during his post-decision press conference that the move was guided by risk management considerations, particularly the dual pressures of elevated inflation and signs of labor market weakening. This framing suggests a careful and responsive policy stance rather than a sweeping reversal. The Fed’s current projection includes two additional cuts in 2025 and just one more in 2026.
          Gina Bolvin, president of Bolvin Wealth Management Group, interpreted the decision as a “measured step” rather than a policy pivot, stating that “modest rate relief, not fireworks,” should be the investor takeaway. Her remarks underscore the Fed’s attempt to balance monetary easing with inflation containment a theme increasingly central to current bond market pricing.

          Market Sentiment Turns to Data Dependency

          The bond market’s subdued reaction indicates that investors are not anticipating an aggressive easing cycle. Instead, sentiment has aligned with the Fed’s message of data-dependent decision-making. Yields, which move inversely to bond prices, reflect growing expectations that any future rate adjustments will hinge on upcoming labor and inflation indicators. The Fed’s caution is reinforced by its projection that inflation will remain above target at 3.1% this year, and unemployment will tick up slightly to 4.5%.
          Short-term yields, such as the 1-month and 3-month Treasuries, showed little movement, reinforcing the idea that markets are more concerned with the medium-term path of policy than with immediate changes. The 1-month yield held at 4.087%, while the 3-month yield rose slightly to 3.991%, signaling limited short-term rate volatility.

          Awaiting Labor Market Signals for Confirmation

          With the Fed setting a tentative path, attention now turns to Thursday’s release of initial jobless claims a key near-term indicator that could influence bond market sentiment and reinforce or challenge the Fed’s strategy. If jobless claims show accelerating weakness, market expectations for additional easing could strengthen. Conversely, resilience in labor data may bolster the case for a slower and more measured rate path.
          The post-rate-cut dip in Treasury yields reflects investor acceptance of the Fed’s cautious, non-committal easing path. Rather than responding with significant shifts in pricing, markets are choosing to wait for additional confirmation from economic data. As Powell noted, the Fed is navigating “two-sided risks,” and the bond market’s current behavior suggests that investors are prepared to adjust in either direction but only once the data provides a clearer signal. The coming weeks, particularly job market and inflation updates, will likely determine whether yields hold steady or adjust to a more dovish or hawkish reality.

          Source: CNBC

          To stay updated on all economic events of today, please check out our Economic calendar
          Risk Warnings and Disclaimers
          You understand and acknowledge that there is a high degree of risk involved in trading. Following any strategies or investment methods may lead to potential losses. The content on the site is provided by our contributors and analysts for information purposes only. You are solely responsible for determining whether any trading assets, securities, strategy, or any other product is suitable for investing based on your own investment objectives and financial situation.
          Add to Favorites
          Share

          GBP Holds Near Highs As Market Awaits BoE Decision

          Blue River

          Technical Analysis

          The GBP/USD pair stabilised around 1.3626 USD on Thursday, following a highly volatile session on Wednesday. The pair remains close to its highest level in over ten weeks, as markets await the Bank of England’s policy decision later today.

          The BoE is widely expected to maintain rates at 5.25% (note: corrected from 4% based on current BoE rate) and may signal a reduction in its £100 billion annual bond-purchase program.

          Recent data showed UK inflation held steady at 3.8% in August, matching both forecasts and July’s 18-month high. Labour market figures were broadly in line with expectations: unemployment remained at 4.7%, wage growth (ex-bonuses) came in at 4.8% (4.7% including bonuses), and payrolls declined by 8,000.

          Market expectations for a BoE rate cut remain subdued, with only a one-in-three chance priced in for a reduction by December.

          Meanwhile, the US Federal Reserve delivered a widely anticipated 25-basis-point cut yesterday, with traders now expecting at least two additional cuts by the end of 2025.
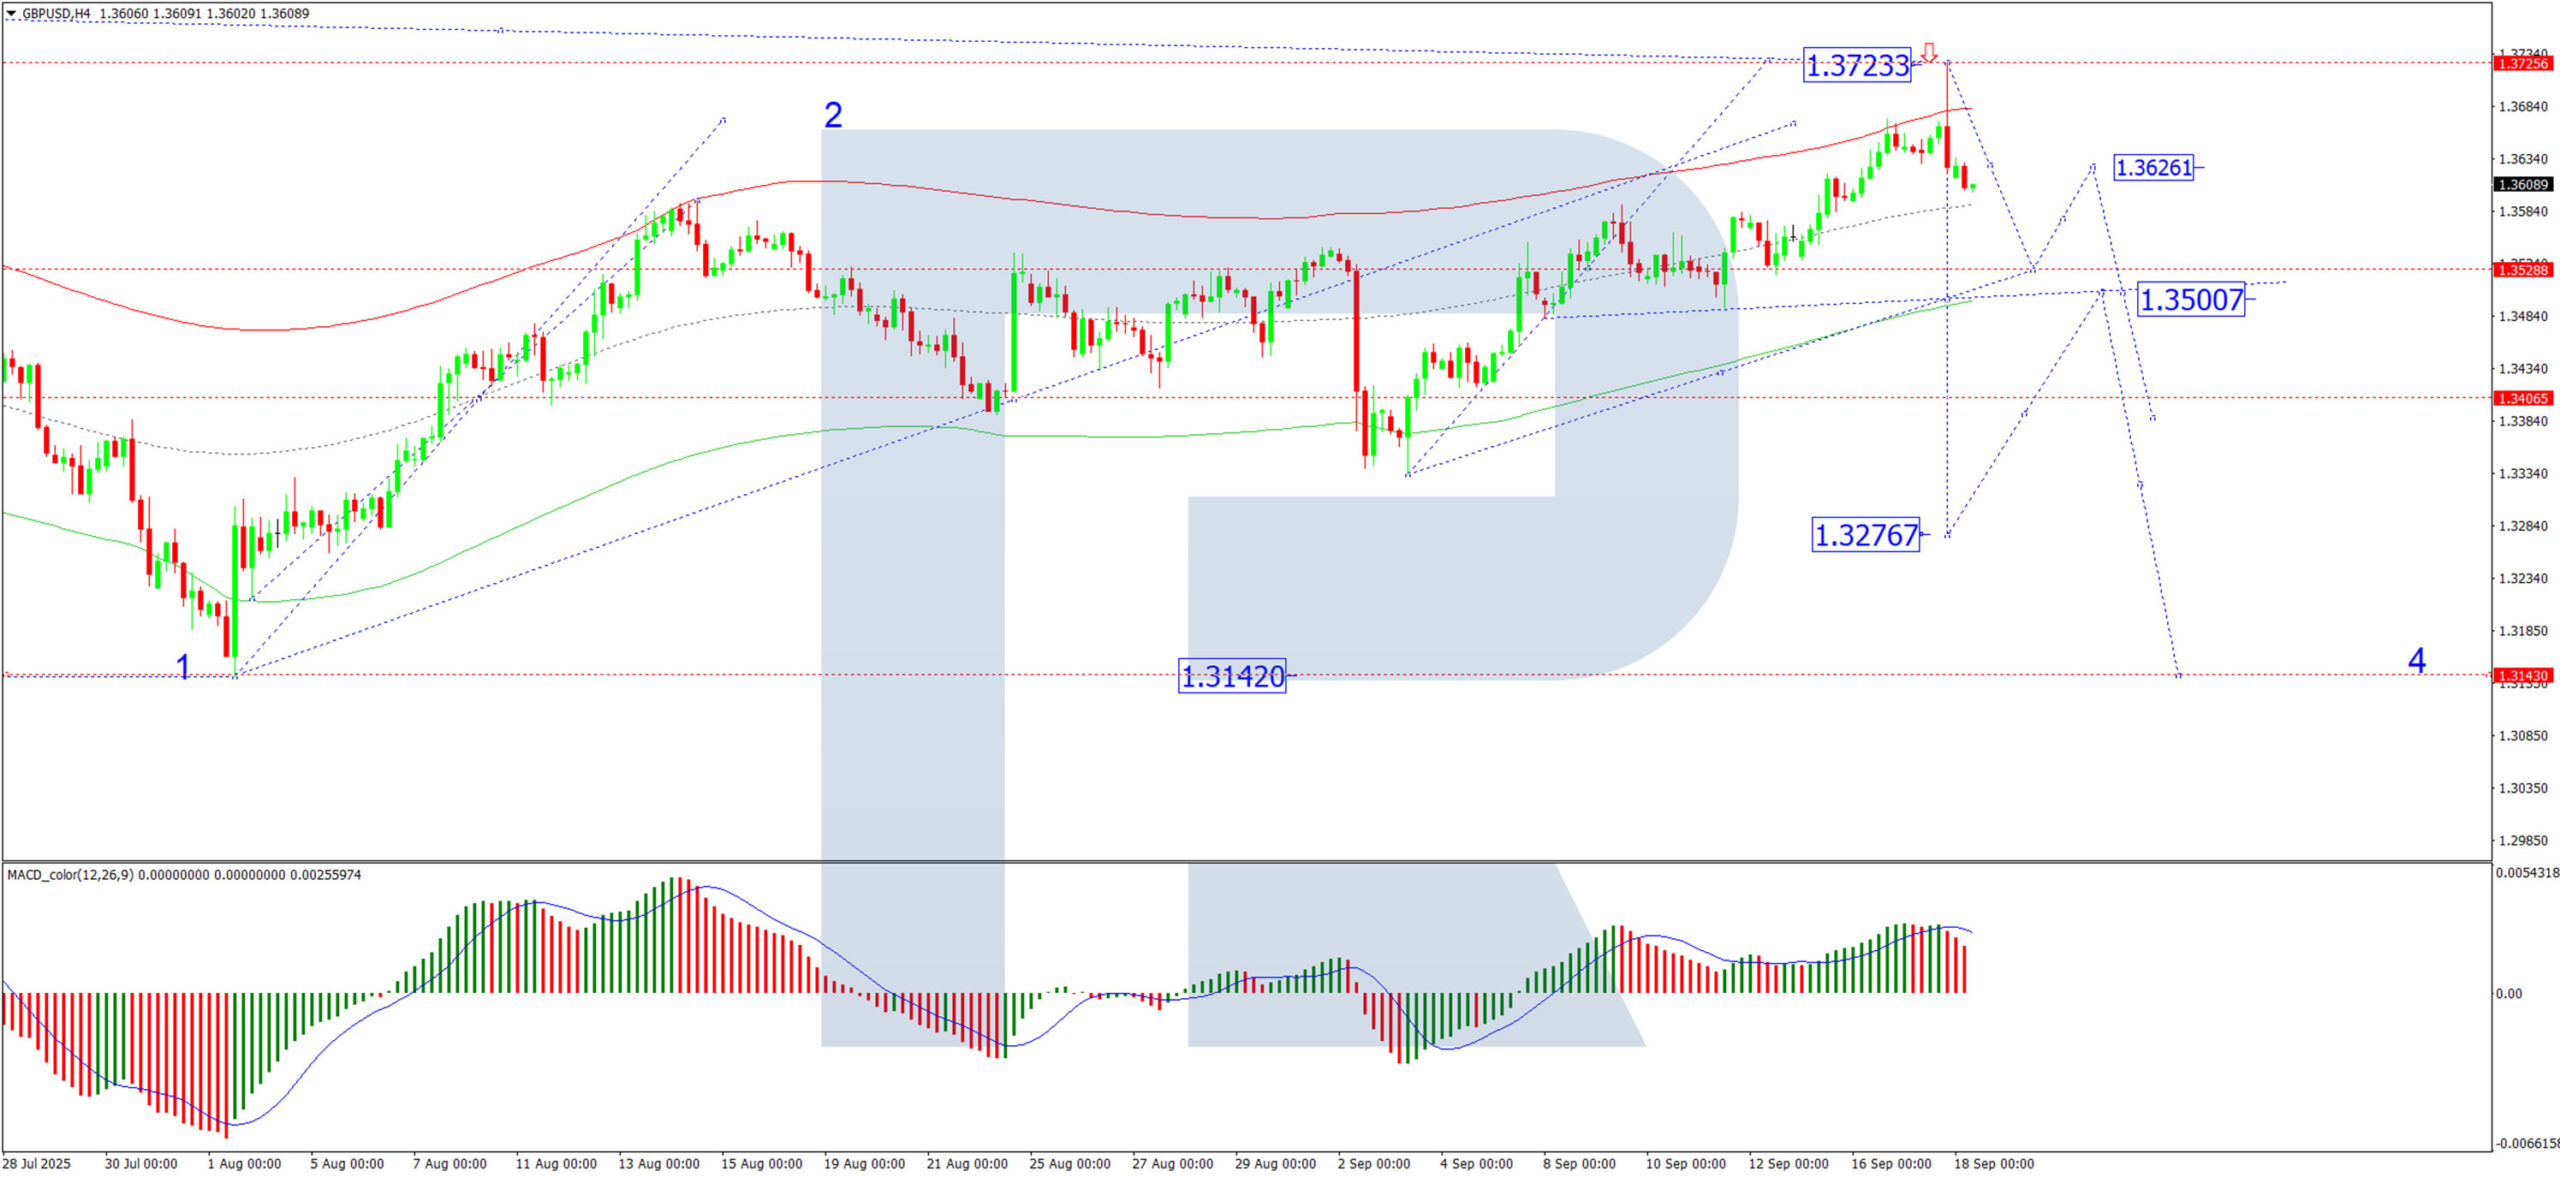
          Technical Analysis: GBP/USD

          H4 Chart:

          On the H4 chart, GBP/USD completed an upward move to 1.3723 USD, followed by a downward impulse to 1.3620 USD. The pair is now likely to form a consolidation range around this level. A break below 1.3620 USD could initiate a decline towards 1.3528 USD. A corrective rebound towards 1.3620 USD may then follow. Renewed selling pressure could subsequently drive the pair towards 1.3500 USD, with further downside potential to 1.3277 USD. The MACD indicator supports this outlook, with its signal line positioned above zero but turning decisively downward.
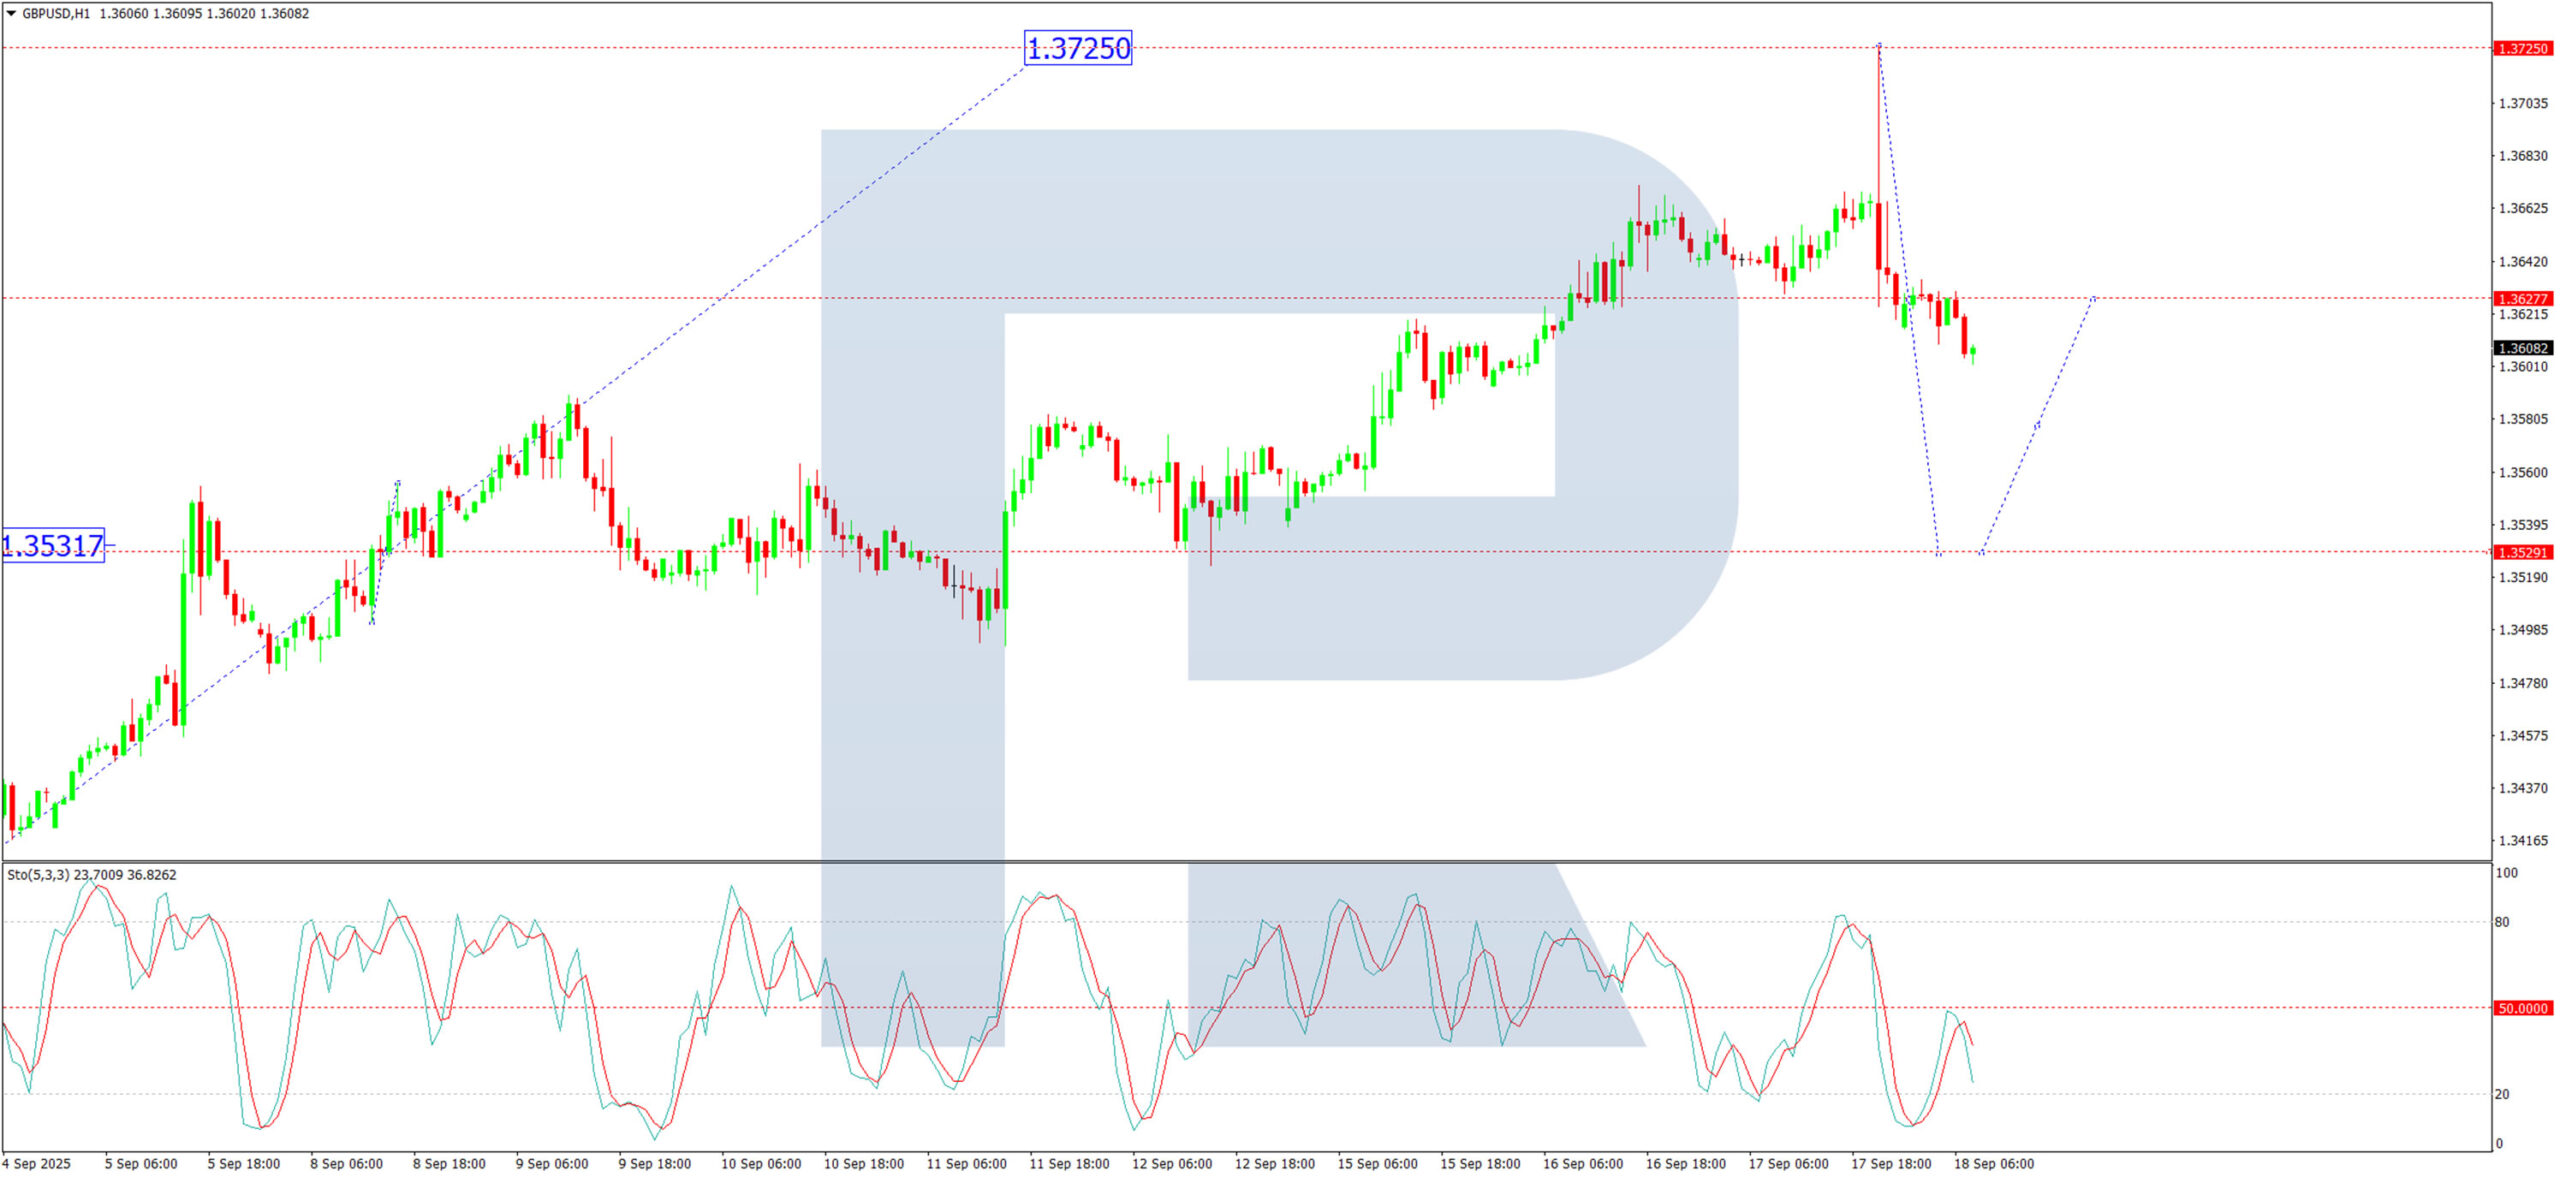
          H1 Chart:

          On the H1 chart, the pair has completed a downward impulse to 1.3620 USD. A consolidation phase is expected around this level. A break lower would likely trigger the first wave of a new downtrend towards 1.3530 USD. The Stochastic oscillator aligns with this near-term bearish view, as its signal line lies below 50 and is trending downward towards 20.

          Conclusion

          The pound is trading near multi-week highs as markets await guidance from the BoE. While UK inflation remains elevated, softening labour data and a dovish Fed have limited the GBP’s upside. Technically, the pair appears vulnerable to a near-term correction, particularly if the BoE maintains a cautious tone. Today’s decision and accompanying communications will be critical in determining whether cable extends its rally or enters a deeper corrective phase.

          Source: ACTIONFOREX

          Risk Warnings and Disclaimers
          You understand and acknowledge that there is a high degree of risk involved in trading. Following any strategies or investment methods may lead to potential losses. The content on the site is provided by our contributors and analysts for information purposes only. You are solely responsible for determining whether any trading assets, securities, strategy, or any other product is suitable for investing based on your own investment objectives and financial situation.
          Add to Favorites
          Share

          Swiss Exports to U.S. Plunge After Tariff Shock, but Europe and Mercosur Offer Lifeline

          Gerik

          Economic

          Tariff Shock Delivers Immediate Blow to Swiss-U.S. Trade

          The United States' imposition of a 39% tariff on Swiss goods, one of the highest such levies among developed economies, led to a sharp contraction in bilateral trade within its first month. Adjusted for seasonal factors and excluding gold, Swiss exports to the U.S. fell by 22% in August compared to July, according to newly released Swiss customs data. This rapid decline confirms a strong causal relationship between the tariff’s implementation and the sudden drop in trade volumes.
          Luxury exports, particularly watches one of Switzerland's hallmark industries were among the most affected. Watch exports alone declined by 8.6% month-over-month. Even more dramatic was the collapse in gold shipments, which plunged 99% to just 0.3 tons. These figures suggest a direct and immediate behavioral response from exporters, who likely reallocated shipments away from the U.S. in anticipation of reduced demand due to higher prices.

          U.S. Trade Deficit With Switzerland Narrows Sharply

          The disruption in Swiss outbound trade led to a notable narrowing of the U.S. trade deficit with Switzerland, falling from 2.93 billion francs in July to 2.06 billion francs in August. This was the second-lowest reading since 2020 and reflects a short-term outcome aligned with the Trump administration’s stated objective for imposing the tariff: to reduce the perceived trade imbalance.
          While effective in this specific metric, the long-term implications for bilateral economic ties remain uncertain, especially if retaliatory or compensatory adjustments are introduced by Switzerland or other trading partners.

          Swiss Economy Shows Flexibility Through Diversification

          Despite the steep decline in U.S.-bound exports, Switzerland’s overall trade remained resilient. Total exports fell by only 1% month-over-month, as increased shipments to France, Austria, Poland, Canada, and Mexico helped offset the American shortfall. This outcome suggests a partial substitution effect, where export flows are redirected toward alternative markets when bilateral costs become prohibitive. This correlation between lost U.S. demand and gains in other markets demonstrates Switzerland’s capacity for short-term export reallocation and highlights the importance of trade diversification.
          In a longer-term move to mitigate dependence on U.S. demand, Switzerland signed a new free trade agreement with the South American Mercosur bloc during the same week. While this deal will take time to generate measurable trade flow, it reflects a strategic pivot toward emerging economies and underlines the government’s intent to shield its economy from abrupt trade policy shifts by dominant partners.

          Trade Negotiations Continue Amid Domestic Sensitivities

          Talks between Switzerland and the U.S. are still underway, with Commerce Secretary Howard Lutnick suggesting that a revised agreement may be within reach. However, the substance of these negotiations remains politically sensitive. U.S. negotiators are pushing for broader agricultural access, particularly in beef and poultry, but Swiss agricultural groups have firmly resisted such concessions. The Swiss government, bound by domestic political commitments to food self-sufficiency and rural protectionism, faces a narrow window for negotiation.
          This tension illustrates a classic policy trade-off: lowering tariffs to protect export-heavy industries like watchmaking and pharmaceuticals could require sacrificing domestic protections in agriculture an industry with strong symbolic and political weight in Swiss society. The government must now balance these internal and external pressures to preserve both its industrial competitiveness and domestic political stability.

          Pharmaceuticals Hold Up, but Long-Term Growth Outlook Weakens

          Not all sectors were equally affected. Pharmaceutical exports, which currently remain exempt from the new tariffs, experienced only a modest 1.3% decline. However, the overall slowdown in trade with the U.S. has led Swiss authorities to revise their growth projections downward for 2025. This suggests that even limited sectoral impacts, when concentrated in key industries or partner markets, can influence broader macroeconomic expectations.
          The link between trade volatility and national growth forecasts highlights the Swiss economy’s sensitivity to geopolitical and trade policy shifts. Although temporarily buffered by strong European demand, sustained or escalating trade tensions with the U.S. could undermine confidence in Switzerland’s export-led model over time.

          Tariff Fallout Accelerates Swiss Diversification Push

          The dramatic contraction in Swiss exports to the U.S. following the 39% tariff underscores the immediate disruptive power of trade protectionism, particularly when directed at high-value sectors like luxury goods and gold. While Switzerland has so far managed to reorient its export flows, the longer-term cost of disrupted U.S. trade is reflected in revised growth forecasts and urgent trade diplomacy efforts.
          With negotiations ongoing and geopolitical friction unresolved, Switzerland's economic strategy now appears increasingly geared toward diversification, not just in export markets but also in strategic partnerships highlighted by its recent Mercosur agreement. How quickly these moves can offset lost trade with the U.S. remains to be seen, but for now, Switzerland is navigating the fallout with measured resilience and quiet urgency.

          Source: Bloomberg

          To stay updated on all economic events of today, please check out our Economic calendar
          Risk Warnings and Disclaimers
          You understand and acknowledge that there is a high degree of risk involved in trading. Following any strategies or investment methods may lead to potential losses. The content on the site is provided by our contributors and analysts for information purposes only. You are solely responsible for determining whether any trading assets, securities, strategy, or any other product is suitable for investing based on your own investment objectives and financial situation.
          Add to Favorites
          Share

          Fed Confirms Dovish Turn with Two More Rate Cuts Projected in 2025 and Upgraded GDP Outlook

          Gerik

          Economic

          Fed Initiates 2025 Easing Cycle Amid Two-Sided Economic Risks

          The U.S. Federal Reserve began its 2025 easing cycle with a quarter-point rate cut, bringing the federal funds target range to 4.00%–4.25%. This marks the first rate reduction since late 2024 and reflects increasing concern over the labor market's gradual deterioration.
          Alongside this move, the latest Summary of Economic Projections (SEP) revealed that Fed officials now expect two more cuts before year-end, targeting a year-end range of 3.50%–3.75%. This shift comes amid a notable change in tone, with policymakers increasingly prioritizing downside risks to employment despite inflation remaining above target.

          Labor Market Weakness Shifts Policy Focus

          Chair Jerome Powell emphasized the complex macroeconomic environment during his post-meeting press conference, describing the current setup as “an unusual situation.” He explained that the conventional inverse relationship between labor market strength and inflation has broken down.
          Normally, strong labor conditions warn of inflation risks, but Powell pointed out that current data present a rare convergence of slowing employment and elevated prices. With job creation weakening only 22,000 positions added in August and previous months revised downward the Fed has signaled that labor market fragility may now outweigh inflation concerns in shaping near-term policy.

          Inflation Steady but Still Above Target

          Despite the policy pivot, inflation projections remain elevated. Core inflation is forecast to remain at 3.1% for 2025, unchanged from June estimates. It is expected to cool to 2.6% by 2026 and 2.1% in 2027, slowly approaching the 2% target over time.
          This persistence indicates that while disinflation is anticipated, it is expected to unfold gradually, requiring careful calibration of rate reductions. The Fed’s willingness to proceed with cuts despite unrelenting inflation highlights a shift in priority toward sustaining economic growth and employment, rather than accelerating the path to price stability.

          GDP Outlook Raised as Fed Eyes Economic Resilience

          In a sign of confidence in underlying economic resilience, the Fed raised its GDP forecast to 1.6% for 2025, up from 1.4% projected in June. Growth is expected to continue modestly, reaching 1.8% in 2026 and 1.9% in 2027. This upward revision suggests that policymakers believe the economy can endure moderate rate cuts without overheating.
          It also supports the argument that rate reductions could bolster demand without severely compromising inflation control. The relationship here reflects a calculated bet: that easing policy will stimulate growth without igniting a new inflationary spiral.

          Widening Dispersion in Policy Views Reflects Elevated Uncertainty

          The new dot plot confirmed deep divisions among policymakers. Eighteen Federal Open Market Committee (FOMC) members forecast at least one more rate cut in 2025, while a lone member anticipates no change. One projection even calls for six total cuts. This range mirrors the unpredictable macroeconomic environment, with Powell noting that such diversity of opinion is “natural” given current uncertainties. Nonetheless, the median projection two more cuts in 2025 and one in 2026 illustrates a consensus trend toward a gently easing policy stance, despite inflation not yet reaching target.
          Unemployment Projected to Rise as Job Market Slackens
          Unemployment is projected to rise slightly to 4.5% in 2025, holding steady with the June forecast. It is then expected to decline to 4.4% in 2026 and 4.3% in 2027. The expected rise reflects continued labor market softening, which played a key role in the decision to begin rate cuts.
          While modest, the projected uptick in joblessness supports the Fed’s rationale that intervention is needed to prevent broader economic weakening, establishing a causal relationship between projected employment deterioration and easing monetary policy.

          Markets Embrace Dovish Pivot as Wall Street Sentiment Improves

          Financial markets responded positively to the Fed’s updated projections, with major investment firms revising S&P 500 targets higher. Analysts from Wells Fargo, Barclays, and Deutsche Bank cited resilient corporate earnings, growing investment in artificial intelligence, and expectations of lower borrowing costs as key drivers for continued equity market momentum.
          The optimism reflects a belief that lower rates will help cushion macroeconomic softness without reigniting inflation a belief that aligns with the Fed’s balancing act between growth and price stability.

          Stagflation Concerns Linger as Inflation and Unemployment Remain Elevated

          Despite the dovish shift, stagflation risks remain on the horizon. The combination of sticky inflation and rising unemployment presents an uneasy backdrop for further monetary easing. Powell acknowledged the challenge of managing “two-sided risks” and admitted that the current environment offers “no risk-free path.” This underscores the delicate tradeoff the Fed must navigate supporting employment without compromising its inflation mandate. The parallel movement of inflation and joblessness illustrates the interdependence of Fed objectives, complicating efforts to pursue one without affecting the other.
          The Federal Reserve’s decision to cut rates and project further easing in 2025 marks a strategic shift toward prioritizing labor market support while cautiously navigating persistent inflation. The raised GDP forecast reflects optimism in the economy’s capacity to withstand rate reductions, but the presence of divergent views among Fed officials and lingering stagflation concerns make it clear that policy uncertainty remains elevated. The coming months will test the Fed’s ability to manage these dual pressures without losing credibility on inflation or falling behind in sustaining employment. Investors, households, and policymakers alike will be watching closely as the next chapters of this easing cycle unfold.

          Source: Reuters

          To stay updated on all economic events of today, please check out our Economic calendar
          Risk Warnings and Disclaimers
          You understand and acknowledge that there is a high degree of risk involved in trading. Following any strategies or investment methods may lead to potential losses. The content on the site is provided by our contributors and analysts for information purposes only. You are solely responsible for determining whether any trading assets, securities, strategy, or any other product is suitable for investing based on your own investment objectives and financial situation.
          Add to Favorites
          Share

          Analytical Brent And WTI Oil Price Forecast In 2025 And Beyond

          FXOpen

          Economic

          Commodity

          Forex

          Brent and WTI are two of the world’s leading oil benchmarks, influencing energy costs and economic trends. From geopolitical volatility to shifting demand and the energy transition, their future prices will be shaped by powerful global forces. This article examines key drivers and analytical oil price predictions for 2025–2030 and beyond, providing context for traders.

          Historical Context and Recent Trends

          Brent and WTI are the world’s most closely watched oil benchmarks, shaping energy costs and market sentiment. Their prices reflect a mix of supply-demand balances, geopolitical tensions, and market structure shifts. Understanding their history provides essential context for analysing where the market could head next.

          2010–2014: High Prices Before the Crash

          From 2010 through mid-2014, Brent crude consistently traded near or above $100 per barrel, supported by steady global demand, limited spare capacity, and concerns over Middle East supply disruptions. WTI generally traded at a discount of $5–$15 to Brent due to US infrastructure bottlenecks that limited exports. The shale revolution was already underway, but OPEC maintained output, keeping the market tight.

          2014–2016: Shale Boom and OPEC’s Market-Share Strategy

          By mid-2014, rapid U.S. shale growth – adding millions of barrels per day – combined with slower demand growth in China, created oversupply. In November 2014, OPEC opted not to cut production, aiming to defend market share against higher-cost producers. Prices collapsed, with both Brent and WTI falling below $30 in early 2016. The sharp drop forced capital expenditure cuts across the industry and began to slow shale output.

          2016–2019: Recovery and Range-Bound Trading

          From 2016, OPEC and non-OPEC allies (OPEC+) implemented coordinated cuts, helping prices recover. Brent and WTI rose into the $50–$70 range, occasionally breaking higher on geopolitical tensions, such as US sanctions on Iran in 2018. WTI’s discount to Brent narrowed after the US lifted its crude export ban in late 2015, allowing domestic crude to reach international buyers and easing the Cushing storage glut.

          2020: COVID-19 Demand Collapse and Unprecedented Volatility

          The COVID-19 pandemic triggered a sudden, historic drop in oil consumption—down around 20% in early 2020. Storage filled rapidly. In April 2020, the WTI May futures contract settled at –$37.63 per barrel as holders of physical delivery obligations paid to offload barrels due to lack of storage. Brent fell to ~$19 but remained positive. OPEC+ responded with record cuts of 9.7 million bpd in May and June, stabilising prices in the second half of the year.

          2021–2022: Rebound and War-Driven Spike

          As economies reopened, demand rebounded quickly. Brent and WTI returned above $80 by late 2021. In February 2022, the start of the Russia-Ukraine conflict triggered a supply shock. Both briefly exceeded $120, while sanctions forced Russian crude to flow at discounts to Asia.

          2023–Early 2025: Moderation Amid Supply Management

          In 2023, slowing global growth and rising non-OPEC supply pressured prices, driving Brent to a yearly low around $70 and WTI to below $64. OPEC+ countered with voluntary cuts totalling around 5 million bpd, led by Saudi Arabia’s extra 1 million bpd reduction. Brent continued to range in 2024, topping out at $91 in April before sinking below $69 by September. WTI rose to $87 and fell to $64 over the same period.

          As of 2025, oil remains near its lowest since 2021. Brent/WTI dipped to $58/$55 in April as Donald Trump’s tariff shock hit the market, both recovering to around $77 by June, driven by Israel-Iran tensions.

          Key Drivers of Oil Prices (2025–2030)

          Oil markets in the second half of the 2020s are expected to be shaped by the interaction of demand growth, supply management, policy shifts, and technological developments. Sources emphasise that these forces are interconnected—changes in one often trigger adjustments in others. While short-term price movements may be driven by immediate events, these structural drivers might set the broader direction of Brent and WTI prices over the period.

          Global Demand Outlook

          Analysts expect that global oil demand growth will slow compared with the early 2020s, but remain positive through most of the decade. The International Energy Agency (IEA) projects an increase of around 0.7 million barrels per day (mb/d) in 2025, the smallest annual gain since 2009 outside the pandemic years. By contrast, OPEC’s analysis points to demand reaching about 113.3 mb/d in 2030, arguing that growth in developing economies will more than offset declines in advanced economies.

          Most growth is anticipated to come from Asia, particularly India, China, and Southeast Asia, driven by rising mobility, industrial expansion, and petrochemical output. OECD countries are expected to see flat or declining consumption as efficiency gains, electrification, and policy measures reduce reliance on oil.Sector-wise sources note that road transport remains a major consumer but is seeing slower growth as electric vehicle adoption expands. Petrochemicals are highlighted as a resilient driver, particularly in Asia, where demand for plastics and industrial materials is increasing. Aviation fuel consumption is also projected to rise steadily as global air travel continues to expand.

          Supply-Side Dynamics

          OPEC+ policy is seen as a central influence on medium-term prices. The group currently controls over 40% of global output and has demonstrated its willingness to withhold production to prevent oversupply. Voluntary cuts of around 5 mb/d in 2023–2024, led by Saudi Arabia, reflect its role in setting a floor under prices. Some think that OPEC+ may continue to adjust output to maintain market balance, especially if demand growth underperforms.

          The US shale sector remains an important non-OPEC source, though production growth is expected to plateau at roughly 13.4 mb/d in 2025–2026. Industry capital discipline, investor pressure for shareholder returns, and the depletion of prime drilling locations are contributing to slower output gains.Outside the US, additional supply is expected from Brazil, Guyana, and Canadian oil sands projects. Geopolitical factors remain a persistent risk: tensions in the Middle East, Russia’s ongoing sanctions, and potential instability in countries such as Libya or Nigeria could all cause supply disruptions.

          Energy Transition and ESG Policies

          Sources say climate policies and the energy transition are likely to increasingly shape the demand outlook. Net-zero pledges are prompting efficiency gains, renewable energy deployment, and shifts in transport fuels. Electric vehicle adoption is expanding rapidly—over 40% of new car sales in China were electric or hybrid in 2024—and is expected to rise globally.

          Carbon pricing is being extended in more markets, with the EU planning to include road transport in its emissions trading system from 2027. Several major economies have announced internal combustion engine phase-out targets for 2035 or later, influencing automaker strategies today. Investor pressure on oil companies to align with ESG goals could restrain long-term upstream investment, potentially tightening supply later in the decade.

          Technological and Infrastructure Developments

          Advances in upstream technology are making production more efficient. US shale drillers now produce roughly 2.5 times more per rig than in 2014, with significant cost savings. Offshore projects are also benefiting from improved seismic imaging and standardised designs.

          Infrastructure expansion—such as new export terminals, pipelines, and refinery upgrades in Asia and Africa—may improve trade flows and regional supply security. Strategic petroleum reserves remain a market stabiliser; coordinated releases, such as the 180 million barrels from U.S. reserves in 2022, have demonstrated their ability to moderate price spikes. Inventory cycles are also expected to play a role, with surplus years weighing on prices and deficit periods adding upward pressure.

          Analytical Oil Price Forecasts for 2025

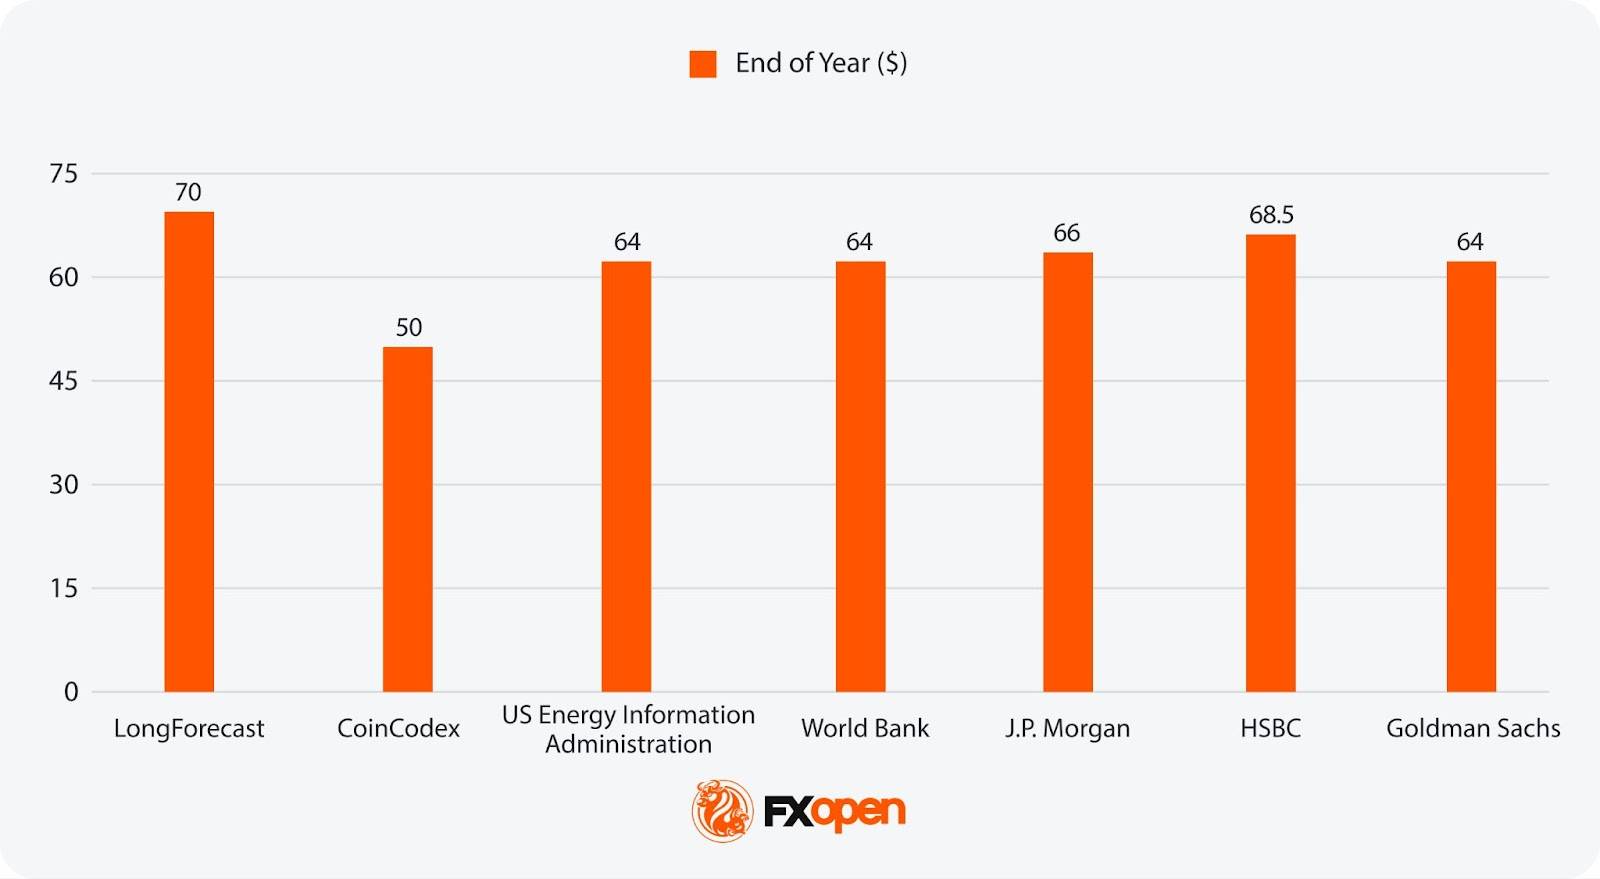
          Oil price forecasts in 2025 see modest oversupply, with the World Bank’s crude oil forecast projecting global production to exceed consumption by around 0.7 million barrels per day. Demand growth is likely to slow sharply to about +0.7 mb/d, the weakest since 2009 outside the pandemic, as post-COVID rebounds fade and efficiency gains take hold.Non-OPEC supply from the US, Brazil, and Guyana is anticipated to rise, while OPEC+ is gradually easing some voluntary cuts. As for Brent oil prices, forecasts for 2025 say that barrels could trade in a broad $50–$70 range under these conditions, unless geopolitical risks cause sudden disruptions.

          Brent

          ● Highest projection for end-of-year 2025: $70 (LongForecast)
          ● Lowest projection for end-of-year 2025: $50 (CoinCodex)

          WTI

          Analytical Oil Price Projections in 2026, 2027, and Beyond

          Looking ahead to the latter half of the 2020s, analytical oil price outlooks become mixed, with multiple factors that could shape its trajectory.

          Oil Price Forecasts for 2026

          Some sources think 2026 could mark a cyclical low point for prices if inventories continue to build from 2025. US shale output is projected to plateau, but new projects sanctioned earlier in the decade may still be adding capacity.Demand growth is expected to remain subdued, with OECD consumption trending down and emerging market growth moderating. OPEC+ may need to maintain or deepen cuts to counterbalance supply, particularly if global GDP growth is weak. A weaker demand environment could also coincide with increased competition for market share between OPEC+ and other oil producers.

          Brent

          ● Highest projection for mid-year 2026: $137 (CoinCodex)
          ● Lowest projection for mid-year 2026: $59 (US Energy Information Administration)
          ● Highest projection for end-of-year 2026: $96 (CoinCodex)
          ● Lowest projection for end-of-year 2026: $56 (Goldman Sachs)

          WTI

          Oil Price Forecasts for 2027

          It is expected that 2027 could see the market begin to rebalance. If low prices in preceding years reduce upstream investment, supply growth may slow, while demand could strengthen slightly with improved global economic conditions.Sources say that OPEC’s role could become more prominent if OPEC+ supply peaks, with a greater call on its production to meet rising consumption. Potential inventory drawdowns may support bullish oil price forecasts compared to mid-decade levels, although geopolitical risks and the pace of EV adoption remain key variables.

          Brent

          WTI

          Oil Price Forecasts for 2028

          By 2028, demand could approach or exceed 110 mb/d according to OPEC’s outlook, driven by emerging market growth in transport and petrochemicals. Refining capacity in Asia and the Middle East is expected to play a crucial role in meeting this demand.If upstream investment in the mid-2020s has been insufficient, some think spare capacity could tighten, raising the market’s sensitivity to supply shocks. However, if demand growth aligns more closely with the IEA’s slower trajectory, prices may remain moderate, with OPEC+ continuing to manage output.

          Brent

          WTI

          Oil Price Forecasts for 2029

          Analysts see 2029 as a potential inflection point. In the IEA’s view, demand growth may be close to zero by this stage, signalling a plateau near 102 mb/d. OPEC, however, projects continued expansion towards 112 mb/d, implying divergent market expectations.Low spare capacity in either scenario could lead to higher volatility. The market balance in 2029 may depend heavily on OPEC’s willingness to adjust output and on whether OPEC+ declines accelerate.

          Brent

          WTI

          Oil Price Forecasts for 2030

          By 2030, the oil market is expected to reflect the cumulative impact of a decade’s economic, policy, and technological shifts. This is the year when many national climate pledges and industrial transition milestones converge, potentially reshaping demand patterns. Some analysts expect consumption to have already plateaued, while others see emerging markets sustaining modest growth.

          2030’s conditions may be more about structural forces—how far electrification, efficiency measures, and fuel substitution have progressed, and whether upstream investment has kept pace with any remaining demand growth. The alignment, or divergence, between policy goals and market realities could set the tone for prices, with the potential for either a steady, well-supplied market or renewed tightness if supply lags.

          Brent

          WTI

          Analytical Crude Oil Forecasts Beyond 2030

          Beyond 2030, analytical crude oil outlooks say the direction of Brent and WTI prices will depend on whether global oil demand has entered a sustained decline or remains on a plateau. In scenarios where demand peaks early, prices could face downward pressure from structural oversupply unless producers deliberately limit output. OPEC’s influence may increase as OPEC+ supply declines, giving the group greater ability to adjust production to stabilise prices.

          Some think underinvestment in upstream capacity during the 2020s could create intermittent supply tightness, even if demand is weakening, leading to more frequent price volatility. The energy transition is expected to accelerate in the 2030s, with higher electric vehicle penetration, efficiency improvements, and alternative fuels reshaping demand patterns. Petrochemicals, aviation, and heavy transport may remain key demand pillars, but consumption in other sectors could contract.

          Policy measures, such as carbon pricing and stricter emissions regulations, could add cost pressures to oil use, influencing both consumption levels and production economics. Geopolitical dynamics may continue to be an important factor, particularly in key producing regions with low-cost reserves.Two sources, CoinCodex and CoinPriceForecast, have given WTI price forecasts beyond 2030. WTI oil prices are forecast to be around $81 in 2035, according to LongForecast, while CoinCodex expects it to hit $420 in 2040 and over $1,500 by 2050.Overall, market conditions beyond 2030 might be defined by the interplay of declining demand in some sectors, constrained supply growth, and shifting global energy priorities.

          FAQs

          What Is the Oil Outlook for 2026?

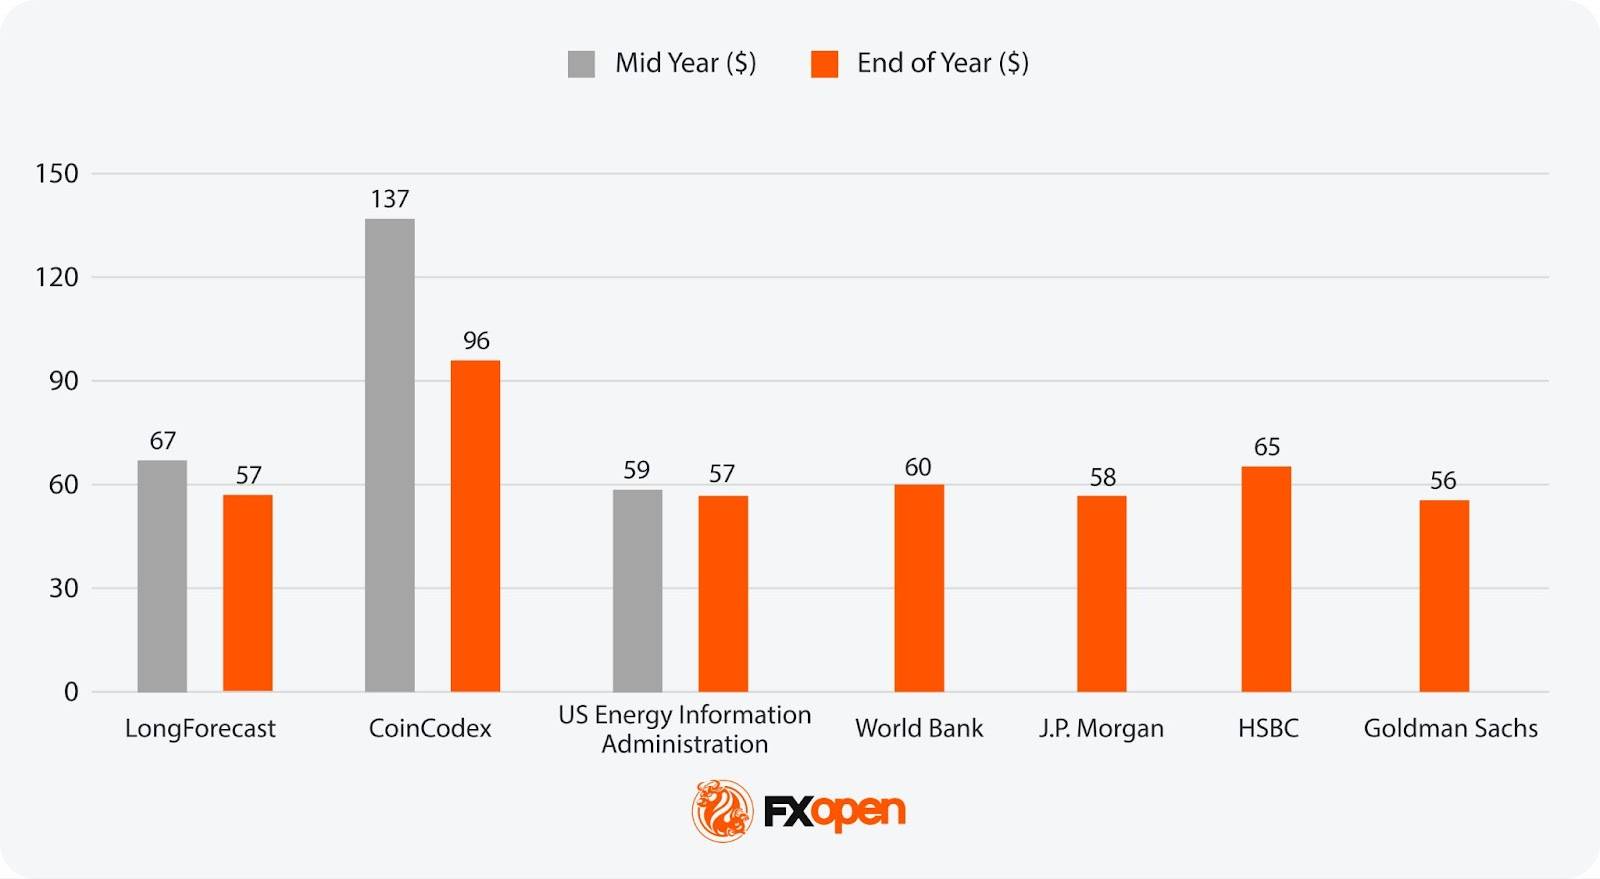
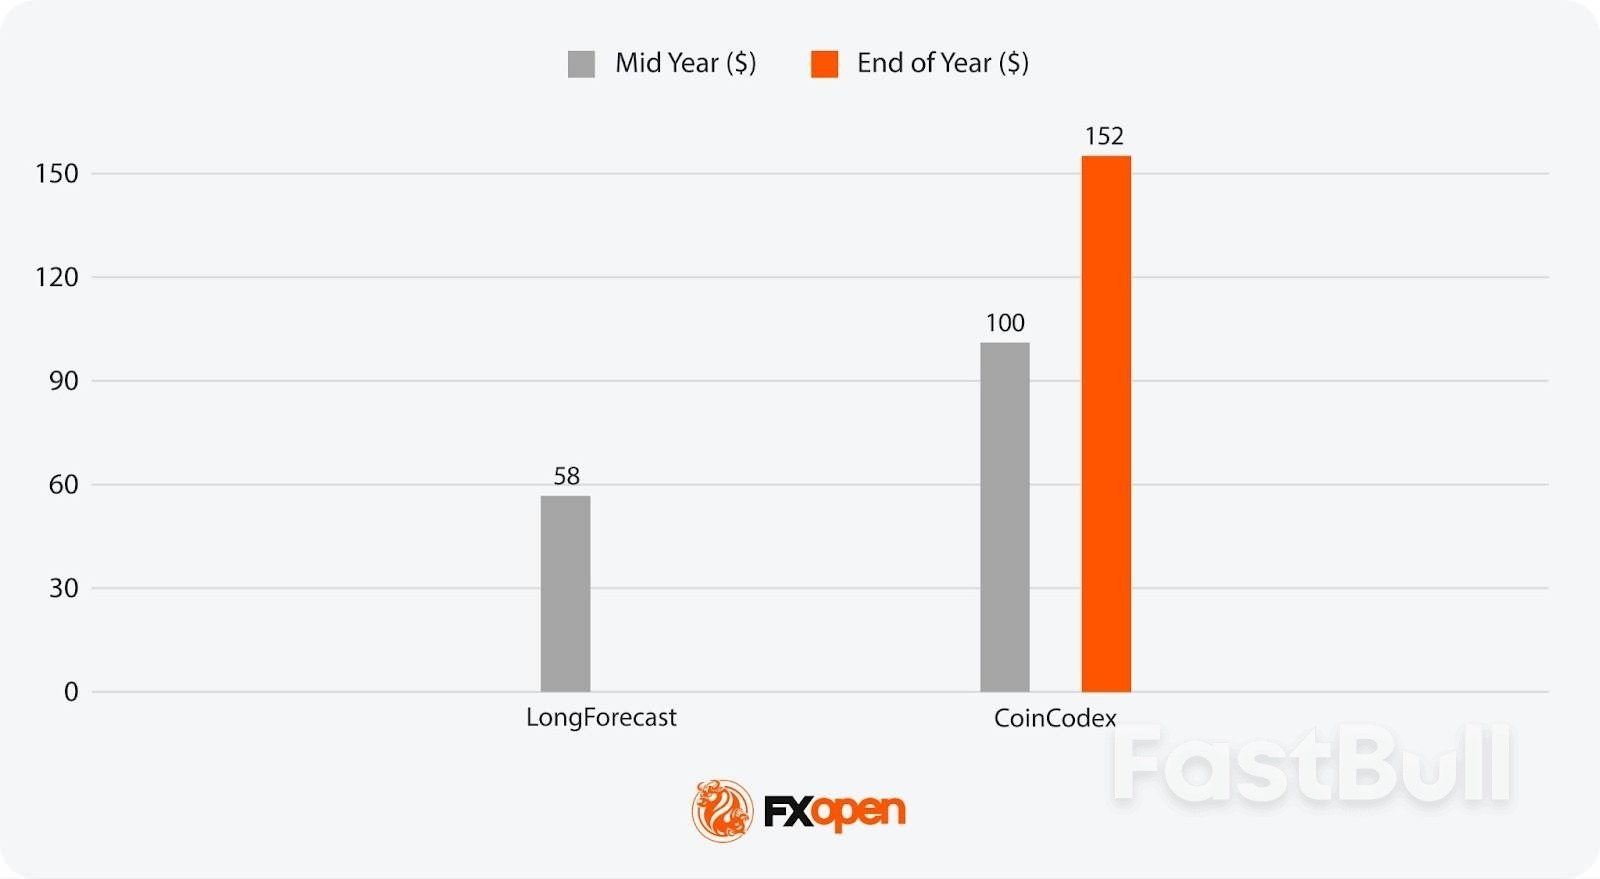
          Analysts generally expect 2026 to be a softer year for prices, with most crude oil predictions placing Brent between $56 and $137 per barrel and WTI in the $52 to $62 range. This reflects anticipated inventory builds from prior years, modest demand growth, and ongoing OPEC+ supply management to prevent deeper declines.

          What Are the Analytical Predictions for Oil Prices in 2027?

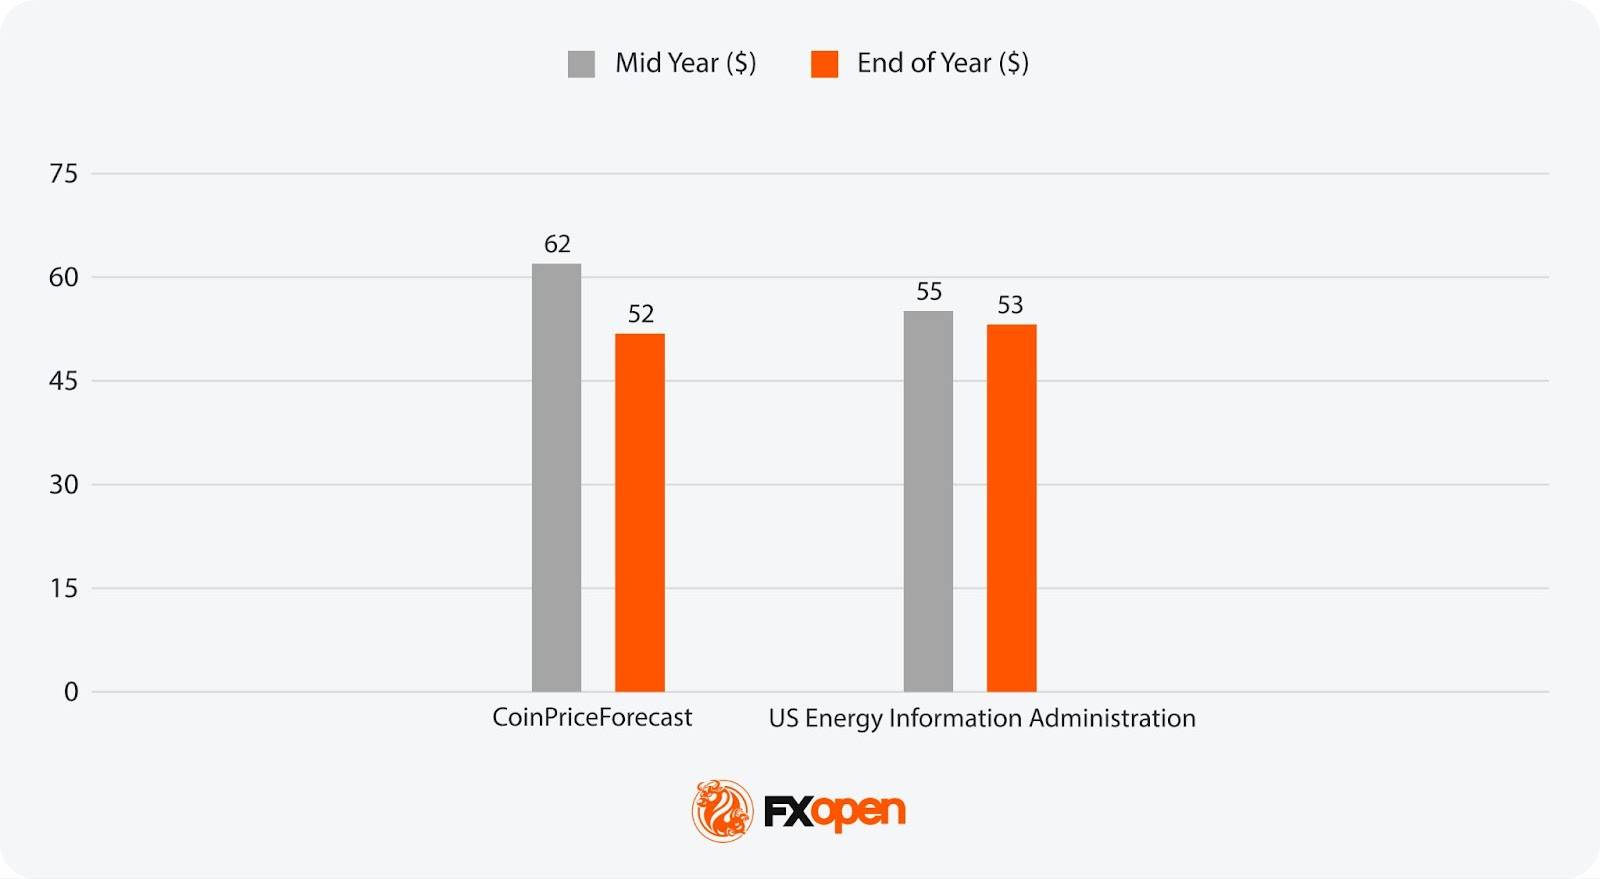
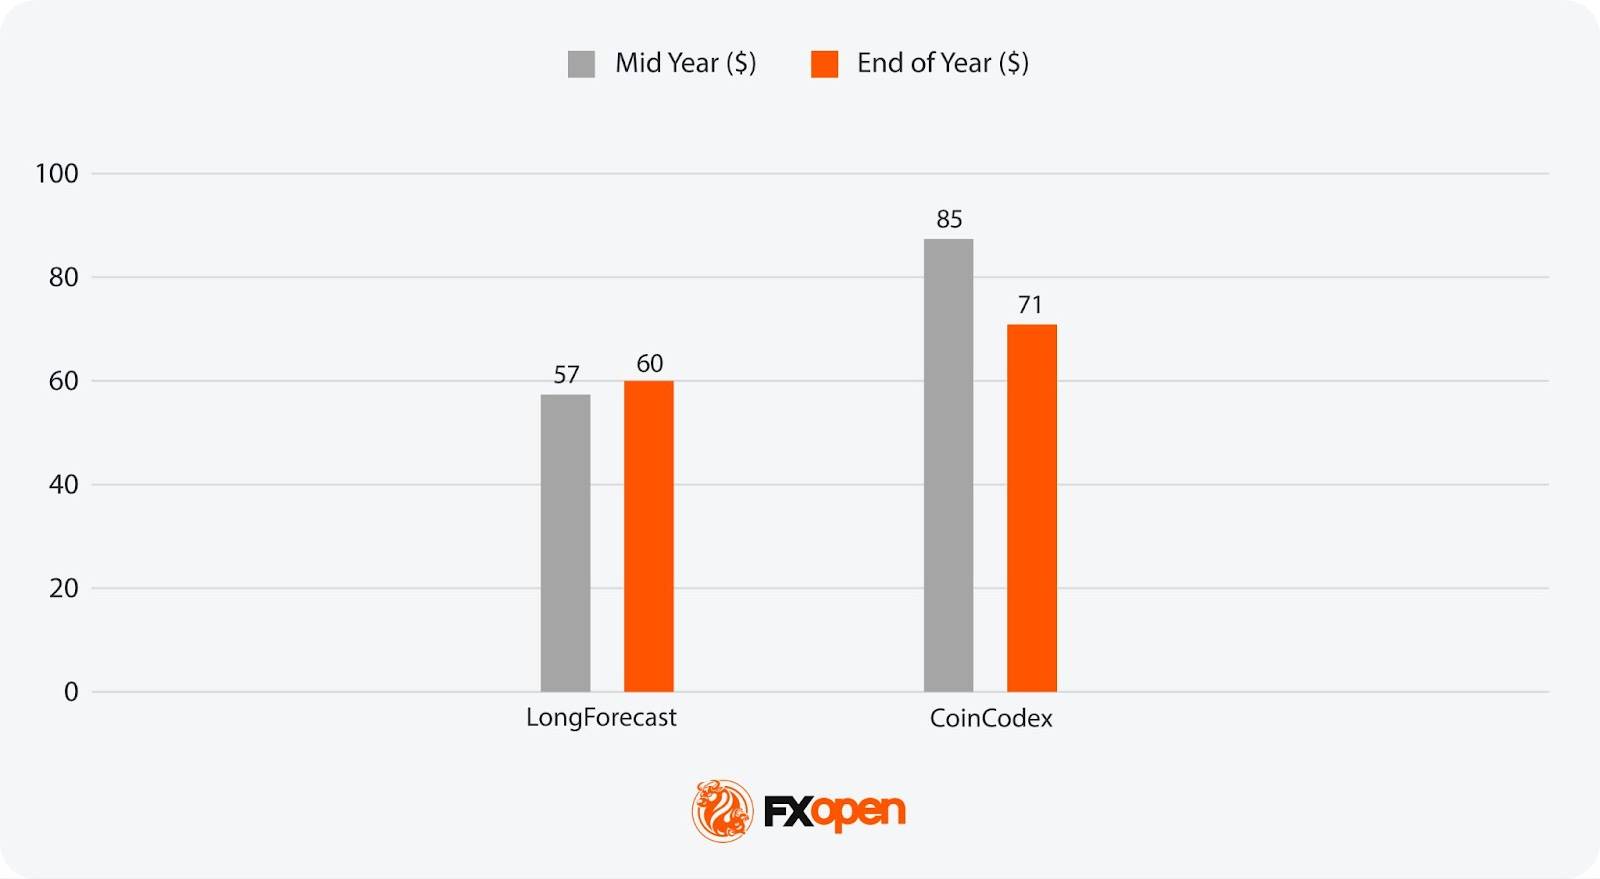
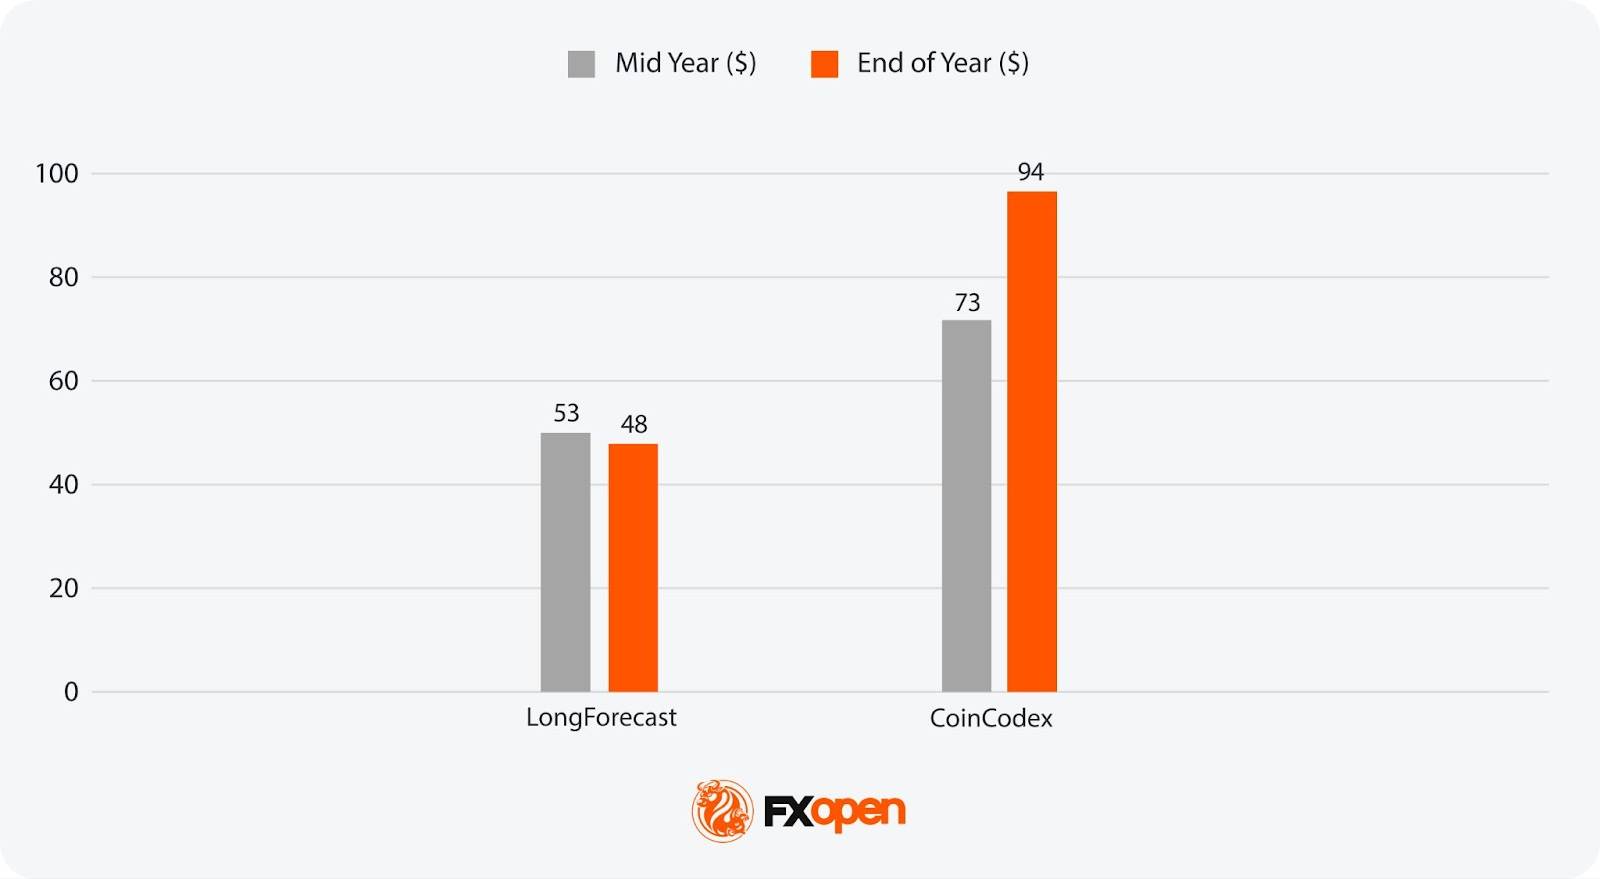
          Analytical oil price projections for 2027 are more limited, but some sources provide indicative ranges. LongForecast places Brent between $57 and $85 per barrel, while CoinPriceForecast estimates WTI between $50 and $52. Market balance at that time may hinge on whether supply growth slows due to reduced investment.

          What Could Crude Oil Be Worth in 2030?

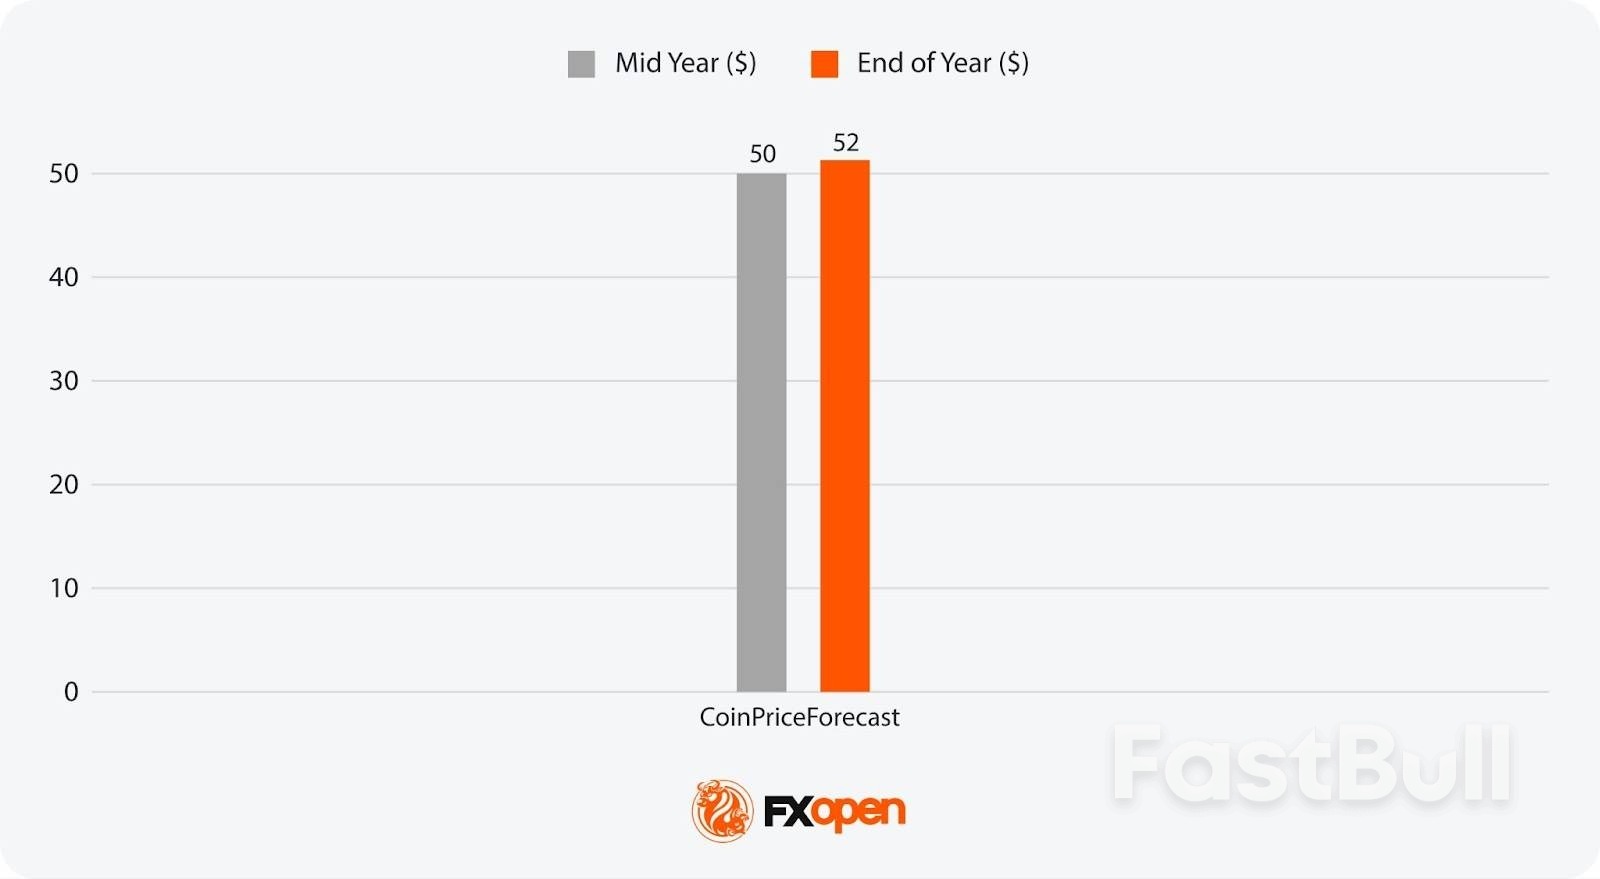
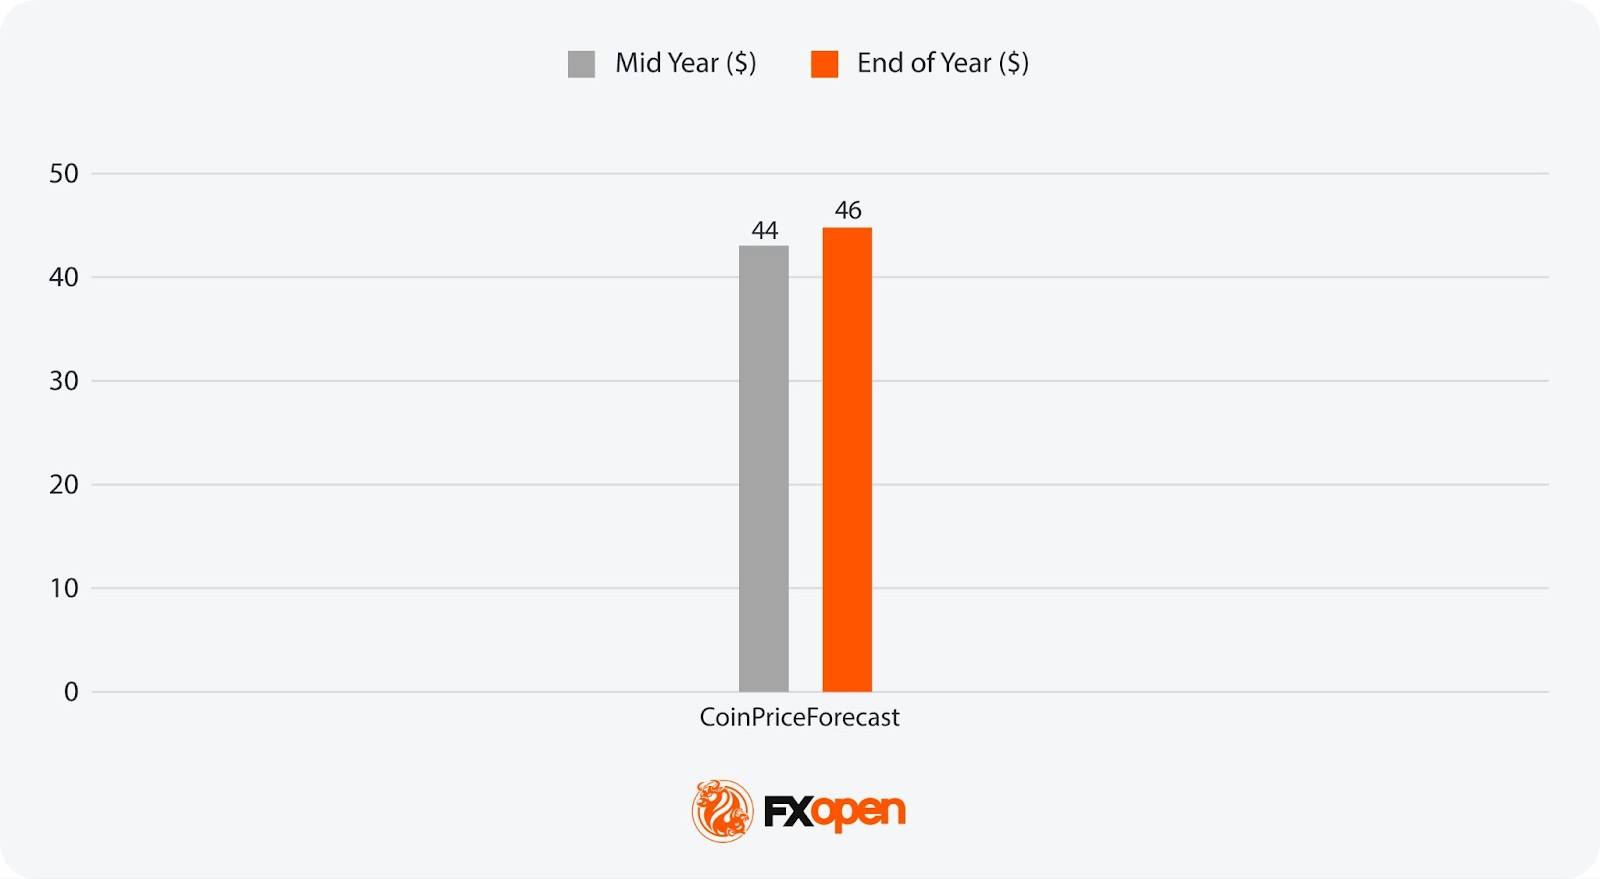
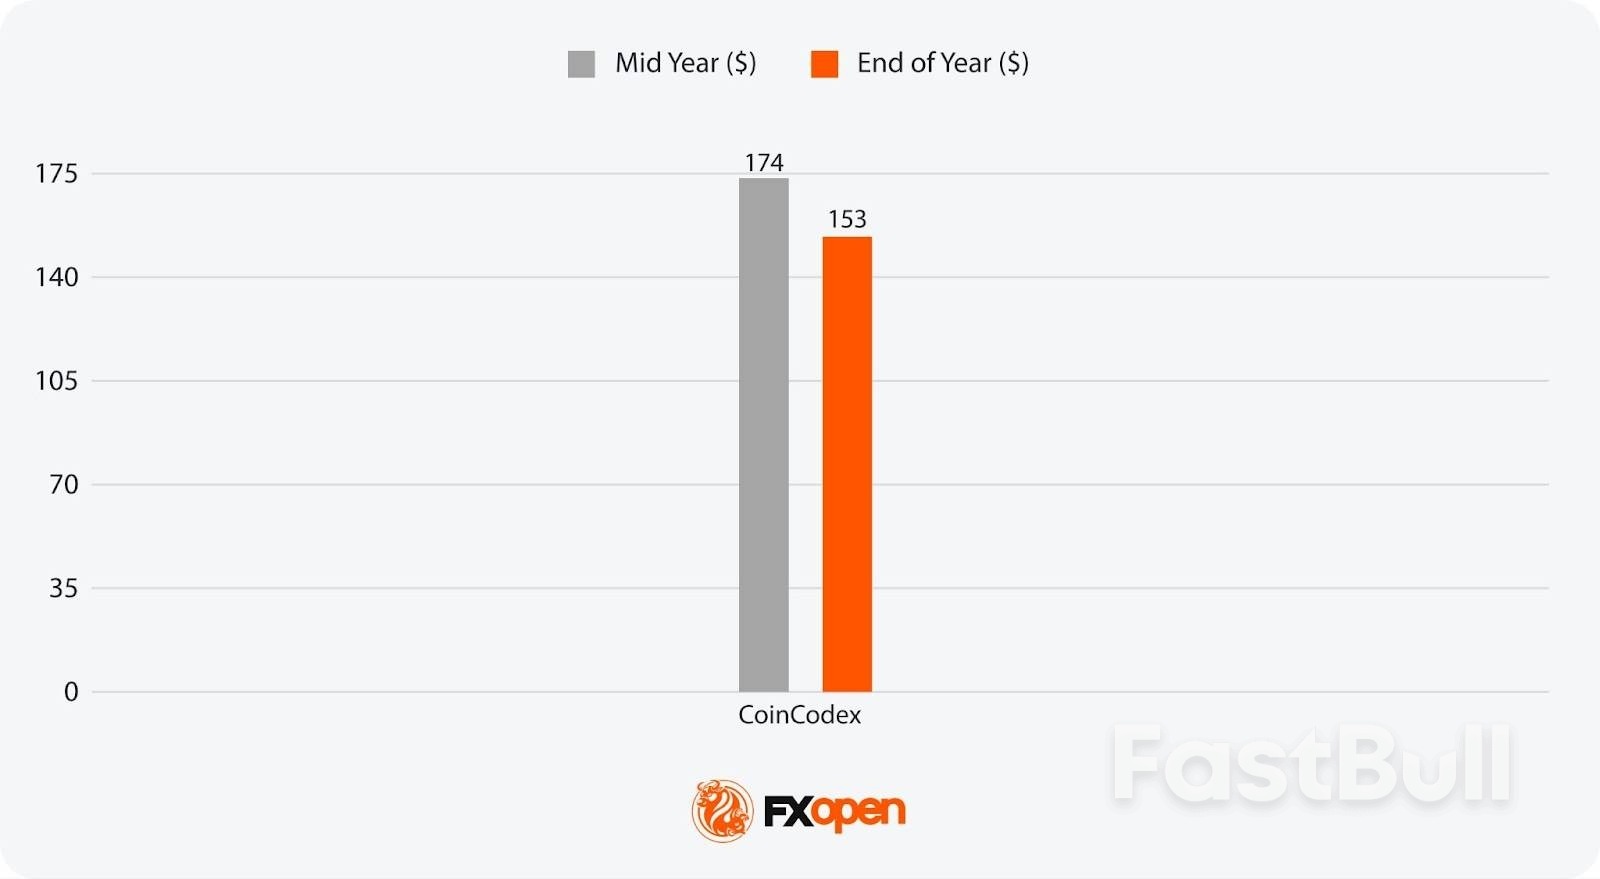
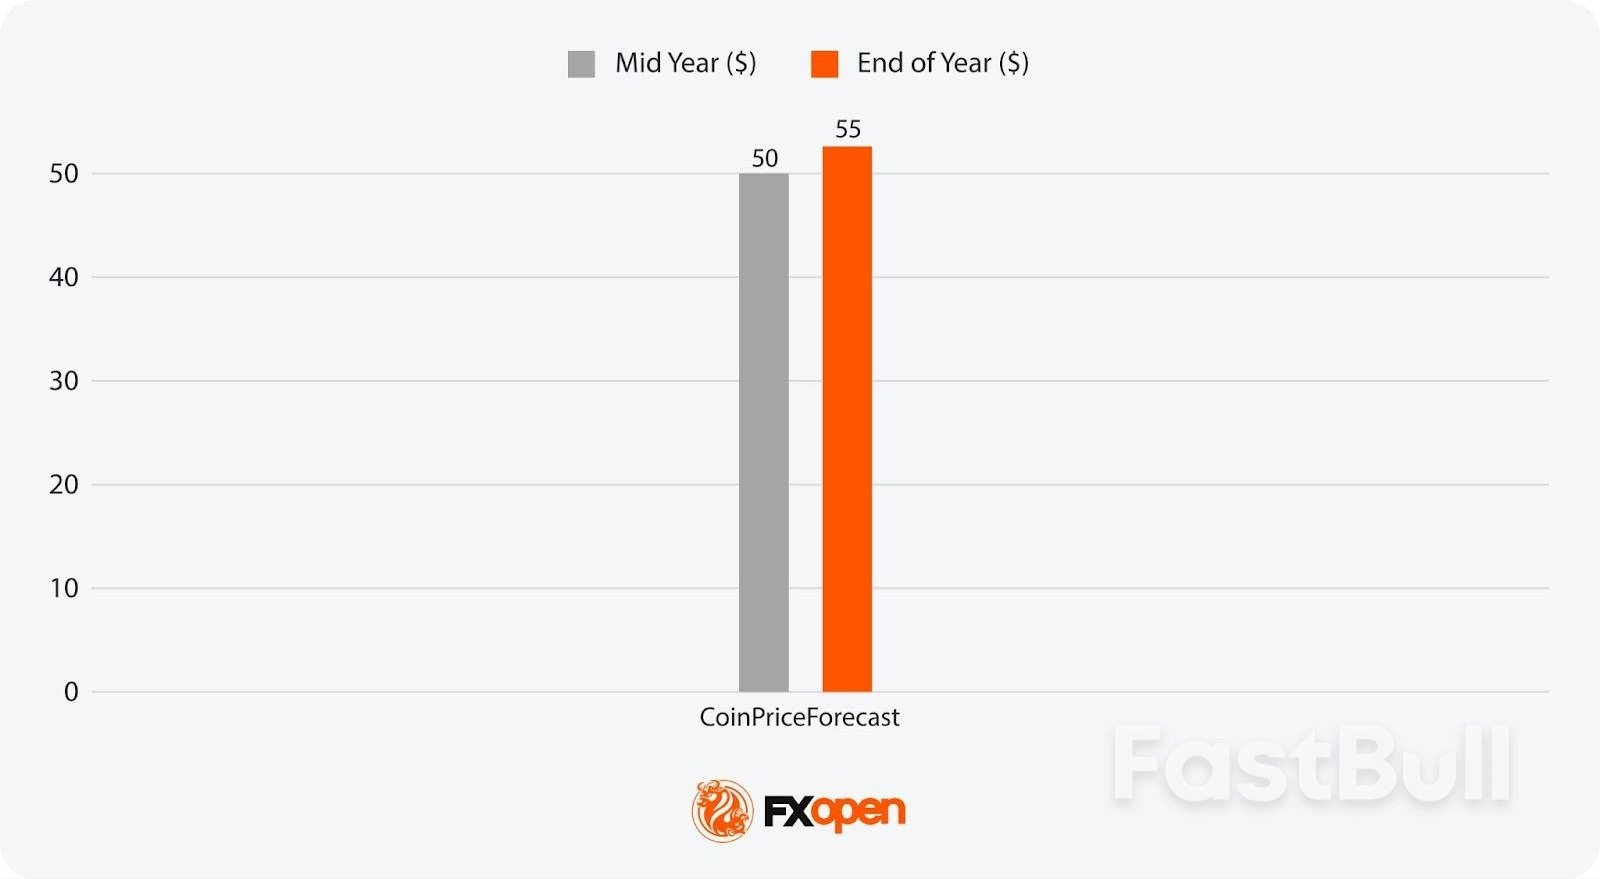
          Analytical long-range projections are scarce, but CoinCodex has suggested Brent could reach $174 per barrel, while CoinPriceForecast puts its WTI oil price forecast between $50 and $55. These disparities reflect uncertainty over demand trends, energy transition policies, and investment levels.

          Could Oil Prices Go Up?

          According to analysts, prices could rise in tighter market conditions or during supply disruptions, but they may also soften in surplus years.

          Could Oil Be a Good Investment in 2025?

          CFD trading enables traders to participate in the market regardless of whether an asset’s price is rising or falling, allowing them to potentially take advantage of both volatile upward and downward price movements.

          Source: FXOpen

          To stay updated on all economic events of today, please check out our Economic calendar
          Risk Warnings and Disclaimers
          You understand and acknowledge that there is a high degree of risk involved in trading. Following any strategies or investment methods may lead to potential losses. The content on the site is provided by our contributors and analysts for information purposes only. You are solely responsible for determining whether any trading assets, securities, strategy, or any other product is suitable for investing based on your own investment objectives and financial situation.
          Add to Favorites
          Share

          IC Markets Europe Fundamental Forecast | 18 September 2025

          IC Markets

          Commodity

          Forex

          Economic

          What happened in the Asia session?

          Today’s Asia session was defined by the fallout from the Fed’s quarter-point rate cut and Australia’s worse-than-expected jobs data, which pressured the AUD and weighed on local equities. Regional equities were mixed, with Japan’s Nikkei continuing to set the pace, while safe-haven flows supported the yen and gold. Markets are now awaiting outcomes from the BOJ meeting and Japanese inflation data later in the week.

          What does it mean for the Europe & US sessions?

          Today’s trading environment is characterized by central bank caution amid persistent inflation concerns. The BoE is expected to pause rate cuts despite economic weakness, while the Fed’s measured approach has strengthened the dollar and pressured commodities. Employment data from Australia and the US both show labor market softening, though inflation remains the primary concern for policymakers globally. Traders should monitor any dovish surprises from the BoE and manufacturing data for signs of economic momentum shifts.

          The Dollar Index (DXY)

          Thursday’s dollar performance reflected the ongoing market adjustment to the Fed’s dovish pivot, with the currency showing modest strength despite underlying concerns about labor market deterioration. The dollar’s recovery from Wednesday’s lows suggests markets are taking a more balanced view of the Fed’s cautious approach to further easing, though significant uncertainty remains about the pace of future rate cuts.Central Bank Notes:

          ● The Federal Open Market Committee (FOMC) voted, by majority, to lower the federal funds rate target range by 25 basis points to 4.00%–4.25% at its September 16–17, 2025, meeting, marking the first policy rate adjustment since December 2024 after five consecutive holds.
          ● The Committee maintained its long-term objective of achieving maximum employment and 2% inflation, acknowledging recent labor market softening and continued tariff-driven price pressures.
          ● Policymakers expressed elevated concern about downside risks to growth, citing a stalling labor market, modest job creation, and an unemployment rate drifting up toward 4.4%. At the same time, inflation remains above target, with CPI at 3.2% and core inflation at 3.1% as of August 2025; higher energy and food prices, largely attributable to tariffs, continue to weigh on headline measures.
          ● Although economic activity expanded at a moderate pace in the third quarter, the growth outlook has weakened. Q3 GDP growth is estimated near 1.0% (annualized), with full-year 2025 GDP growth guidance revised to 1.2%, reflecting slowing household consumption and tighter financial conditions.
          ● In the updated Summary of Economic Projections, the unemployment rate is projected to average 4.5% for the year, with headline PCE inflation revised up slightly to 3.1% for 2025. The Committee anticipates core PCE inflation to remain stubborn, requiring sustained vigilance and a flexible approach to risk management.
          ● The Committee reiterated its data-dependent approach and openness to further adjustments should employment or inflation deviate meaningfully from current forecasts. Several members dissented, either advocating a larger 50-basis-point cut or preferring no adjustment at this meeting, revealing heightened divergence within the Committee.
          ● Balance sheet reduction continues at a measured pace. The monthly Treasury redemption cap remains at $5B and the agency MBS cap at $35B, as the Board aims to support orderly market conditions in the face of evolving global and domestic uncertainty
          ● The next meeting is scheduled for 28 to 29 October 2025.

          Next 24 Hours BiasWeak Bearish

          Gold (XAU)

          Gold’s performance on September 18, 2025, reflects a classic “buy the rumor, sell the news” reaction to the Fed’s rate cut decision. While prices pulled back from record highs, the fundamental backdrop remains supportive with continued central bank buying, geopolitical tensions, dollar weakness, and expectations for further monetary policy easing. The precious metal has gained an impressive 39% year-to-date, and despite near-term volatility, analysts remain constructive on gold’s longer-term trajectory toward the $4,000 level and beyond.Next 24 Hours Bias Strong Bullish

          The Euro (EUR)

          The euro showed resilience despite minor Thursday weakness, maintaining near four-year highs against the dollar. Key supportive factors include eurozone inflation stabilizing at the ECB’s 2% target, improved economic growth projections, and market expectations that the central bank’s rate-cutting cycle has concluded. However, ongoing trade policy uncertainty and mixed economic indicators suggest cautious optimism, with the ECB maintaining its data-dependent approach while emphasizing that the disinflationary process is complete.Central Bank Notes:

          ● The Governing Council kept the three key ECB interest rates unchanged at its September 11, 2025, meeting. The main refinancing rate remains at 2.15%, the marginal lending facility at 2.40%, and the deposit facility at 2.00%. These levels have been maintained after the cuts earlier in 2025, reflecting the Council’s confidence that the current stance is consistent with the price stability mandate.
          ● Evidence that inflation is running close to the ECB’s medium-term target of 2% supported the decision to hold rates steady. Domestic price pressures are easing as wage growth continues to moderate, and financing conditions remain accommodative. Policymakers reaffirmed a data-dependent, meeting-by-meeting approach to further policy moves, with no pre-commitment to a predetermined path amid ongoing global and domestic risks.
          ● Eurosystem staff projections foresee headline inflation averaging 2.0% for 2025, 1.8% for 2026, and 2.0% in 2027. The 2025 and 2026 forecasts reflect a downward revision, primarily on lower energy costs and exchange rate effects, even as food inflation remains persistent. Core inflation (excluding energy and food) is expected at 2.0% for both 2026 and 2027, with only minor changes since prior rounds.
          ● Real GDP growth in the euro area is projected at 1.1% for 2025, 1.1% for 2026, and 1.4% for 2027. A robust first quarter—partly due to firms accelerating exports ahead of anticipated tariff hikes—cushioned a weaker outlook for the remainder of 2025. While business investment continues to face uncertainty from ongoing global trade disputes, especially with the US, government investment and infrastructure spending are expected to provide some support to the outlook..
          ● Household spending is backed by rising real incomes and continued strength in the labor market. Despite some fading tailwind from previous rate cuts, financing conditions remain broadly favorable and are expected to underpin the resilience of private consumption and investment against outside shocks. Moderating wage growth and profit margin adjustments are helping to absorb residual cost pressures.
          ● Household spending is backed by rising real incomes and continued strength in the labor market. Despite some fading tailwind from previous rate cuts, financing conditions remain broadly favorable and are expected to underpin the resilience of private consumption and investment against outside shocks. Moderating wage growth and profit margin adjustments are helping to absorb residual cost pressures.
          ● All future interest rate decisions will continue to be guided by the integrated assessment of economic and financial data, the inflation outlook, and underlying inflation dynamics, and the effectiveness of monetary policy transmission—without any pre-commitment to a specific future rate path.
          ● The ECB’s Asset Purchase Programme (APP) and Pandemic Emergency Purchase Programme (PEPP) portfolios are declining predictably, as reinvestment of maturities has ceased. Balance-sheet normalization continues in line with the ECB’s previously communicated schedule.
          ● The next meeting is on 29 to 30 October 2025

          Next 24 Hours BiasMedium Bullish

          The Swiss Franc (CHF)

          The Swiss Franc continues to attract safe-haven flows as global uncertainty lingers, with its value versus the USD and other major currencies close to recent highs. The Swiss National Bank is expected to hold rates steady, and no major new data or surprises are anticipated today. Global strategists view CHF as a preferred safe-haven, particularly in comparison to the Japanese yen, given Switzerland’s fiscal stability and prudent central bank policy.Central Bank Notes:

          ● The SNB eased monetary policy by lowering its key policy rate by 25 basis points, from 0.25% to 0% on 19 June 2025, marking the sixth consecutive reduction.
          ● Inflationary pressure has decreased further as compared to the previous quarter, decreasing from 0.3% in February to -0.1% in May, mainly attributable to lower prices in tourism and oil products.
          ● Compared to March, the new conditional inflation forecast is lower in the short term. In the medium term, there is hardly any change from March, putting the average annual inflation at 0.2% for 2025, 0.5% for 2026, and 0.7% for 2027.
          ● The global economy continued to grow at a moderate pace in the first quarter of 2025, but the global economic outlook for the coming quarters has deteriorated due to the increase in trade tensions.
          ● Swiss GDP growth was strong in the first quarter of 2025, but this development was largely because, as in other countries, exports to the U.S. were brought forward.
          ● Following the strong first quarter, growth is likely to slow again and remain rather subdued over the remainder of the year; the SNB expects GDP growth of 1% to 1.5% for 2025 as a whole, while also anticipating GDP growth of 1% to 1.5% for 2026.
          ● The SNB will continue to monitor the situation closely and will adjust its monetary policy if necessary to ensure inflation remains within the range consistent with price stability over the medium term.
          ● The next meeting is on 25 September 2025.

          Next 24 Hours BiasMedium Bullish

          The Pound (GBP)

          Sterling’s recent gains reflect cautious optimism pending BoE policy outcomes, but upside is seen as limited unless economic data surprises or the BoE signals a policy shift. Overall, market focus today is on the tone of the BoE statement and any hints about future rate cuts. Labor market data shows stable unemployment at 4.7%, wage growth of 4.8% (excluding bonuses), and a slight fall in payrolls by 8,000—broadly in line with forecasts and suggesting a gradually slowing jobs market.Central Bank Notes:
          ● The Bank of England’s Monetary Policy Committee (MPC) voted on 18 September 2025 by a majority (expected split likely 7–2 or 6–3) to hold the Bank Rate steady at 4.00%, following the August rate cut. Most members cited persistent inflation and mixed indicators on growth and employment, while a minority favored further easing due to the cooling labor market and subdued GDP growth.
          ● The Committee decided to decrease the pace of quantitative tightening, planning to reduce the stock of UK government bond purchases by £67.5 billion over the next 12 months instead of the prior £100 billion pace, with the gilt balance now standing near £558 billion. This reflects increased volatility in bond markets and a shift to a more gradual approach.
          ● Headline inflation rose unexpectedly to 3.8% in July and is projected at 4% for September, above the Bank’s 2% target. Price pressures are driven by regulated energy costs and ongoing food price increases. While previous disinflation has been substantial, core inflation remains elevated and sticky.
          ● The MPC expects headline inflation to remain above target through Q4, with a resumption of the downward trend projected for early 2026 as energy and regulated price pressures abate. The Committee remains watchful for signs of persistent inflation despite previous policy tightening.
          ● UK GDP growth is stagnant, with business and consumer activity subdued. Recent labor market data show rising unemployment rates (now at 4.7%) and stabilizing wage growth (holding near 5%), indicating slack but continued wage price pressure. The Committee remains cautious amid lackluster demand and soft survey sentiment.
          ● Pay growth and employment indicators have moderated further, alongside confirmation from business surveys that pay settlements are slowing. The Committee expects wage growth to decelerate significantly through Q4 and the rest of 2025.
          ● Global uncertainty persists due to volatile energy prices, supply chain disruptions linked to Middle East conflicts, and renewed trade tensions. The MPC remains vigilant in tracking transmission of external cost/wage shocks to UK inflation.
          ● Risks to inflation are considered two-sided. While subdued domestic growth and softening labor activity suggest scope for easing, persistent inflation requires caution. The MPC anticipates a slow, gradual reduction path in rates, continuing its data-dependent approach with careful adjustment as warranted by economic developments.
          ● The Committee’s bias remains toward maintaining a restrictive monetary policy stance until firmer evidence emerges that inflation will return sustainably to the 2% target. All future decisions will remain highly data dependent, with a strong emphasis on evolving demand, inflation expectations, costs, and labor market conditions.
          ● The next meeting is on 6 November 2025.
          Next 24 Hours BiasMedium Bullish

          The Canadian Dollar (CAD)

          The Canadian dollar remains under slight pressure following the rate cut, with the central bank signaling flexibility for further action if economic weakness persists. Traders are awaiting the US Federal Reserve signals and watching oil prices and trade policy for further direction. The USD/CAD exchange rate is currently around 1.3760, with CAD to USD at about 0.726. Exchange rates have fluctuated in a relatively tight range over the past week, and CAD is up about 0.7% weekly after the rate cut.Central Bank Notes:

          ● The Bank of Canada reduced its target for the overnight rate to 2.50% at its September 17 meeting, with the Bank Rate at 2.75% and the deposit rate at 2.25%. This marks the first rate cut since early 2025, as the Bank responded to a string of softer inflation prints and persistent economic headwinds.
          ● The Council cited continued U.S. tariff volatility and slow progress on trade negotiations as major contributors to ongoing uncertainty. While headline tariffs have not escalated further, the unpredictability of U.S. policy remains a significant risk for Canadian exports and business confidence.
          ● Uncertainty about U.S. trade policy and recurring tariff threats continued to weigh on growth prospects. The Bank flagged downside risks to the export sector, with survey data indicating ongoing hesitancy among manufacturers and exporters.
          ● After modest growth in Q1, Canada’s economy slipped into contraction, with GDP shrinking by 0.8% in Q2 and forecast to decrease again by 0.8% in Q3. Economic weakness has been most pronounced in manufacturing and goods-producing sectors affected by trade frictions and softer U.S. demand.
          ● Early estimates show that growth stabilized in September but remained well below the Bank’s 2% forecast for Q4. Manufacturing output has improved slightly—supported by a modest rebound in petroleum and mining activity—while consumer spending and retail sales were largely flat.
          ● Consumer spending remained subdued as households continued to limit discretionary purchases amid uncertainty and a slower job market. Housing activity stayed weak, despite earlier government efforts to boost affordability and modest gains in some real estate segments.
          ● Headline CPI inflation edged up to 1.9% in August, undershooting economist expectations but still showing emerging pressures from shelter and imported goods costs. Core inflation metrics were mixed, though price growth remains just below the Bank’s 2% target.
          ● The Governing Council reaffirmed its cautious approach, emphasizing that while further rate cuts are possible, the pace will hinge on the path of U.S. tariffs, domestic inflation dynamics, and signs of a sustainable recovery. The Bank remains vigilant against the risk of inflation falling below target in the face of economic slack.
          ● The next meeting is on 29 October 2025.

          Next 24 Hours BiasWeak Bearish

          Oil

          Oil markets on September 18, 2025, reflect a complex interplay of bearish supply-demand fundamentals and ongoing geopolitical risks. While the Federal Reserve’s rate cut provides potential longer-term demand support, immediate concerns about U.S. economic weakness, rising distillate inventories, and OPEC+ production increases are keeping prices under pressure. The market continues to trade within its established $5 range, with Brent around $68 and WTI near $64, as traders await clearer signals about global economic recovery and supply disruption risks from the ongoing Russia-Ukraine conflict.

          Next 24 Hours BiasMedium Bearish

          Source: IC Markets

          To stay updated on all economic events of today, please check out our Economic calendar
          Risk Warnings and Disclaimers
          You understand and acknowledge that there is a high degree of risk involved in trading. Following any strategies or investment methods may lead to potential losses. The content on the site is provided by our contributors and analysts for information purposes only. You are solely responsible for determining whether any trading assets, securities, strategy, or any other product is suitable for investing based on your own investment objectives and financial situation.
          Add to Favorites
          Share
          FastBull
          Copyright © 2025 FastBull Ltd

          728 RM B 7/F GEE LOK IND BLDG NO 34 HUNG TO RD KWUN TONG KLN HONG KONG

          TelegramInstagramTwitterfacebooklinkedin
          App Store Google Play Google Play
          Products
          Charts

          Chats

          Q&A with Experts
          Screeners
          Economic Calendar
          Data
          Tools
          Membership
          Features
          Function
          Markets
          Copy Trading
          Latest Signals
          Contests
          News
          Analysis
          24/7
          Columns
          Education
          Company
          Careers
          About Us
          Contact Us
          Advertising
          Help Center
          Feedback
          User Agreement
          Privacy Policy
          Business

          White Label

          Data API

          Web Plug-ins

          Poster Maker

          Affiliate Program

          Risk Disclosure

          The risk of loss in trading financial instruments such as stocks, FX, commodities, futures, bonds, ETFs and crypto can be substantial. You may sustain a total loss of the funds that you deposit with your broker. Therefore, you should carefully consider whether such trading is suitable for you in light of your circumstances and financial resources.

          No decision to invest should be made without thoroughly conducting due diligence by yourself or consulting with your financial advisors. Our web content might not suit you since we don't know your financial conditions and investment needs. Our financial information might have latency or contain inaccuracy, so you should be fully responsible for any of your trading and investment decisions. The company will not be responsible for your capital loss.

          Without getting permission from the website, you are not allowed to copy the website's graphics, texts, or trademarks. Intellectual property rights in the content or data incorporated into this website belong to its providers and exchange merchants.

          Not Logged In

          Log in to access more features

          FastBull Membership

          Not yet

          Purchase

          Become a signal provider
          Help Center
          Customer Service
          Dark Mode
          Price Up/Down Colors

          Log In

          Sign Up

          Position
          Layout
          Fullscreen
          Default to Chart
          The chart page opens by default when you visit fastbull.com