


- AUDUSD
- XAUUSD
- XAGUSD
- WTI
- USDX


Markets
Analysis
User
24/7
Economic Calendar
Education
Data
- Names
- Latest
- Prev


India's swift U.S. trade deal, abandoning Russian oil, reveals acute capital flight and severe export sector stress.
A major India-U.S. trade agreement announced on February 2 appeared with surprising speed. Following a call between President Donald Trump and Prime Minister Narendra Modi, tariffs were cut to 18 percent, and a $500 billion purchase and investment commitment was outlined to reset bilateral ties.
But hidden within the deal was a concession with far-reaching consequences: India reportedly agreed to halt its purchases of Russian oil. This wasn't just a minor policy tweak. It struck at the heart of India's long-standing economic strategy of strategic autonomy, built on diversifying its partners, energy sources, and markets since the 1990s.
The critical question isn't whether the deal can be justified, but why it became necessary at this exact moment. The answer is found not in diplomacy, but in a convergence of pressures that became undeniable through 2025: collapsing capital flows, severe export stress, and the limits of market diversification.
The first signs of trouble didn't come from trade deficits but from India's capital account. While equity markets seemed resilient for much of 2025, a troubling trend was developing beneath the surface as long-term foreign capital began to withdraw.
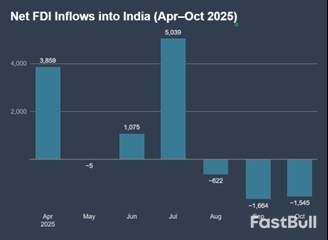
A Sudden Collapse in Foreign Investment
The data is stark. After modest inflows early in the year, net foreign direct investment (FDI) turned negative in August 2025. By October, outflows were accelerating. For the year, net FDI plummeted by over 96 percent to just $353 million, while repatriations and disinvestment approached $50 billion.
This shift was structurally significant. FDI isn't hot money; its contraction signals a deep reassessment of medium-term risk. With the capital account no longer acting as a stabilizer, even a meaningful trade agreement with the EU couldn't calm investor nerves. Markets were pricing in geopolitical risk and India's position in a fragmenting global financial system. Policymakers needed a powerful signal to reassure global capital, and realigning with Washington offered exactly that.
Uneven Pain in India's Export Sector
Pressure on the capital account was matched by a sharper, more politically sensitive domestic problem. While India's aggregate exports held up, the impact of U.S. tariff threats was dangerously uneven.
• Capital-intensive sectors like telecom instruments and electrical machinery thrived, with telecom exports soaring by nearly 237 percent. These industries are dominated by large, resilient firms integrated into global supply chains.
• Labor-intensive sectors faced a severe contraction. Gems and jewelry exports fell by over 40 percent, and textiles dropped by more than 22 percent.
This divergence had huge employment implications. The industries under pressure employ vast numbers of workers, often in the informal economy. For them, sustained U.S. tariffs of 25 to 50 percent were an existential threat, causing buyers to cancel or defer orders. Protecting these jobs required immediate tariff relief, and securing that relief required concessions. Energy sourcing became the bargaining chip.
A common counterargument is that India was already reducing its dependence on the U.S. by diversifying its export markets. The data shows this was happening, but it wasn't a fast enough solution.
Marine exports provide a clear example. While shipments to the U.S. fell by over 17 percent, exports to China grew by nearly 23 percent, and those to Belgium more than doubled. This hunt for alternative markets was real, but market diversification is a slow, commercial process. It couldn't offset the immediate financial shock from capital flight or the employment crisis driven by tariffs.
By late 2025, India's options were narrowing. Diversification was underway but incomplete. Capital was fleeing, and job losses were mounting in key sectors. The agreement with the United States was a way to address all these constraints at once, even if it came at a high structural cost.
Viewing these dynamics together clarifies the logic behind the February 2 announcement. The deal was a product of tightening constraints, not a change in strategic doctrine. The collapse in FDI exposed India's external financing weaknesses just as trade volatility was rising.
To stabilize the situation, the government needed a single, powerful move that could influence capital markets, trade relations, and geopolitical sentiment simultaneously. The U.S. was the only partner that could deliver such a signal. The tariff reduction to 18 percent, the $500 billion "Buy American" commitment, and the realignment on energy all served to re-anchor India within the dominant global economic order.
The costs of this pivot are clear:
• Energy security was traded for capital market reassurance.
• Export jobs were shielded by accepting future economy-wide inflation from higher energy prices.
• Strategic autonomy has become more conditional.
The decision to abandon discounted Russian crude was a macroeconomic adjustment made under duress, not an ideological break. This new trade deal doesn't create a new growth model for India. Instead, it manages a moment of acute vulnerability, buying time by committing future policy flexibility. Whether that trade-off proves wise will depend entirely on how that time is used.
728 RM B 7/F GEE LOK IND BLDG NO 34 HUNG TO RD KWUN TONG KLN HONG KONG


The risk of loss in trading financial instruments such as stocks, FX, commodities, futures, bonds, ETFs and crypto can be substantial. You may sustain a total loss of the funds that you deposit with your broker. Therefore, you should carefully consider whether such trading is suitable for you in light of your circumstances and financial resources.
No decision to invest should be made without thoroughly conducting due diligence by yourself or consulting with your financial advisors. Our web content might not suit you since we don't know your financial conditions and investment needs. Our financial information might have latency or contain inaccuracy, so you should be fully responsible for any of your trading and investment decisions. The company will not be responsible for your capital loss.
Without getting permission from the website, you are not allowed to copy the website's graphics, texts, or trademarks. Intellectual property rights in the content or data incorporated into this website belong to its providers and exchange merchants.
Not Logged In
Log in to access more features


Log In
Sign Up


