• Trade
  • Markets
  • Copy
  • Contests
  • News
  • 24/7
  • Calendar
  • Q&A
  • Chats
Trending
Screeners
SYMBOL
LAST
BID
ASK
HIGH
LOW
NET CHG.
%CHG.
SPREAD
SPX
S&P 500 Index
6827.42
6827.42
6827.42
6899.86
6801.80
-73.58
-1.07%
--
DJI
Dow Jones Industrial Average
48458.04
48458.04
48458.04
48886.86
48334.10
-245.98
-0.51%
--
IXIC
NASDAQ Composite Index
23195.16
23195.16
23195.16
23554.89
23094.51
-398.69
-1.69%
--
USDX
US Dollar Index
97.920
98.000
97.920
98.070
97.810
-0.030
-0.03%
--
EURUSD
Euro / US Dollar
1.17447
1.17455
1.17447
1.17596
1.17262
+0.00053
+ 0.05%
--
GBPUSD
Pound Sterling / US Dollar
1.33838
1.33847
1.33838
1.33961
1.33546
+0.00131
+ 0.10%
--
XAUUSD
Gold / US Dollar
4331.32
4331.73
4331.32
4350.16
4294.68
+31.93
+ 0.74%
--
WTI
Light Sweet Crude Oil
56.854
56.884
56.854
57.601
56.789
-0.379
-0.66%
--

Community Accounts

Signal Accounts
--
Profit Accounts
--
Loss Accounts
--
View More

Become a signal provider

Sell trading signals to earn additional income

View More

Guide to Copy Trading

Get started with ease and confidence

View More

Signal Accounts for Members

All Signal Accounts

Best Return
  • Best Return
  • Best P/L
  • Best MDD
Past 1W
  • Past 1W
  • Past 1M
  • Past 1Y

All Contests

  • All
  • Trump Updates
  • Recommend
  • Stocks
  • Cryptocurrencies
  • Central Banks
  • Featured News
Top News Only
Share

Portugal Treasury Expects 2026 Net Financing Needs At 29.4 Billion Euros, Up From 25.8 Billion In 2025

Share

Bank Of America Says With Indonesia's Smelter Now Ramping Up, It Expects Aluminium Supply Growth To Accelerate To 2.6% Year On Year In 2026

Share

Bank Of America Expects A Deficit In Aluminium Next Year And Sees Prices Pushing Above $3000/T

Share

Fed Data - USA Effective Federal Funds Rate At 3.64 Percent On 12 December On $102 Billion In Trades Versus 3.64 Percent On $99 Billion On 11 December

Share

Brazil's Petrobras Says No Impact Seen On Oil, Petroleum Products Output As Workers Start Planned Strike

Share

Statement: US Travel Group Warns New Proposed Trump Administration Requirements For Foreign Tourists To Provide Social Media Histories Could Mean Millions Of People Opting Not To Visit

Share

Blackrock: Kerry White Will Become Head Of Citi Investment Management At Citi Wealth

Share

Blackrock: Rob Jasminski, Head Of Citi Investment Management, Has Joined With Team

Share

Blackrock: Effective Dec 15, Citi Investment Management Employees Will Join Blackrock

Share

Blackrock: Formally Launch Citi Portfolio Solutions Powered By Blackrock

Share

According To Data From The Federal Reserve Bank Of New York, The Secured Overnight Funding Rate (Sofr) Was 3.67% On The Previous Trading Day (December 15), Compared To 3.66% The Day Before

Share

Peru Energy And Mines Ministry: Copper Production Up 4.8% Year-On-Year In October To 248192 Metric Tons

Share

Security Source: Ukrainian Drones Hits Russian Oil Infrastructure In Caspian Sea For Third Time

Share

Spot Palladium Extends Gains, Last Up 5% To $1562.7/Oz

Share

Mexico's Economy Ministry Announces Start Of Anti-Dumping Investigation And Anti-Subsidy Investigations Into USA Pork Imports

Share

Canada Nov CPI Common +2.8%, CPI Median +2.8%, CPI Trim +2.8% On Year

Share

NY Fed's Empire State Prices Paid Index +37.6 In December Versus+49.0 In November

Share

Canada Nov Consumer Prices +0.1% On Month, +2.2% On Year

Share

Canada Nov CPI Core -0.1% On Month, +2.9% On Year

Share

Canada Nov Core CPI, Seasonally Adjusted +0.2% On Month, Oct +0.3% (Unrevised)

TIME
ACT
FCST
PREV
Japan Tankan Small Manufacturing Outlook Index (Q4)

A:--

F: --

P: --

Japan Tankan Large Non-Manufacturing Outlook Index (Q4)

A:--

F: --

P: --

Japan Tankan Large Manufacturing Outlook Index (Q4)

A:--

F: --

P: --

Japan Tankan Small Manufacturing Diffusion Index (Q4)

A:--

F: --

P: --

Japan Tankan Large Manufacturing Diffusion Index (Q4)

A:--

F: --

P: --

Japan Tankan Large-Enterprise Capital Expenditure YoY (Q4)

A:--

F: --

P: --

U.K. Rightmove House Price Index YoY (Dec)

A:--

F: --

P: --

China, Mainland Industrial Output YoY (YTD) (Nov)

A:--

F: --

P: --

China, Mainland Urban Area Unemployment Rate (Nov)

A:--

F: --

P: --

Saudi Arabia CPI YoY (Nov)

A:--

F: --

P: --

Euro Zone Industrial Output YoY (Oct)

A:--

F: --

P: --

Euro Zone Industrial Output MoM (Oct)

A:--

F: --

P: --

Canada Existing Home Sales MoM (Nov)

A:--

F: --

P: --

Canada National Economic Confidence Index

A:--

F: --

P: --

Canada New Housing Starts (Nov)

A:--

F: --

P: --
U.S. NY Fed Manufacturing Employment Index (Dec)

A:--

F: --

P: --

U.S. NY Fed Manufacturing Index (Dec)

A:--

F: --

P: --

Canada Core CPI YoY (Nov)

A:--

F: --

P: --

Canada Manufacturing Unfilled Orders MoM (Oct)

A:--

F: --

P: --

U.S. NY Fed Manufacturing Prices Received Index (Dec)

A:--

F: --

P: --

U.S. NY Fed Manufacturing New Orders Index (Dec)

A:--

F: --

P: --

Canada Manufacturing New Orders MoM (Oct)

A:--

F: --

P: --

Canada Core CPI MoM (Nov)

A:--

F: --

P: --

Canada Trimmed CPI YoY (SA) (Nov)

A:--

F: --

P: --

Canada Manufacturing Inventory MoM (Oct)

A:--

F: --

P: --

Canada CPI YoY (Nov)

A:--

F: --

P: --

Canada CPI MoM (Nov)

A:--

F: --

P: --

Canada CPI YoY (SA) (Nov)

A:--

F: --

P: --

Canada Core CPI MoM (SA) (Nov)

A:--

F: --

P: --

Canada CPI MoM (SA) (Nov)

A:--

F: --

P: --

Federal Reserve Board Governor Milan delivered a speech
U.S. NAHB Housing Market Index (Dec)

--

F: --

P: --

Australia Composite PMI Prelim (Dec)

--

F: --

P: --

Australia Services PMI Prelim (Dec)

--

F: --

P: --

Australia Manufacturing PMI Prelim (Dec)

--

F: --

P: --

Japan Manufacturing PMI Prelim (SA) (Dec)

--

F: --

P: --

U.K. 3-Month ILO Employment Change (Oct)

--

F: --

P: --

U.K. Unemployment Claimant Count (Nov)

--

F: --

P: --

U.K. Unemployment Rate (Nov)

--

F: --

P: --

U.K. 3-Month ILO Unemployment Rate (Oct)

--

F: --

P: --

U.K. Average Weekly Earnings (3-Month Average, Including Bonuses) YoY (Oct)

--

F: --

P: --

U.K. Average Weekly Earnings (3-Month Average, Excluding Bonuses) YoY (Oct)

--

F: --

P: --

France Services PMI Prelim (Dec)

--

F: --

P: --

France Composite PMI Prelim (SA) (Dec)

--

F: --

P: --

France Manufacturing PMI Prelim (Dec)

--

F: --

P: --

Germany Services PMI Prelim (SA) (Dec)

--

F: --

P: --

Germany Manufacturing PMI Prelim (SA) (Dec)

--

F: --

P: --

Germany Composite PMI Prelim (SA) (Dec)

--

F: --

P: --

Euro Zone Composite PMI Prelim (SA) (Dec)

--

F: --

P: --

Euro Zone Services PMI Prelim (SA) (Dec)

--

F: --

P: --

Euro Zone Manufacturing PMI Prelim (SA) (Dec)

--

F: --

P: --

U.K. Services PMI Prelim (Dec)

--

F: --

P: --

U.K. Manufacturing PMI Prelim (Dec)

--

F: --

P: --

U.K. Composite PMI Prelim (Dec)

--

F: --

P: --

Euro Zone ZEW Economic Sentiment Index (Dec)

--

F: --

P: --

Germany ZEW Current Conditions Index (Dec)

--

F: --

P: --

Germany ZEW Economic Sentiment Index (Dec)

--

F: --

P: --

Euro Zone Trade Balance (Not SA) (Oct)

--

F: --

P: --

Euro Zone ZEW Current Conditions Index (Dec)

--

F: --

P: --

Euro Zone Trade Balance (SA) (Oct)

--

F: --

P: --

U.S. Retail Sales MoM (Excl. Automobile) (SA) (Oct)

--

F: --

P: --

Q&A with Experts
    • All
    • Chatrooms
    • Groups
    • Friends
    Connecting
    .
    .
    .
    Type here...
    Add Symbol or Code

      No matching data

      All
      Trump Updates
      Recommend
      Stocks
      Cryptocurrencies
      Central Banks
      Featured News
      • All
      • Russia-Ukraine Conflict
      • Middle East Flashpoint
      • All
      • Russia-Ukraine Conflict
      • Middle East Flashpoint
      Search
      Products

      Charts Free Forever

      Chats Q&A with Experts
      Screeners Economic Calendar Data Tools
      Membership Features
      Data Warehouse Market Trends Institutional Data Policy Rates Macro

      Market Trends

      Market Sentiment Order Book Forex Correlations

      Top Indicators

      Charts Free Forever
      Markets

      News

      News Analysis 24/7 Columns Education
      From Institutions From Analysts
      Topics Columnists

      Latest Views

      Latest Views

      Trending Topics

      Top Columnists

      Latest Update

      Signals

      Copy Rankings Latest Signals Become a signal provider AI Rating
      Contests
      Brokers

      Overview Brokers Assessment Rankings Regulators News Claims
      Broker listing Forex Brokers Comparison Tool Live Spread Comparison Scam
      Q&A Complaint Scam Alert Videos Tips to Detect Scam
      More

      Business
      Events
      Careers About Us Advertising Help Center

      White Label

      Data API

      Web Plug-ins

      Affiliate Program

      Awards Institution Evaluation IB Seminar Salon Event Exhibition
      Vietnam Thailand Singapore Dubai
      Fans Party Investment Sharing Session
      FastBull Summit BrokersView Expo
      Recent Searches
        Top Searches
          Markets
          News
          Analysis
          User
          24/7
          Economic Calendar
          Education
          Data
          • Names
          • Latest
          • Prev

          View All

          No data

          Scan to Download

          Faster Charts, Chat Faster!

          Download App
          English
          • English
          • Español
          • العربية
          • Bahasa Indonesia
          • Bahasa Melayu
          • Tiếng Việt
          • ภาษาไทย
          • Français
          • Italiano
          • Türkçe
          • Русский язык
          • 简中
          • 繁中
          Open Account
          Search
          Products
          Charts Free Forever
          Markets
          News
          Signals

          Copy Rankings Latest Signals Become a signal provider AI Rating
          Contests
          Brokers

          Overview Brokers Assessment Rankings Regulators News Claims
          Broker listing Forex Brokers Comparison Tool Live Spread Comparison Scam
          Q&A Complaint Scam Alert Videos Tips to Detect Scam
          More

          Business
          Events
          Careers About Us Advertising Help Center

          White Label

          Data API

          Web Plug-ins

          Affiliate Program

          Awards Institution Evaluation IB Seminar Salon Event Exhibition
          Vietnam Thailand Singapore Dubai
          Fans Party Investment Sharing Session
          FastBull Summit BrokersView Expo

          Euro Weakness Vs. Dollar Strength: Nonfarm Payrolls May Trigger EURUSD Move

          Samantha Luan

          Economic

          Forex

          Technical Analysis

          Summary:

          Ahead of fundamental data releases from the eurozone and the US, the EURUSD pair may test the 1.1750 level. Discover more in our analysis for 5 September 2025.

          Ahead of fundamental data releases from the eurozone and the US, the EURUSD pair may test the 1.1750 level. Discover more in our analysis for 5 September 2025.

          EURUSD forecast: key trading points

          ● Eurozone Q2 GDP: previously at 0.1%, projected at 0.1%
          ● US Nonfarm Payrolls: previously at 73 thousand, projected at 75 thousand
          ● EURUSD forecast for 5 September 2025: 1.1750

          Fundamental analysis

          GDP is the total value of all goods and services produced in the country, calculated based on final output excluding raw materials.The forecast for 5 September 2025 does not appear optimistic, suggesting that eurozone GDP may remain at 0.1%. If the actual reading is equal to or below expectations, it may negatively affect the euro and trigger a correction in the EURUSD rate.

          According to the forecast for 5 September 2025, US Nonfarm Payrolls may increase to 75 thousand from 73 thousand in the previous period. If actual results match expectations, markets may see increased volatility and temporary US dollar strength. The release of Nonfarm Payrolls almost always stirs market activity and can either support the US dollar or cause it to lose ground.Today’s EURUSD forecast also takes into account that the US unemployment rate for August may rise to 4.3% from 4.2% previously.

          EURUSD technical analysis

          On the H4 chart, the EURUSD pair formed an Inverted Hammer reversal pattern near the lower Bollinger Band. At this stage, it continues to develop an upward wave in line with the signal. Since the pair remains within an ascending channel, it still has chances for growth towards the nearest resistance level at 1.1750. A breakout above this resistance would open the way for further upward momentum.

          At the same time, the EURUSD rate could correct towards 1.1625 before resuming growth.

          Summary

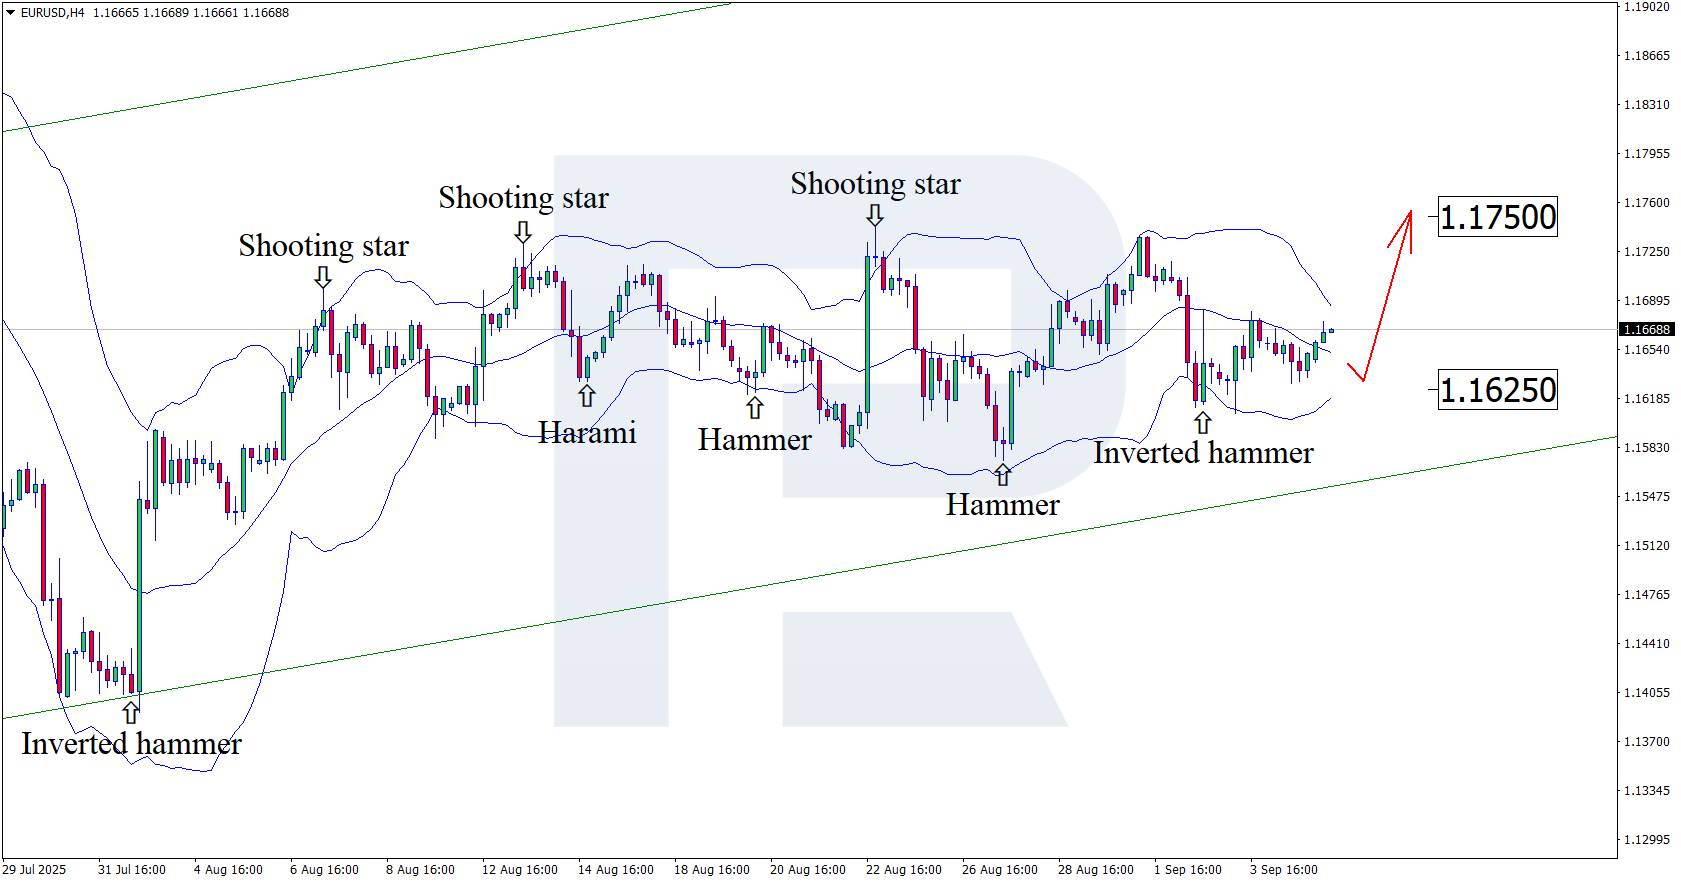
          Today’s EURUSD forecast favours the USD, as eurozone data may weaken the euro. However, EURUSD technical analysis suggests potential growth towards the 1.1750 resistance level.

          Source: RoboForex

          To stay updated on all economic events of today, please check out our Economic calendar
          Risk Warnings and Disclaimers
          You understand and acknowledge that there is a high degree of risk involved in trading. Following any strategies or investment methods may lead to potential losses. The content on the site is provided by our contributors and analysts for information purposes only. You are solely responsible for determining whether any trading assets, securities, strategy, or any other product is suitable for investing based on your own investment objectives and financial situation.
          Add to Favorites
          Share

          US Job Growth Expected to Weaken in August as Tariffs and Immigration Curbs Tighten Labor Market

          Gerik

          Economic

          Anticipated Weak Jobs Report Raises Policy Stakes

          Economists expect Friday’s Labor Department report to show 75,000 new jobs in August, a slight uptick from July’s 73,000 but far below historical averages. Unemployment is projected to rise to 4.3%. This slowdown, if confirmed, would reinforce the case for a rate cut at the Fed’s September 16–17 policy meeting. Fed Chair Jerome Powell has already acknowledged the labor market’s fragility while balancing concerns about persistent inflation.
          The moderation reflects a causal chain: President Donald Trump’s tariffs have disrupted corporate planning and dampened hiring, while immigration restrictions have constrained labor supply. These factors together are reducing job creation even as demand for workers remains fragile.

          Revisions and Trust in Labor Statistics Under Scrutiny

          Attention is also turning to potential revisions of recent payroll data. Earlier this summer, sharp downgrades erased 258,000 jobs from May and June totals, sparking Trump’s ire and his dismissal of BLS Commissioner Erika McEntarfer. Economists attributed the revisions to the “birth-and-death” model, which estimates net job creation from business openings and closures. Because this method is highly imputed, revisions are often substantial.
          Preliminary benchmark revisions next week could reduce employment figures by as much as 800,000 for the year ending March, based on Quarterly Census of Employment and Wages data. This raises questions about data reliability just as Trump nominates Heritage Foundation economist E.J. Antoni to lead the BLS, a choice widely criticized as politically motivated. The correlation here is critical: political interference may not directly change employment dynamics, but it could undermine confidence in reported data, affecting market expectations and policy responses.

          Labor Force Shrinks Amid Immigration Crackdown

          The labor force declined by 800,000 in the second quarter, attributed to immigration raids and the termination of temporary legal status for many workers. This shrinking pool not only constrains job growth but also masks a sharper rise in unemployment that might otherwise occur. Economists estimate the US needs to generate 50,000–75,000 jobs monthly to match working-age population growth, placing August’s forecast barely at sustainability levels.
          This causal relationship is clear: immigration restrictions reduce labor supply, limiting both job creation and the pace at which unemployment rises, while simultaneously creating bottlenecks in industries reliant on immigrant workers.

          Sectoral Weaknesses and Additional Pressures

          Job gains remain concentrated in healthcare and social assistance, though even this sector showed a decline in job openings for the second consecutive month. Manufacturing is likely to be hit by tariffs and a strike involving 3,200 Boeing workers, while federal payrolls continue to shrink under White House spending cuts.
          Economists such as Veronica Clark at Citigroup warn that layoffs are an underappreciated risk, suggesting labor demand may weaken further through the year. This reflects both causal and correlational dynamics: tariffs and strikes directly suppress manufacturing employment, while weakening confidence and tighter fiscal policy indirectly correlate with slower hiring across other sectors.
          The anticipated August jobs report highlights the fragility of US labor conditions. With tariffs dampening corporate sentiment, immigration restrictions shrinking the workforce, and revisions clouding trust in official data, the outlook for sustained job growth is dim. Unless hiring rebounds significantly, the Fed faces mounting pressure to cut rates, even as inflation concerns linger. For markets, the report will serve as both a confirmation of weakening fundamentals and a pivotal signal for monetary policy in the months ahead.

          Source: Reuters

          To stay updated on all economic events of today, please check out our Economic calendar
          Risk Warnings and Disclaimers
          You understand and acknowledge that there is a high degree of risk involved in trading. Following any strategies or investment methods may lead to potential losses. The content on the site is provided by our contributors and analysts for information purposes only. You are solely responsible for determining whether any trading assets, securities, strategy, or any other product is suitable for investing based on your own investment objectives and financial situation.
          Add to Favorites
          Share

          Portugal’s Cork Industry Celebrates Rare Tariff Exemption Under US Trade Policy

          Gerik

          Economic

          Cork Carves Out a Tariff Exemption

          Amid sweeping 15% US tariffs on European Union imports, cork emerged as one of the few natural products to win a reprieve. Classified as an “unavailable natural product” in the US-EU trade agreement effective September 1, cork joins a short list of exemptions that includes airplanes and generic pharmaceuticals. For Portugal, the world’s largest cork producer responsible for about half of global supply, the carve-out represents a major diplomatic and economic victory.
          The exemption is the direct result of lobbying by Portuguese officials and industry advocates. Patrick Spencer, executive director of the US-based Natural Cork Council, worked alongside California vintners and the Wine Institute to persuade US trade officials of cork’s unique status. Their efforts highlight a causal relationship between organized industry advocacy and successful tariff negotiation outcomes.

          Portugal’s Global Cork Leadership

          Portugal exports cork to over 100 countries, with the US its second-largest market after France. In 2023, the US imported $241 million worth of cork from Portugal, more than 70% of which was wine stoppers and closures for spirits, olive oil, and honey. Beyond the wine industry, cork has specialized uses in aerospace, sports fields, and even airport runways due to its heat resistance and shock absorption.
          The endurance of Portugal’s cork sector rests on centuries-old harvesting traditions. Companies like Corticeira Amorim, which manages 20 million cork trees across 700,000 hectares, still rely on highly skilled workers to manually strip bark from trees a process requiring precision to avoid fatal damage. Each tree takes 25 years to produce its first harvestable bark and regenerates every nine years thereafter. These biological and cultural factors explain why cork production remains concentrated in the Mediterranean and cannot easily be replicated in the US, despite a similar climate.

          Sustainability and Consumer Trends

          Cork’s exemption comes at a moment when the material is regaining favor among winemakers. Natural cork is renewable, biodegradable, and aligned with sustainability goals, giving it a competitive advantage over aluminum or plastic closures. In the US, cork closures in premium wines rose from 53% in 2010 to 64.5% in 2022.
          Earlier concerns about “cork taint” caused by fungal contamination once drove wineries toward screw caps. Advances in processing have largely solved that issue, while innovations in screw cap technology allow controlled oxygen intake, mimicking cork’s properties. Yet, cork retains cultural weight in aging wines, with its presence in bottles seen as integral to tradition and authenticity. This blend of heritage and sustainability demonstrates a strong correlation between consumer sentiment and cork’s market resurgence.

          Uncertain Future of US Tariffs

          The permanence of cork’s tariff exemption is not guaranteed. A US appeals court recently ruled that President Trump lacked authority to impose his broad tariffs, though they remain in effect pending appeal to the Supreme Court. Commerce Secretary Howard Lutnick hinted that other natural products, such as mangoes or cocoa, could join cork in future carve-outs.
          While cork is currently protected, the situation illustrates how deeply intertwined natural resource industries are with political negotiations. For Portugal, the exemption not only shields its cork exports but also sets a precedent for future trade diplomacy.
          The cork exemption exemplifies how trade policy, diplomacy, and industry lobbying converge to shape global commerce. For Portugal, it safeguards a flagship export industry and demonstrates the strategic value of specialized, irreplaceable natural products. For US winemakers and consumers, it ensures continued access to a material central to wine culture and sustainability trends. Whether this exemption signals broader tariff flexibility or remains an isolated case will depend on future US trade negotiations and court rulings.

          Source: AP

          To stay updated on all economic events of today, please check out our Economic calendar
          Risk Warnings and Disclaimers
          You understand and acknowledge that there is a high degree of risk involved in trading. Following any strategies or investment methods may lead to potential losses. The content on the site is provided by our contributors and analysts for information purposes only. You are solely responsible for determining whether any trading assets, securities, strategy, or any other product is suitable for investing based on your own investment objectives and financial situation.
          Add to Favorites
          Share

          US Tightens Grip on Foreign Chipmakers in China, Reshaping Global Semiconductor Supply Chains

          Gerik

          Economic

          Washington’s Strategic Leverage in Semiconductor Supply Chains

          Despite being based in Taiwan and South Korea, global chip giants like TSMC, Samsung, and SK Hynix remain highly dependent on US technology. American firms dominate in chip design and essential equipment manufacturing Applied Materials, Lam Research, and KLA supply much of the machinery required for advanced production. The US Commerce Department’s decision to end Biden-era exemptions illustrates this power. Starting next year, the firms must apply for licenses to continue operating in China, though they will not be allowed to expand or upgrade facilities.
          The causal relationship is direct: US restrictions on equipment access could cripple chip plants in China, as production requires continuous machinery upgrades and maintenance. Without timely approvals, disruptions could ripple through the memory chip market, raising global prices.

          Korean Firms Most Vulnerable to Policy Shift

          Samsung and SK Hynix are particularly exposed. Roughly 30% of Samsung’s NAND flash chips and 37% of SK Hynix’s NAND, along with 35% of its DRAM chips, are produced in China. Together, these facilities account for 15% of global NAND supply and 10% of DRAM, making them critical to worldwide electronics production.
          Analysts warn that even with license approvals, the longer-term competitiveness of these Chinese fabs will erode. The likely outcome, as noted by CLSA’s Sanjeev Rana, is that the US wants these firms to redirect capacity to American soil, strengthening domestic supply chains at China’s expense.

          Limited Impact on TSMC, but Strategic Uncertainty Remains

          TSMC faces less risk since only about 3% of its production capacity comes from its Nanjing facility, focused on less advanced chips. While its global expansion into the US, Japan, and Germany continues, 80% of production will remain in Taiwan through 2030. Taiwan’s Ministry of Economic Affairs downplayed the impact, suggesting national competitiveness will remain intact.
          Still, the correlation is noteworthy: while TSMC is less exposed to China directly, prolonged restrictions create uncertainty for cross-border operations and highlight Taiwan’s delicate position within the US-China technology rivalry.

          China’s Domestic Chipmakers May Gain Breathing Space

          Ironically, Washington’s move may strengthen Chinese firms such as ChangXin Memory Technologies (CXMT) and Yangtze Memory Technologies (YMTC). As foreign competitors struggle to upgrade their Chinese fabs, domestic players could seize market share in NAND and DRAM production. This outcome reflects a correlation: although restrictions aim to weaken China’s tech industry, they may accelerate the rise of local firms in specific segments where foreign competition stagnates.
          The export control tightening also echoes recent precedent. Nvidia and AMD agreed to pay the US government 15% of their China revenues in exchange for export licenses, a deal analysts believe could foreshadow similar arrangements for Samsung and SK Hynix. Troy Stangarone of Carnegie Mellon Institute for Strategy and Technology suggested that Washington may be moving toward revenue-sharing conditions as a prerequisite for continued access to Chinese markets.
          This signals a causal strategy: the US is not only restricting technology flows but also extracting direct economic rents from firms caught between its regulations and China’s vast market demand.

          Beijing’s Response and the Geopolitical Outlook

          China’s Ministry of Commerce condemned the decision, urging the US to “correct its wrongdoing” and pledging countermeasures to protect Chinese enterprises. While details remain vague, Beijing’s opposition underscores the geopolitical stakes: Washington’s policy is both a tool of economic statecraft and a catalyst for Beijing’s self-sufficiency drive.
          The US export control shift exemplifies how Washington wields its dominance in chip design and equipment to pressure foreign companies operating in China. Korean firms face the greatest vulnerability due to their reliance on Chinese fabs, while TSMC appears insulated but not immune to broader uncertainty. Over time, this could accelerate the migration of high-tech manufacturing capacity out of China, while paradoxically providing opportunities for Chinese challengers to expand in a protected domestic space.
          The semiconductor conflict has therefore become not only a contest between the US and China but also a restructuring of global supply chains, where foreign champions must constantly navigate Washington’s demands, Beijing’s push for independence, and the realities of market economics.

          Source: CNN

          To stay updated on all economic events of today, please check out our Economic calendar
          Risk Warnings and Disclaimers
          You understand and acknowledge that there is a high degree of risk involved in trading. Following any strategies or investment methods may lead to potential losses. The content on the site is provided by our contributors and analysts for information purposes only. You are solely responsible for determining whether any trading assets, securities, strategy, or any other product is suitable for investing based on your own investment objectives and financial situation.
          Add to Favorites
          Share

          Japan Commits to $7 Billion US Energy Purchases, Eyes Alaskan LNG in Trade Deal

          Gerik

          Economic

          Energy Purchases Anchor Bilateral Agreement

          Japan has reaffirmed its commitment to import $7 billion worth of US energy annually, a key element in the trade deal unveiled Friday. The joint statement highlights Tokyo’s interest in securing liquefied natural gas (LNG) from Alaska, signaling a diversification of its supply sources amid heightened global energy competition.
          The causal link between geopolitical uncertainty and Japan’s energy policy is evident. By locking in US supplies, Japan seeks both energy security and political alignment, mitigating vulnerabilities from Middle Eastern disruptions and Russia’s curtailed energy flows. For Washington, the deal underscores its strategy of leveraging energy exports to reinforce trade and security partnerships.

          Tariff Concessions Reinforce Economic Cooperation

          In exchange, the US pledged to apply its lowest tariff rates to Japanese pharmaceuticals and semiconductors. These reductions are designed to ease Japanese access to critical US markets, particularly in sectors where Japan retains global competitiveness. The correlation between tariff relief and industrial cooperation is significant: while the energy deal secures Japan’s resource base, tariff concessions provide reciprocal benefits for its advanced manufacturing exports.
          Japan’s exploration of Alaskan LNG supplies carries broader strategic implications. LNG exports from Alaska would not only diversify Japan’s energy sources but also strengthen the US-Japan alliance in the Indo-Pacific by embedding energy security into the partnership. This reflects a causal relationship between resource flows and strategic stability, reinforcing both nations’ shared interest in countering supply risks from rival powers.
          The agreement highlights how energy trade and tariff policy are being deployed as dual pillars of the US-Japan alliance. For Japan, the deal ensures long-term energy diversification and favorable trade conditions for its industries. For the US, it strengthens political and economic ties with a critical Asian ally while expanding its energy export footprint. The move illustrates how economic agreements increasingly serve both commercial and geopolitical functions in an era of shifting global alliances.

          Source: Reuters

          To stay updated on all economic events of today, please check out our Economic calendar
          Risk Warnings and Disclaimers
          You understand and acknowledge that there is a high degree of risk involved in trading. Following any strategies or investment methods may lead to potential losses. The content on the site is provided by our contributors and analysts for information purposes only. You are solely responsible for determining whether any trading assets, securities, strategy, or any other product is suitable for investing based on your own investment objectives and financial situation.
          Add to Favorites
          Share

          Australia and Japan Strengthen Security and Economic Ties Amid Waning US Reliability

          Gerik

          Economic

          Warship Deal Marks a New Chapter in Security Cooperation

          Australia’s decision to acquire 11 Japanese-built warships represents a turning point in bilateral defense ties. This is the first time Tokyo will export cutting-edge weapons systems while sharing classified defense technology, underscoring a level of trust previously reserved for treaty allies. The deal carries both military and economic implications, as Japanese firms plan to establish local operations to construct most of the vessels.
          The causal link is clear: as US defense commitments become less predictable under President Donald Trump, Canberra and Tokyo are compelled to diversify their security guarantees. Strengthening bilateral arrangements helps both nations hedge against uncertainty while maintaining deterrence capabilities in the Indo-Pacific.

          Policy Foundations for Deeper Military Integration

          This growing alignment builds on the 2023 Reciprocal Access Agreement, which allows troop deployments to each other’s territories Japan’s first defense pact beyond its 1960 alliance with Washington. The agreement has since been mirrored with the UK and the Philippines, signaling Tokyo’s broader strategy of expanding defense partnerships.
          More recently, Japan and Australia announced a new pact to evacuate each other’s citizens during third-country conflicts. Both sides also confirmed commitments to strengthen deterrence jointly and trilaterally with the US. These arrangements highlight a correlation: even as trust in Washington weakens, the US remains a core player in the triangular framework, albeit one now balanced by stronger intra-ally ties.

          Shifting Balance of Power in the Indo-Pacific

          China’s expanding naval and missile capabilities continue to drive regional anxiety. President Xi Jinping’s military parade showcased advanced hardware, while Chinese live-fire drills off Australia’s coast earlier this year rattled Canberra. The threat perceptions of Tokyo and Canberra converge around Beijing’s assertiveness, though analysts note their geographical circumstances differ.
          Sam Roggeveen of the Lowy Institute points out that the threats China poses to Japan are more immediate than those to Australia, given proximity. This indicates a limitation: while strategic alignment is strong, the intensity of perceived threats varies, creating potential divergence in the depth of cooperation.

          US Pressure Forces Allies to Shoulder More

          President Trump has demanded higher defense contributions from Japan and South Korea, while raising doubts about the Aukus pact that underpins Australia’s nuclear submarine ambitions. Canberra, in response, plans to raise defense spending from 1.9% of GDP today to 2.4% by 2034, while Japan targets 2% by 2027 from the current 1.4%. These policy adjustments are causally linked to US pressure, as both governments prepare for a security environment where reliance on Washington comes at higher financial and political costs.
          Still, the US remains central. A logistics pact signed in July between the three navies US, Japan, and Australia suggests that the traditional hub-and-spoke alliance model could evolve into a more balanced triangular structure.

          Economic Dimension Reinforces Strategic Alignment

          Beyond defense, Japan and Australia maintain deep economic interdependence. Japan remains one of the largest investors in Australia, with ¥2.5 trillion ($17 billion) in flows last year and nearly the same already in 2025. Bilateral trade dates back to a 1957 commercial treaty and has expanded through the 2015 free-trade deal and shared membership in regional pacts. Japan was instrumental in developing Australia’s LNG and iron ore industries and remains a critical customer for rare earths and energy.
          These economic ties reinforce the strategic partnership. As Jan Adams of Australia’s Department of Foreign Affairs and Trade stated, the commitments in both trade and near-alliance defense arrangements are “ironclad.” The correlation here is important: economic trust underpins strategic trust, making both pillars mutually reinforcing.

          Toward a Dual-Layered Alliance System

          The tightening of Australia-Japan ties represents both a reaction to US unpredictability and an adaptation to China’s rise. While the US still provides unmatched nuclear and military power, Canberra and Tokyo are moving toward a dual-layered alliance system anchored in Washington but strengthened by direct bilateral commitments.
          If US policy continues to demand greater self-reliance from allies, the Japan-Australia partnership could evolve into a more autonomous security framework. For now, however, the partnership reflects a pragmatic blend: reliance on American capabilities, combined with growing bilateral trust and economic integration, to manage a volatile Indo-Pacific landscape.

          Source: Bloomberg

          To stay updated on all economic events of today, please check out our Economic calendar
          Risk Warnings and Disclaimers
          You understand and acknowledge that there is a high degree of risk involved in trading. Following any strategies or investment methods may lead to potential losses. The content on the site is provided by our contributors and analysts for information purposes only. You are solely responsible for determining whether any trading assets, securities, strategy, or any other product is suitable for investing based on your own investment objectives and financial situation.
          Add to Favorites
          Share

          China’s Export Growth Expected to Slow as US Tariff Truce Loses Steam

          Gerik

          Economic

          Slowing Momentum After Temporary Boost

          China’s export sector, long a cornerstone of its growth model, is showing signs of slowing momentum. According to a Reuters poll of 23 economists, outbound shipments in August are expected to expand by 5% year-on-year, compared with a stronger 7.2% growth in July. The weaker figure highlights how the temporary relief provided by the August 11 tariff truce with the US is already fading, underscoring the fragility of the arrangement.
          The deceleration is partly tied to a high base effect, as China’s exports surged in August 2024, making this year’s comparison less favorable. This creates a statistical drag rather than a direct causal shock, but combined with structural headwinds, the result is a more modest expansion.

          Impact of US Trade Policy and Tariff Pressures

          The US remains China’s most important export market, once absorbing more than $400 billion annually in Chinese goods. However, President Donald Trump’s erratic trade policy featuring tit-for-tat tariff escalations continues to disrupt China’s export flows. Levies currently stand at 30% on Chinese imports into the US, while Beijing imposes 10% on US goods. Trump has also threatened tariffs as high as 40% on goods deemed transshipped through third countries to evade earlier restrictions.
          This policy mix has caused a sharp drop in container traffic from China to the US. Ship departures fell 24.9% year-on-year in the first half of September, accelerating from a 12.4% decline just a week earlier, according to Citi data. The causal relationship here is clear: higher US tariffs and enforcement threats directly suppress China’s exports to its largest consumer base, forcing producers to scramble for alternative buyers.

          Shifting Export Markets Provide Limited Relief

          Chinese manufacturers are increasingly pivoting to Asia, Africa, and Latin America to offset US losses. However, these markets cannot replicate US consumption power. Analysts note that attempts to replace US demand have created intense competition among exporters, with one factory owner describing the process as a “mad rat race.”
          The shift illustrates a correlation rather than a full substitute: while diversification cushions some losses, it cannot causally restore the scale of demand lost to the US. Consequently, the export slowdown persists despite geographic reorientation.

          Domestic Economy Weighed Down by Structural Weakness

          On the import side, growth is forecast to slow to 3% in August, down from 4.1% in July. The drag reflects deeper domestic structural issues: a prolonged property sector downturn, rising job insecurity, and diminishing returns from earlier consumer stimulus programs. Weak household demand limits the ability of imports to grow, and by extension, reduces the pressure on exporters to import intermediate goods.
          China’s trade surplus is projected to rise modestly to $99.2 billion in August, up from $98.24 billion in July, but still well below June’s $114.7 billion. This signals that while exports remain strong in absolute terms, their contribution to the surplus is softening relative to earlier peaks.

          Policy Options and Constraints

          Analysts are watching closely to see if Beijing will introduce additional fiscal measures in the fourth quarter to stabilize growth. However, signs suggest policymakers are reluctant to deploy aggressive support. For instance, the flagship “cash-for-clunkers” program has run out of funds in several provinces, yet the central government has not rushed to replenish them. This restraint reflects a balancing act between short-term growth needs and longer-term concerns over fiscal discipline.
          China’s export slowdown highlights both external and internal challenges. US tariffs exert a direct causal drag on shipments, while weak domestic demand and structural imbalances create a reinforcing effect. Diversification into emerging markets offers partial relief but cannot replace the consumption scale of the US. Unless trade tensions ease or domestic stimulus ramps up, China’s export-led growth model faces sustained pressure, leaving policymakers with limited room to maneuver as they attempt to stabilize the economy in the months ahead.

          Source: Reuters

          To stay updated on all economic events of today, please check out our Economic calendar
          Risk Warnings and Disclaimers
          You understand and acknowledge that there is a high degree of risk involved in trading. Following any strategies or investment methods may lead to potential losses. The content on the site is provided by our contributors and analysts for information purposes only. You are solely responsible for determining whether any trading assets, securities, strategy, or any other product is suitable for investing based on your own investment objectives and financial situation.
          Add to Favorites
          Share
          FastBull
          Copyright © 2025 FastBull Ltd

          728 RM B 7/F GEE LOK IND BLDG NO 34 HUNG TO RD KWUN TONG KLN HONG KONG

          TelegramInstagramTwitterfacebooklinkedin
          App Store Google Play Google Play
          Products
          Charts

          Chats

          Q&A with Experts
          Screeners
          Economic Calendar
          Data
          Tools
          Membership
          Features
          Function
          Markets
          Copy Trading
          Latest Signals
          Contests
          News
          Analysis
          24/7
          Columns
          Education
          Company
          Careers
          About Us
          Contact Us
          Advertising
          Help Center
          Feedback
          User Agreement
          Privacy Policy
          Business

          White Label

          Data API

          Web Plug-ins

          Poster Maker

          Affiliate Program

          Risk Disclosure

          The risk of loss in trading financial instruments such as stocks, FX, commodities, futures, bonds, ETFs and crypto can be substantial. You may sustain a total loss of the funds that you deposit with your broker. Therefore, you should carefully consider whether such trading is suitable for you in light of your circumstances and financial resources.

          No decision to invest should be made without thoroughly conducting due diligence by yourself or consulting with your financial advisors. Our web content might not suit you since we don't know your financial conditions and investment needs. Our financial information might have latency or contain inaccuracy, so you should be fully responsible for any of your trading and investment decisions. The company will not be responsible for your capital loss.

          Without getting permission from the website, you are not allowed to copy the website's graphics, texts, or trademarks. Intellectual property rights in the content or data incorporated into this website belong to its providers and exchange merchants.

          Not Logged In

          Log in to access more features

          FastBull Membership

          Not yet

          Purchase

          Become a signal provider
          Help Center
          Customer Service
          Dark Mode
          Price Up/Down Colors

          Log In

          Sign Up

          Position
          Layout
          Fullscreen
          Default to Chart
          The chart page opens by default when you visit fastbull.com