• Trade
  • Markets
  • Copy
  • Contests
  • 24/7
  • Calendar
  • Q&A
  • Chats
Screeners
SYMBOL
LAST
BID
ASK
HIGH
LOW
NET CHG.
%CHG.
SPREAD
SOURCE
SPX
S&P 500 Index
7757.17
7757.17
7757.17
7770.40
7709.34
+44.60
+ 0.58%
--
--
DJI
Dow Jones Industrial Average
52856.09
52856.09
52856.09
52860.11
52392.28
+360.21
+ 0.69%
--
--
IXIC
NASDAQ Composite Index
26702.85
26702.85
26702.85
26778.90
26507.07
+278.04
+ 1.05%
--
--
USDX
US Dollar Index
101.340
101.340
101.420
101.530
101.290
-0.130
-0.13%
--
--
EURUSD
Euro / US Dollar
1.12479
1.12479
1.12488
1.12557
1.12246
+0.00174
+ 0.15%
--
--
GBPUSD
Pound Sterling / US Dollar
1.34037
1.34037
1.34049
1.34079
1.33811
+0.00117
+ 0.09%
--
--
XAUUSD
Gold / US Dollar
4094.92
4094.92
4095.37
4143.35
4094.87
-45.97
-1.11%
--
--
WTI
Light Sweet Crude Oil
97.996
97.996
98.031
98.104
97.354
+0.614
+ 0.63%
--
--

Community Accounts

Signal Accounts
--
Profit Accounts
--
Loss Accounts
--
View More

Become a signal provider

Sell trading signals to earn additional income

View More

Guide to Copy Trading

Get started with ease and confidence

View More

Signal Accounts for Members

All Signal Accounts

Best Return
  • Best Return
  • Best P/L
  • Best MDD
Past 1W
  • Past 1W
  • Past 1M
  • Past 1Y

All Contests

  • All
  • Recommend
  • Stocks
  • Cryptocurrencies
  • Central Banks
  • Trump Updates
  • Featured News
Top News Only
Share

The Most Active Palladium Futures Contract Fell 4% Intraday, Currently Trading At 248.40 Yuan

Share

Glassnode: Bitcoin Is In A Strong "box" Constraint, And The Market Will Focus On Important Catalyst Events

Share

Spot Gold Prices Fell 1.08% To $4,096.58 Per Ounce; Spot Silver Prices Fell 2.71% To $56.38 Per Ounce

Share

Spot Gold Fell Below $4,100 Per Ounce, Down 1.08% On The Day

Share

Local Officials Say Drones Attacked Energy Infrastructure In Krymenchuk, Poltava Region Of Ukraine

Share

New York Gold Futures Fell Below $4,120 Per Ounce, Down 0.79% On The Day

Share

The Most Active Fuel Oil Futures Contract Rose 2% Intraday, Currently Trading At 4893.00 Yuan

Share

New York Silver Futures Fell 2.00% On The Day, Currently Trading At $56.56 Per Ounce

Share

The Caustic Soda 2702 Contract Hit Its Daily Limit Down, Falling 7% To 1580 Yuan/ton; The Most Active 2701 Contract Fell Nearly 6% To 1602 Yuan/ton

Share

Kim Yo-jong Warned South Korea Against Interfering With North Korea's Normal Border Construction Projects

Share

A Russian Nighttime Attack In Kyiv, Ukraine, Injured 15 People

Share

Venezuela's Ruling Party Condemned The U.S. For Issuing An Arrest Warrant For Raul Castro

Share

The Governor Of The Bank Of Korea Said That The Inflation Target May Be Achieved In 2028

Share

Shin Hyun-song: Pay Attention To The Bond Market's Forecast Of Terminal Interest Rates

Share

Shin Hyun-song: We May Not Need To Follow The Final Policy Interest Rate Level Expected By The Financial Markets

Share

Hubei's GDP Grew By 4.7% Year-on-Year In The First Three Quarters Of 2026

Share

Bank Of Korea Governor Shin Hyun-song: Long-term Implementation Of Fuel Price Caps Could Affect The Fiscal Situation

Share

The Governor Of The Bank Of Korea Said That South Korea Is In The "early Stage" Of The Internationalization Of The Korean Won

Share

Coking Coal Futures Contract 2701 Weakened During The Session, With The Decline Widening To 2.08%, And Last Quoted At 1904.5 Yuan/ton; The Trading Volume Was Approximately 4.504 Billion Yuan, With More Than 1,400 Lots Of Open Interest Decreasing During The Day, And Open Interest Slightly Declining

Share

Bank Of Korea Governor Shin Hyun-song: Chip Prices Show No Signs Of Falling And May Rise Further

TIME
ACT
FCST
PREV
IMPACT
U.K. Input PPI YoY (Not SA) (Sept)

A:--

F: --

P: --
GBPUSD
  • GBPUSD
  • XAUUSD
  • XAGUSD
  • WTI
  • USDX
U.K. Output PPI YoY (Not SA) (Sept)

A:--

F: --

P: --
GBPUSD
  • GBPUSD
  • XAUUSD
  • XAGUSD
  • WTI
  • USDX
U.K. Output PPI MoM (Not SA) (Sept)

A:--

F: --

P: --

GBPUSD
  • GBPUSD
  • XAUUSD
  • XAGUSD
  • WTI
  • USDX
U.K. Core CPI YoY (Sept)

A:--

F: --

P: --

GBPUSD
  • GBPUSD
  • XAUUSD
  • XAGUSD
  • WTI
  • USDX
U.K. Core CPI MoM (Sept)

A:--

F: --

P: --

GBPUSD
  • GBPUSD
  • XAUUSD
  • XAGUSD
  • WTI
  • USDX
U.K. Core Retail Prices Index YoY (Sept)

A:--

F: --

P: --

GBPUSD
  • GBPUSD
  • XAUUSD
  • XAGUSD
  • WTI
  • USDX
U.K. Retail Prices Index YoY (Sept)

A:--

F: --

P: --

GBPUSD
  • GBPUSD
  • XAUUSD
  • XAGUSD
  • WTI
  • USDX
U.K. CPI MoM (Sept)

A:--

F: --

P: --

GBPUSD
  • GBPUSD
  • XAUUSD
  • XAGUSD
  • WTI
  • USDX
U.K. Retail Prices Index MoM (Sept)

A:--

F: --

P: --

GBPUSD
  • GBPUSD
  • XAUUSD
  • XAGUSD
  • WTI
  • USDX
U.K. CPI YoY (Sept)

A:--

F: --

P: --

GBPUSD
  • GBPUSD
  • XAUUSD
  • XAGUSD
  • WTI
  • USDX
Indonesia Deposit Facility Rate (Oct)

A:--

F: --

P: --

XAUUSD
  • XAUUSD
  • XAGUSD
  • WTI
  • USDX
Indonesia Lending Facility Rate (Oct)

A:--

F: --

P: --

XAUUSD
  • XAUUSD
  • XAGUSD
  • WTI
  • USDX
Indonesia Loan Growth YoY (Sept)

A:--

F: --

P: --

XAUUSD
  • XAUUSD
  • XAGUSD
  • WTI
  • USDX
Indonesia 7-Day Reverse Repo Rate

A:--

F: --

P: --

XAUUSD
  • XAUUSD
  • XAGUSD
  • WTI
  • USDX
Turkey Capacity Utilization (Oct)

A:--

F: --

P: --

XAUUSD
  • XAUUSD
  • XAGUSD
  • WTI
  • USDX
South Africa Core CPI YoY (Sept)

A:--

F: --

P: --

XAUUSD
  • XAUUSD
  • XAGUSD
  • WTI
  • USDX
South Africa CPI YoY (Sept)

A:--

F: --

P: --

XAUUSD
  • XAUUSD
  • XAGUSD
  • WTI
  • USDX
U.S. MBA Mortgage Application Activity Index WoW

A:--

F: --

P: --

USDX
  • USDX
  • XAUUSD
  • XAGUSD
  • WTI
South Africa Retail Sales YoY (Aug)

A:--

F: --

P: --

XAUUSD
  • XAUUSD
  • XAGUSD
  • WTI
  • USDX
Mexico Retail Sales MoM (Aug)

A:--

F: --

P: --

XAUUSD
  • XAUUSD
  • XAGUSD
  • WTI
  • USDX
BOE Gov Bailey Speaks
U.S. EIA Weekly Heating Oil Stock Changes

A:--

F: --

P: --

WTI
  • WTI
  • XAUUSD
  • XAGUSD
  • USDX
U.S. EIA Weekly Crude Oil Imports Changes

A:--

F: --

P: --

WTI
  • WTI
  • XAUUSD
  • XAGUSD
  • USDX
U.S. EIA Weekly Crude Stocks Change

A:--

F: --

P: --

WTI
  • WTI
  • XAUUSD
  • XAGUSD
  • USDX
U.S. EIA Weekly Cushing, Oklahoma Crude Oil Stocks Change

A:--

F: --

P: --

WTI
  • WTI
  • XAUUSD
  • XAGUSD
  • USDX
U.S. EIA Weekly Crude Demand Projected by Production

A:--

F: --

P: --

WTI
  • WTI
  • XAUUSD
  • XAGUSD
  • USDX
U.S. EIA Weekly Gasoline Stocks Change

A:--

F: --

P: --

WTI
  • WTI
  • XAUUSD
  • XAGUSD
  • USDX
Russia PPI MoM (Sept)

A:--

F: --

P: --

WTI
  • WTI
  • XAUUSD
  • XAGUSD
  • USDX
Russia PPI YoY (Sept)

A:--

F: --

P: --

WTI
  • WTI
  • XAUUSD
  • XAGUSD
  • USDX
ECB President Lagarde Speaks
South Korea Benchmark Interest Rate

A:--

F: --

P: --

XAUUSD
  • XAUUSD
  • XAGUSD
  • WTI
  • USDX
Turkey Consumer Confidence Index (Oct)

--

F: --

P: --

U.K. CBI Industrial Prices Expectations (Oct)

--

F: --

P: --

U.K. CBI Industrial Trends - Orders (Oct)

--

F: --

P: --

Turkey Late Liquidity Window Rate (LON) (Oct)

--

F: --

P: --

Turkey Overnight Lending Rate (O/N) (Oct)

--

F: --

P: --

Turkey 1-Week Repo Rate

--

F: --

P: --

Mexico Unemployment Rate (Not SA) (Sept)

--

F: --

P: --

Canada New Housing Price Index MoM (Sept)

--

F: --

P: --

Canada Industrial Product Price Index YoY (Sept)

--

F: --

P: --

Canada Industrial Product Price Index MoM (Sept)

--

F: --

P: --

U.S. Weekly Initial Jobless Claims (SA)

--

F: --

P: --

U.S. Initial Jobless Claims 4-Week Avg. (SA)

--

F: --

P: --

U.S. Weekly Continued Jobless Claims (SA)

--

F: --

P: --

BOE Gov Bailey Speaks
U.S. Conference Board Coincident Economic Index MoM (Sept)

--

F: --

P: --

U.S. Conference Board Lagging Economic Index MoM (Sept)

--

F: --

P: --

U.S. Conference Board Leading Economic Index (Sept)

--

F: --

P: --

Euro Zone Consumer Confidence Index Prelim (Oct)

--

F: --

P: --

U.S. Conference Board Leading Economic Index MoM (Sept)

--

F: --

P: --

U.S. EIA Weekly Natural Gas Stocks Change

--

F: --

P: --

U.S. Kansas Fed Manufacturing Production Index (Oct)

--

F: --

P: --

U.S. Kansas Fed Manufacturing Composite Index (Oct)

--

F: --

P: --

Argentina Retail Sales YoY (Aug)

--

F: --

P: --

U.S. Weekly Treasuries Held by Foreign Central Banks

--

F: --

P: --

Australia Composite PMI Prelim (Oct)

--

F: --

P: --

Australia Manufacturing PMI Prelim (Oct)

--

F: --

P: --

U.K. GfK Consumer Confidence Index (Oct)

--

F: --

P: --

Japan National Core CPI YoY (Sept)

--

F: --

P: --

Japan National CPI YoY (Sept)

--

F: --

P: --

Japan National CPI MoM (Not SA) (Sept)

--

F: --

P: --

Q&A with Experts
    • All
    • Chatrooms
    • Groups
    • Friends
    zenko flag
    1999kk.king
    今天菜市场里面的人都知道黄金会下到4070然后这已经是公开的数字了我就不看好了
    @1999kk.kingjika tukang sol sepatu sudah mengerti emas.maka keluarlah dari pasar.ambil perdagangan lain.itu pepatah kuno seorang trader.artinya harga akan berbalik arah
    Benjamin Tailor flag
    btc update plz sir
    5870949 flag
    DXY và vàng cùng giảm
    fulltimetrader flag
    黄金今天有机会闪崩,如果做多的散户足够多,很有可能直接一根大阴线吃掉所有订单,瞬间抵达4080
    fulltimetrader flag
    散户的止损单瞬间变成燃料
    fulltimetrader flag
    保证你们做多哭都哭不出来
    fulltimetrader flag
    4097
    fulltimetrader flag
    可能是假突破,多头还有机会
    Mr jimmy flag
    hello guys
    zenko flag
    apakah benar kim jong un meninggal.
    fulltimetrader flag
    没听说啊
    fulltimetrader flag
    啥时候去世的?
    adhi flag
    zenko
    apakah benar kim jong un meninggal.
    @zenkobroo“What is the next move for gold? Is it going up or down?”
    fulltimetrader flag
    不可靠,我搜索不到
    fulltimetrader flag
    @adhi不清楚了,现在变模糊了,刚刚4125附近挺好的机会
    zenko flag
    adhi
    @zenkobroo“What is the next move for gold? Is it going up or down?”
    @adhijam sekarang saya tidak masuk pasar.tapi jika ini perangkap.emas akan naik
    zenko flag
    fulltimetrader
    啥时候去世的?
    @fulltimetraderbarusan masuk berita google
    fulltimetrader flag
    现在给出建议,4090-4080可以看多,现在不要动
    zenko flag
    Mr jimmy
    hello guys
    @Mr jimmy hallo
    zenko flag
    fulltimetrader
    My advice now is to consider buying in the 4090-4080 range, and don't make any moves now.
    @fulltimetraderbenar.kita sudah bahas ini 3 hari berturut turut.titik support 4098.4112.
    Type here...
    Add Symbol or Code

      No matching data

      All
      Recommend
      Stocks
      Cryptocurrencies
      Central Banks
      Trump Updates
      Featured News
      • All
      • Russia-Ukraine Conflict
      • Middle East Flashpoint
      • All
      • Russia-Ukraine Conflict
      • Middle East Flashpoint
      Search
      Products

      Charts Free Forever

      Chats Q&A with Experts
      Screeners Economic Calendar Data Tools
      Membership Features
      Data Warehouse Market Trends Institutional Data Policy Rates Macro

      Market Trends

      Market Sentiment Order Book Forex Correlations

      Top Indicators

      Charts Free Forever
      Markets

      News

      24/7 Analysis Education

      Latest Views

      Latest Update

      Signals

      Copy Rankings Latest Signals Become a signal provider AI Rating
      Contests
      Brokers

      Overview Brokers Assessment Rankings Regulators News Claims
      Broker listing Forex Brokers Comparison Tool Live Spread Comparison Scam
      Q&A Complaint Scam Alert Videos Tips to Detect Scam
      More

      Business
      Events
      Careers About Us Advertising Help Center

      White Label

      Broker API

      Data API

      Web Plug-ins

      Affiliate Program

      Awards Institution Evaluation IB Seminar Salon Event Exhibition
      Vietnam Thailand Singapore Dubai
      Fans Party Investment Sharing Session
      FastBull Summit BrokersView Expo
      Recent Searches
        Top Searches
          Markets
          Analysis
          User
          24/7
          Economic Calendar
          Education
          Data
          • Names
          • Latest
          • Prev

          View All

          No data

          Scan to Download

          Faster Charts, Chat Faster!

          Download
          English
          • English
          • Español
          • العربية
          • Bahasa Indonesia
          • Bahasa Melayu
          • Tiếng Việt
          • ภาษาไทย
          • Français
          • Italiano
          • Türkçe
          • Русский язык
          • 简中
          • 繁中
          Open Account
          Search
          Products
          Charts Free Forever
          Markets
          News
          Signals

          Copy Rankings Latest Signals Become a signal provider AI Rating
          Contests
          Brokers

          Overview Brokers Assessment Rankings Regulators News Claims
          Broker listing Forex Brokers Comparison Tool Live Spread Comparison Scam
          Q&A Complaint Scam Alert Videos Tips to Detect Scam
          More

          Business
          Events
          Careers About Us Advertising Help Center

          White Label

          Broker API

          Data API

          Web Plug-ins

          Affiliate Program

          Awards Institution Evaluation IB Seminar Salon Event Exhibition
          Vietnam Thailand Singapore Dubai
          Fans Party Investment Sharing Session
          FastBull Summit BrokersView Expo

          Ethereum (ETH) Bull Market Over? Shiba Inu (SHIB) Risks Adding Zero Rocket, XRP's Last Level Before $2

          Winkelmann

          Cryptocurrency

          Forex

          Economic

          Summary:

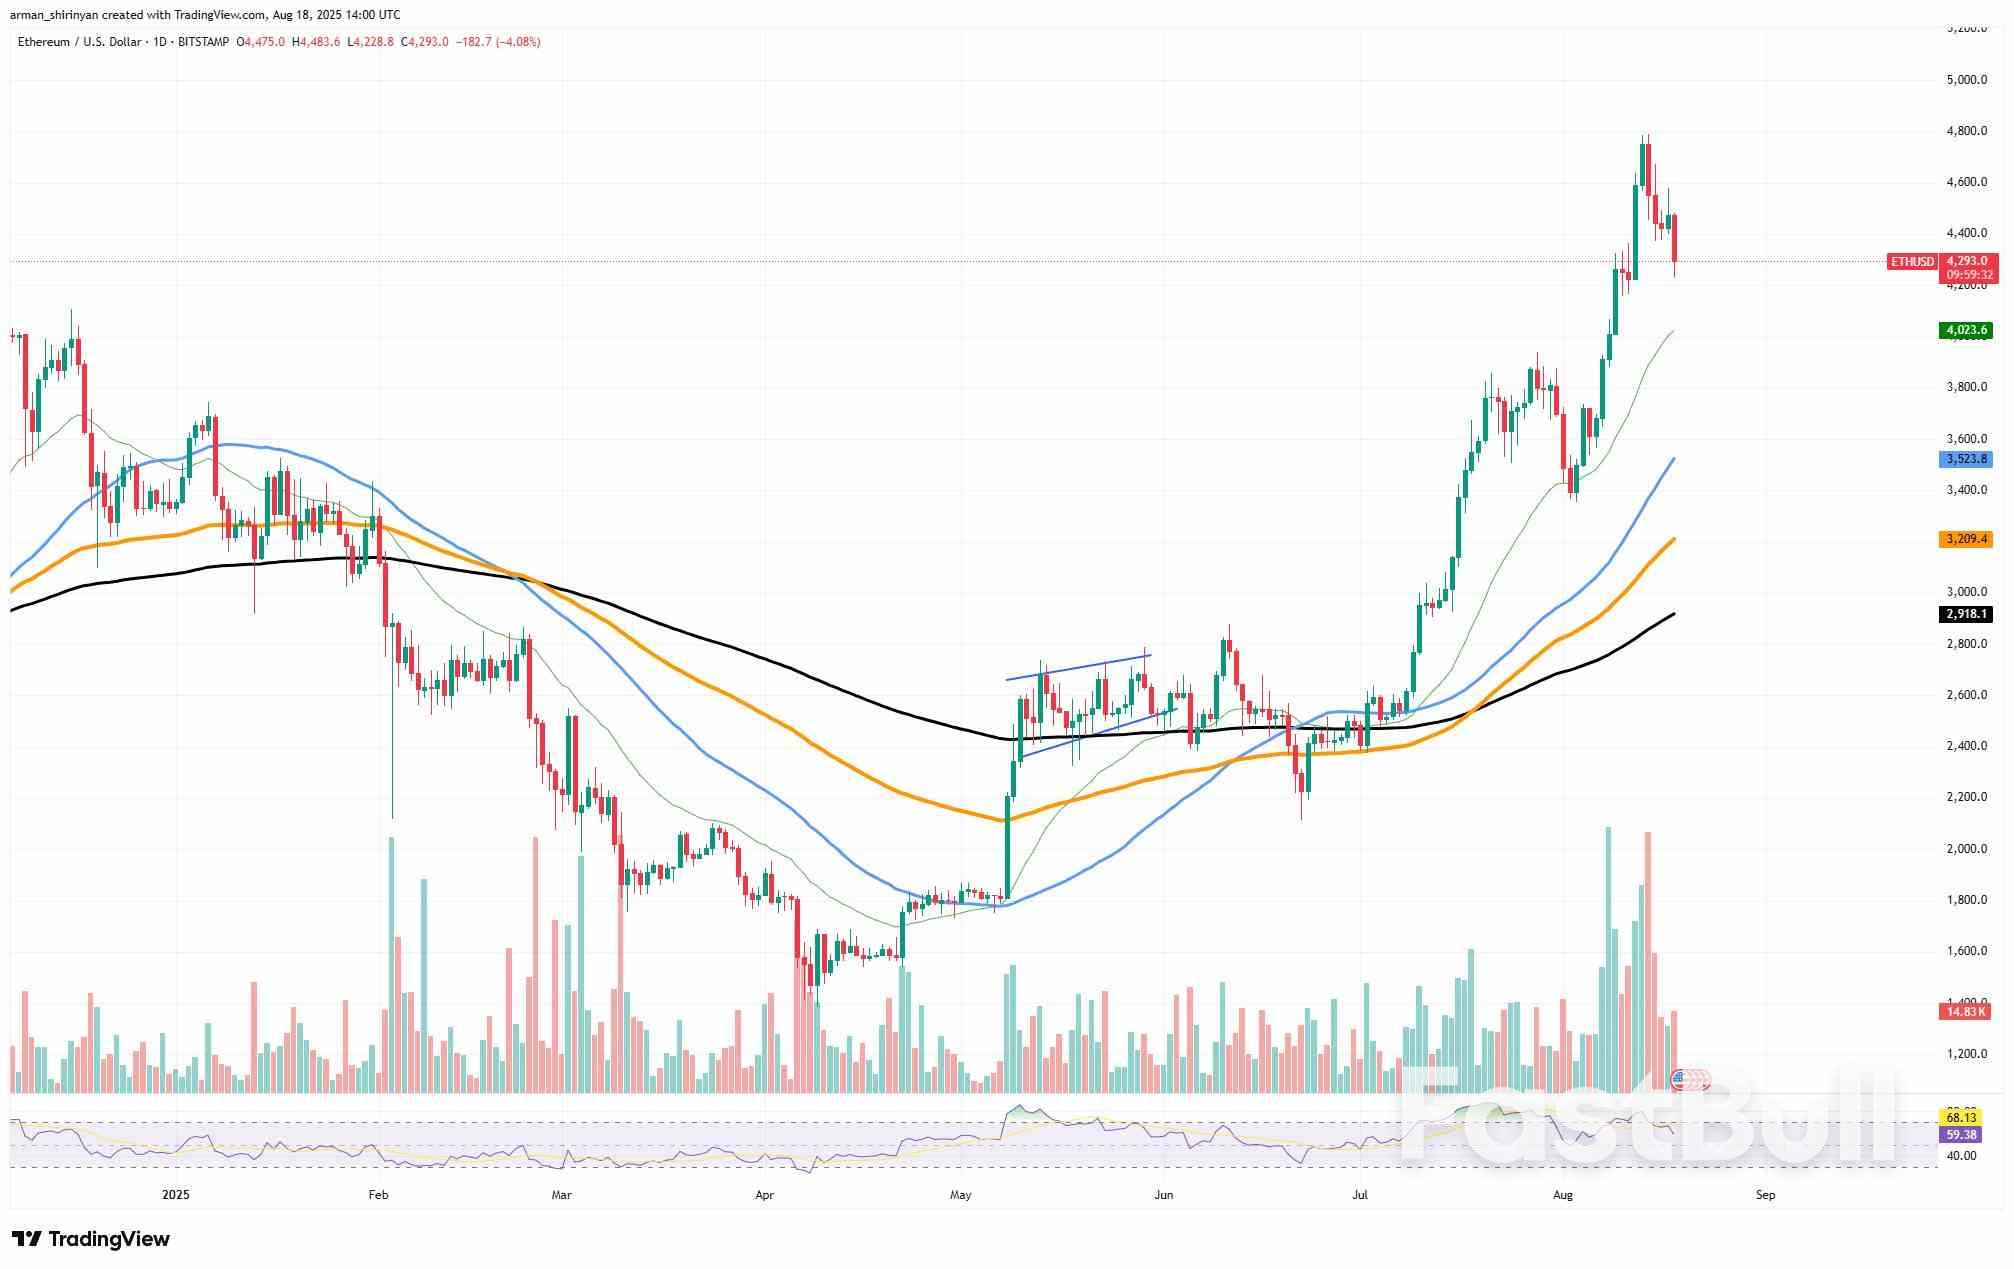
          Ethereum has most likely entered a corrective phase, which could be the beginning of the end of the bull market.

          Ethereum has most likely entered a corrective phase, which could be the beginning of the end of the bull market. Ethereum has been gradually declining after reaching a peak of about $4,800, and the price action is displaying the first discernible signs of weakness since July.

          Given that trading volume has decreased in comparison to earlier in the rally, the decline suggests that market momentum may be waning. Ethereum corrections following sharp rallies have historically tested important moving averages, and the 26-day EMA is currently the first crucial level to keep an eye on. A clean rebound prior to testing this zone would be a more convincing sign that buyers are still in control, but a drop toward this line would indicate a continuation of short-term selling pressure.
          Ethereum (ETH) Bull Market Over? Shiba Inu (SHIB) Risks Adding Zero Rocket, XRP's Last Level Before $2_1ETH/USDT Chart by TradingView'>

          The larger bullish structure would hold up if ETH could bounce back above recent highs, rather than tagging the 26 EMA, indicating that this move is merely a brief cooling off. With the next layers of support located close to the 50 EMA and psychological round levels around $4,000, additional downside may become possible if the 26 EMA breaks decisively.

          The more general question is whether the upward momentum of the cycle will end with this correction. Since long-term moving averages are still sloping upward, and Ethereum is currently trading comfortably above key support lines, it appears that the bull market is still going strong. But as Ethereum continues to decline, traders may grow increasingly wary, particularly as the market closes out derivative positions.

          Shiba Inu at risk

          Shiba Inu is once again close to adding a zero to its price. Following weeks of consolidation within an ascending triangle pattern, SHIB is currently close to losing the lower range, which could lead to more severe declines.The failure of SHIB to produce significant upward momentum is seen clearly on the daily chart. The token is continuing to retest the support line, rather than breaking higher, which indicates a weakening setup, even though the ascending triangle formation typically leans bullish. With today’s rejection, the likelihood of a breakdown is gradually increasing, and each bounce has been weaker than the one before.

          Due to the absence of strong support zones until much lower levels, the move may accelerate rapidly, if SHIB breaks below the triangle’s support. SHIB would most likely be forced to add another zero to its price as a result of such a decline, returning it to valuations not seen since the early summer.Lower trading volumes and the absence of whale-driven support both increase the descending momentum and lessen the likelihood of a recovery. The risk is increased by the fact that SHIB’s performance is still trailing, leading cryptocurrencies like Ethereum and Bitcoin, which have at least maintained stronger trends.

          XRP checks in

          XRP is not feeling that well, as the asset is close to entering a critical state. The token is currently declining and in danger of breaking below its 50-day exponential moving average (EMA) after failing to maintain momentum above $3. Although this level has historically been used as a temporary buffer, the current situation indicates that it might not last for very long.

          As XRP records a string of red candles, the market’s inability to maintain bullish sentiment is putting pressure on the 50 EMA. The next strong support is located much deeper in the $2.70-$2.75 range, and the $2.40 region, which is anchored by the 200 EMA if this level fails. A breakdown of this kind would wipe out most of XRP’s recent gains and expose the token to a possible retest nearer $2.00, a psychological level that will decide whether the larger bullish cycle holds up.

          Curiously, volume data presents a somewhat different picture, even though price action appears fragile. Indicating that bears are not fully committing to the sell-off, trading volumes have been continuously dropping during the downward move. This lack of conviction allows for a potential rebound, but XRP runs the risk of crashing lower toward significant support levels in the absence of an abrupt spike in demand.

          XRP needs to regain the $3.00 mark with significant buying pressure if bulls wish to regain control. If this is not done, there may be a chance for a more severe correction, with $2.00 acting as the final key level before sentiment turns sharply against the asset.

          Source: CryptoSlate

          To stay updated on all economic events of today, please check out our Economic calendar
          Risk Warnings and Disclaimers
          You understand and acknowledge that there is a high degree of risk involved in trading. Following any strategies or investment methods may lead to potential losses. The content on the site is provided by our contributors and analysts for information purposes only. You are solely responsible for determining whether any trading assets, securities, strategy, or any other product is suitable for investing based on your own investment objectives and financial situation.
          Add to Favorites
          Share
          FastBull
          Copyright © 2026 FastBull Ltd

          728 RM B 7/F GEE LOK IND BLDG NO 34 HUNG TO RD KWUN TONG KLN HONG KONG

          TelegramInstagramTwitterfacebooklinkedin
          App Store Google Play Android Windows
          Products
          Charts

          Chats

          Q&A with Experts
          Screeners
          Economic Calendar
          Data
          Tools
          Membership
          Features
          Function
          Markets
          Copy Trading
          Latest Signals
          Contests
          24/7
          Analysis
          Education
          Company
          Careers
          About Us
          Contact Us
          Advertising
          Download FastBull
          Help Center
          Feedback
          User Agreement
          Privacy Policy
          Personal Information Protection Statement
          Business

          White Label

          Broker API

          Data API

          Web Plug-ins

          Poster Maker

          Affiliate Program

          Risk Disclosure

          The risk of loss in trading financial instruments such as stocks, FX, commodities, futures, bonds, ETFs and crypto can be substantial. You may sustain a total loss of the funds that you deposit with your broker. Therefore, you should carefully consider whether such trading is suitable for you in light of your circumstances and financial resources.

          No decision to invest should be made without thoroughly conducting due diligence by yourself or consulting with your financial advisors. Our web content might not suit you since we don't know your financial conditions and investment needs. Our financial information might have latency or contain inaccuracy, so you should be fully responsible for any of your trading and investment decisions. The company will not be responsible for your capital loss.

          Without getting permission from the website, you are not allowed to copy the website's graphics, texts, or trademarks. Intellectual property rights in the content or data incorporated into this website belong to its providers and exchange merchants.

          Not Logged In

          Log in to access more features

          Connect Broker
          Become a signal provider
          Help Center
          Customer Service
          Dark Mode
          Price Up/Down Colors

          Log In

          Sign Up

          Position
          Layout
          Fullscreen
          Default to Chart
          The chart page opens by default when you visit fastbull.com