

Markets
News
Analysis
User
24/7
Economic Calendar
Education
Data
- Names
- Latest
- Prev


Signal Accounts for Members
All Signal Accounts
All Contests
 U.K. Trade Balance Non-EU (SA) (Oct)
A:--
F: --
P: --
U.K. Trade Balance (Oct)A:--
F: --
P: --
U.K. Services Index MoMA:--
F: --
P: --
U.K. Construction Output MoM (SA) (Oct)A:--
F: --
P: --
U.K. Industrial Output YoY (Oct)A:--
F: --
P: --
U.K. Trade Balance (SA) (Oct)A:--
F: --
P: --
U.K. Trade Balance EU (SA) (Oct)A:--
F: --
P: --
U.K. Manufacturing Output YoY (Oct)A:--
F: --
P: --
U.K. GDP MoM (Oct)A:--
F: --
P: --
U.K. GDP YoY (SA) (Oct)A:--
F: --
P: --
U.K. Industrial Output MoM (Oct)A:--
F: --
P: --
U.K. Construction Output YoY (Oct)A:--
F: --
P: --
 France HICP Final MoM (Nov)
A:--
F: --
P: --
 China, Mainland Outstanding Loans Growth YoY (Nov)
A:--
F: --
P: --
China, Mainland M2 Money Supply YoY (Nov)A:--
F: --
P: --
China, Mainland M0 Money Supply YoY (Nov)A:--
F: --
P: --
China, Mainland M1 Money Supply YoY (Nov)A:--
F: --
P: --
 India CPI YoY (Nov)
A:--
F: --
P: --
India Deposit Gowth YoYA:--
F: --
P: --
 Brazil Services Growth YoY (Oct)
A:--
F: --
P: --
 Mexico Industrial Output YoY (Oct)
A:--
F: --
P: --
 Russia Trade Balance (Oct)
A:--
F: --
P: --
 Philadelphia Fed President Henry Paulson delivers a speech
 Canada Building Permits MoM (SA) (Oct)
A:--
F: --
P: --
Canada Wholesale Sales YoY (Oct)A:--
F: --
P: --
Canada Wholesale Inventory MoM (Oct)A:--
F: --
P: --
Canada Wholesale Inventory YoY (Oct)A:--
F: --
P: --
Canada Wholesale Sales MoM (SA) (Oct)A:--
F: --
P: --
 Germany Current Account (Not SA) (Oct)
A:--
F: --
P: --
U.S. Weekly Total Rig CountA:--
F: --
P: --
U.S. Weekly Total Oil Rig CountA:--
F: --
P: --
 Japan Tankan Large Non-Manufacturing Diffusion Index (Q4)
--
F: --
P: --
Japan Tankan Small Manufacturing Outlook Index (Q4)--
F: --
P: --
Japan Tankan Large Non-Manufacturing Outlook Index (Q4)--
F: --
P: --
Japan Tankan Large Manufacturing Outlook Index (Q4)--
F: --
P: --
Japan Tankan Small Manufacturing Diffusion Index (Q4)--
F: --
P: --
Japan Tankan Large Manufacturing Diffusion Index (Q4)--
F: --
P: --
Japan Tankan Large-Enterprise Capital Expenditure YoY (Q4)--
F: --
P: --
U.K. Rightmove House Price Index YoY (Dec)--
F: --
P: --
China, Mainland Industrial Output YoY (YTD) (Nov)--
F: --
P: --
China, Mainland Urban Area Unemployment Rate (Nov)--
F: --
P: --
 Saudi Arabia CPI YoY (Nov)
--
F: --
P: --
 Euro Zone Industrial Output YoY (Oct)
--
F: --
P: --
Euro Zone Industrial Output MoM (Oct)--
F: --
P: --
Canada Existing Home Sales MoM (Nov)--
F: --
P: --
Euro Zone Total Reserve Assets (Nov)--
F: --
P: --
U.K. Inflation Rate Expectations--
F: --
P: --
Canada National Economic Confidence Index--
F: --
P: --
Canada New Housing Starts (Nov)--
F: --
P: --
U.S. NY Fed Manufacturing Employment Index (Dec)--
F: --
P: --
U.S. NY Fed Manufacturing Index (Dec)--
F: --
P: --
Canada Core CPI YoY (Nov)--
F: --
P: --
Canada Manufacturing Unfilled Orders MoM (Oct)--
F: --
P: --
Canada Manufacturing New Orders MoM (Oct)--
F: --
P: --
Canada Core CPI MoM (Nov)--
F: --
P: --
Canada Manufacturing Inventory MoM (Oct)--
F: --
P: --
Canada CPI YoY (Nov)--
F: --
P: --
Canada CPI MoM (Nov)--
F: --
P: --
Canada CPI YoY (SA) (Nov)--
F: --
P: --
Canada Core CPI MoM (SA) (Nov)--
F: --
P: --

No matching data
Latest Views
Latest Views
Trending Topics
Top Columnists
Latest Update
White Label
Data API
Web Plug-ins
Affiliate Program
View All
No data
Citi analysts said they raised their year-end 2025 S&P 500 target to 6300, driven by "a marginally more...
Citi analysts said they raised their year-end 2025 S&P 500 target to 6300, driven by "a marginally more constructive fundamental view and an expectation for persistency of the current valuation backdrop."
Looking further ahead, the bank’s mid-2026 target of 6500 implies a high-single-digit percentage upside over the next twelve months, underscoring their "structural bullishness on U.S. large cap."
Citi maintains a preference for growth stocks, as the artificial intelligence (AI) theme continues to gain momentum.
The first half of 2025 saw a "whipsaw" market, according to Citi. Their initial expectation for a flat first half followed by a stronger second half was challenged in April, when tariff risks led to a target downgrade.
However, a subsequent rally, fueled by Q1 results and renewed confidence in the AI trade, demonstrated "broader confidence in corporate adaptability and, with it, fundamental stability."
Citi’s revised S&P 500 base case of 6300 for year-end 2025 and 6500 for mid-2026 effectively brings them back to their initial directional outlook for the year.
They have also increased their full-year index earnings estimate to $261 from a previous $255. While this remains below the initial $270 projection and the current $264 consensus, Citi notes that "as worst-case tariff impacts are negated, a modestly higher terminal multiple is applied."
Regarding valuation, Citi acknowledges that the S&P 500 is trading "toward the higher end of its historic valuation range," but they "presume the index can hold 21x forward."
Citi also highlights an "ongoing structural shift in earnings contribution away from Cyclicals and toward Growth," which provides context for historical valuation comparisons.
Citi notes that while concerns persist regarding consumption trends and policy implications on rates/currency, the “AI trade seems to be gaining renewed momentum.”
Bitcoin could be on the verge of a massive breakout, according to popular crypto analyst Doctor Profit, who predicts a potential price surge of up to 170% in the coming months. With a Golden Cross formation, key support near $100K, and a pivotal CPI inflation report just days away, the market may be heading for explosive gains.
At the start of June, Bitcoin was trading at $104,588.85, but briefly dipped 4.10% between June 3–5. However, it bounced back sharply from $100,400 on June 6, rising 2.74% in a single day. Since then, BTC has gained another 5.07%, currently sitting around $106,663.68.
Doctor Profit shared on X (formerly Twitter) that Bitcoin is attempting to break a diagonal resistance line—a move he believes could launch BTC into a new all-time high soon.
“A confirmed Golden Cross and strong $100K support signal a bullish breakout. BTC could rise 70–170% if macro factors align,” he wrote.
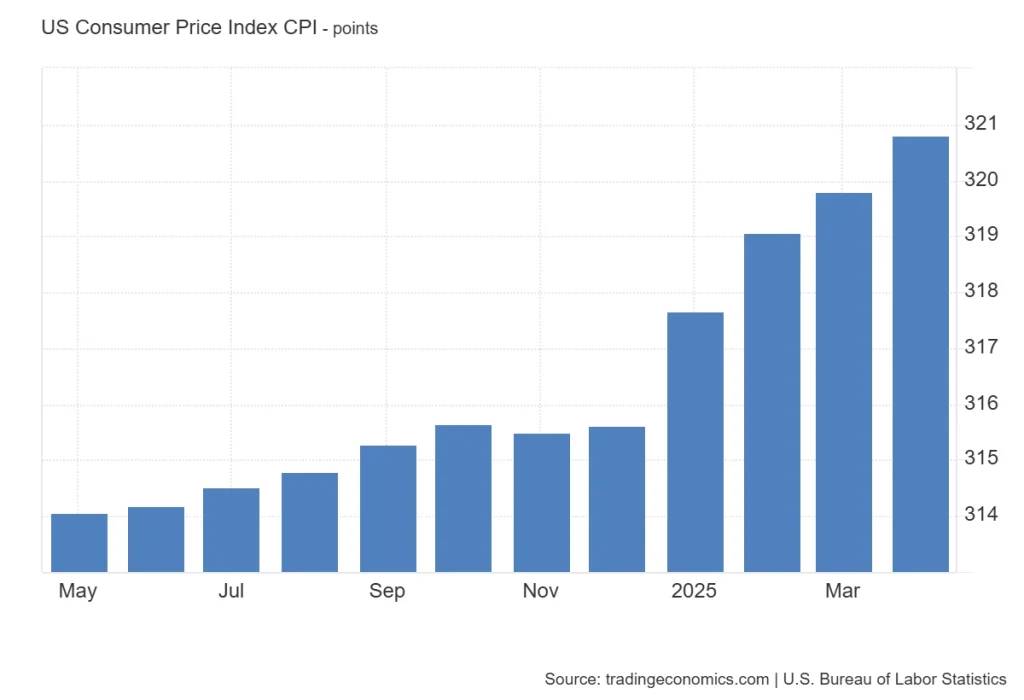
All eyes are on the U.S. Consumer Price Index (CPI) data release scheduled for June 11, 2025. In April, CPI rose from 319.799 to 320.795 points. This month, it's projected to reach 321.9, according to TEForecast.

More importantly, the U.S. inflation rate, which dropped to 2.3% in April, is expected by Wall Street to rise slightly to 2.5%. However, Doctor Profit believes the number could surprise to the downside—possibly between 2.1% and 2.3%. A lower-than-expected CPI could spark optimism, increasing chances of a Fed rate cut—a bullish catalyst for Bitcoin.
Doctor Profit also notes a liquidity cluster between $108K and $110K, which may be BTC's next short-term target before a bigger breakout. If Bitcoin pushes through that zone, it could open the path for a sustained rally.
The European Central Bank is likely to continue cutting interest rates in the second half of 2025, according to analysts at Barclays.
Despite President Christine Lagarde’s signal that the current monetary easing cycle may be nearing its end, Barclays expects two additional 25-basis-point reductions at the ECB’s September and December meetings. This would bring the deposit facility rate down to 1.5% by year-end.
At its June meeting, the ECB lowered policy rates by 25 basis points, citing lower inflation projections.
However, Lagarde struck a more hawkish tone than expected, stating, “We are getting to the end of the monetary policy cycle,” and dismissed inflation undershoots in 2026 as largely driven by energy prices and currency effects.
Barclays analysts believe that, despite the rhetoric, a majority on the Governing Council will support further easing based on current economic and inflation data.
Headline inflation dropped to 1.9% year-on-year in May, below the ECB’s 2% medium-term target. Core inflation also eased, falling to 2.3% from 2.7% the previous month.
Services inflation saw a notable decline, partly reversing holiday-related price spikes. Barclays’ inflation tracker projects headline inflation will stay below target through 2026, bottoming at 1.4% in early 2026 and settling at 1.7% later that year. This path is broadly consistent with updated ECB staff forecasts.
On the growth front, euro area GDP expanded 0.6% quarter-on-quarter in the first quarter, but this figure was inflated by a 9.7% surge in Irish GDP, which reflects multinational activity rather than domestic demand.
Excluding Ireland, the euro area grew 0.3%. Barclays noted that the boost from U.S. firms’ front-loading purchases ahead of tariffs, which temporarily lifted exports, is already fading.
Recent data suggest a slowdown in activity. April industrial production declined across Germany, France and Spain, while factory orders in Germany rose only on the back of strength in two volatile sectors.
Services and retail data were more stable, and the unemployment rate fell slightly in April. Still, Barclays sees overall momentum as weak.
Barclays also questioned the ECB’s baseline growth assumptions, which remain unchanged for 2025 at 0.9% and were revised only slightly downward for 2026.
Analysts said these appear optimistic in light of persistent economic headwinds and delays in fiscal stimulus, especially in Germany, where tax reforms and infrastructure spending are expected to have more impact after 2027.
While the ECB maintains a meeting-by-meeting approach, Barclays sees sufficient evidence for continued policy easing.
Analysts argue that the projected inflation undershoot, combined with fragile growth, supports further rate cuts even if the central bank refrains from signaling them in advance.
GBP/USD is attempting a fresh increase above the 1.3500 resistance. EUR/GBP declined steadily below the 0.8440 and 0.8430 support levels.
● The British Pound is attempting a fresh increase above 1.3515.
● There was a break above a key bearish trend line with resistance at 1.3535 on the hourly chart of GBP/USD.
● EUR/GBP is trading in a bearish zone below the 0.8450 pivot level.
● There is a connecting bullish trend line forming with support at 0.8415 on the hourly chart.
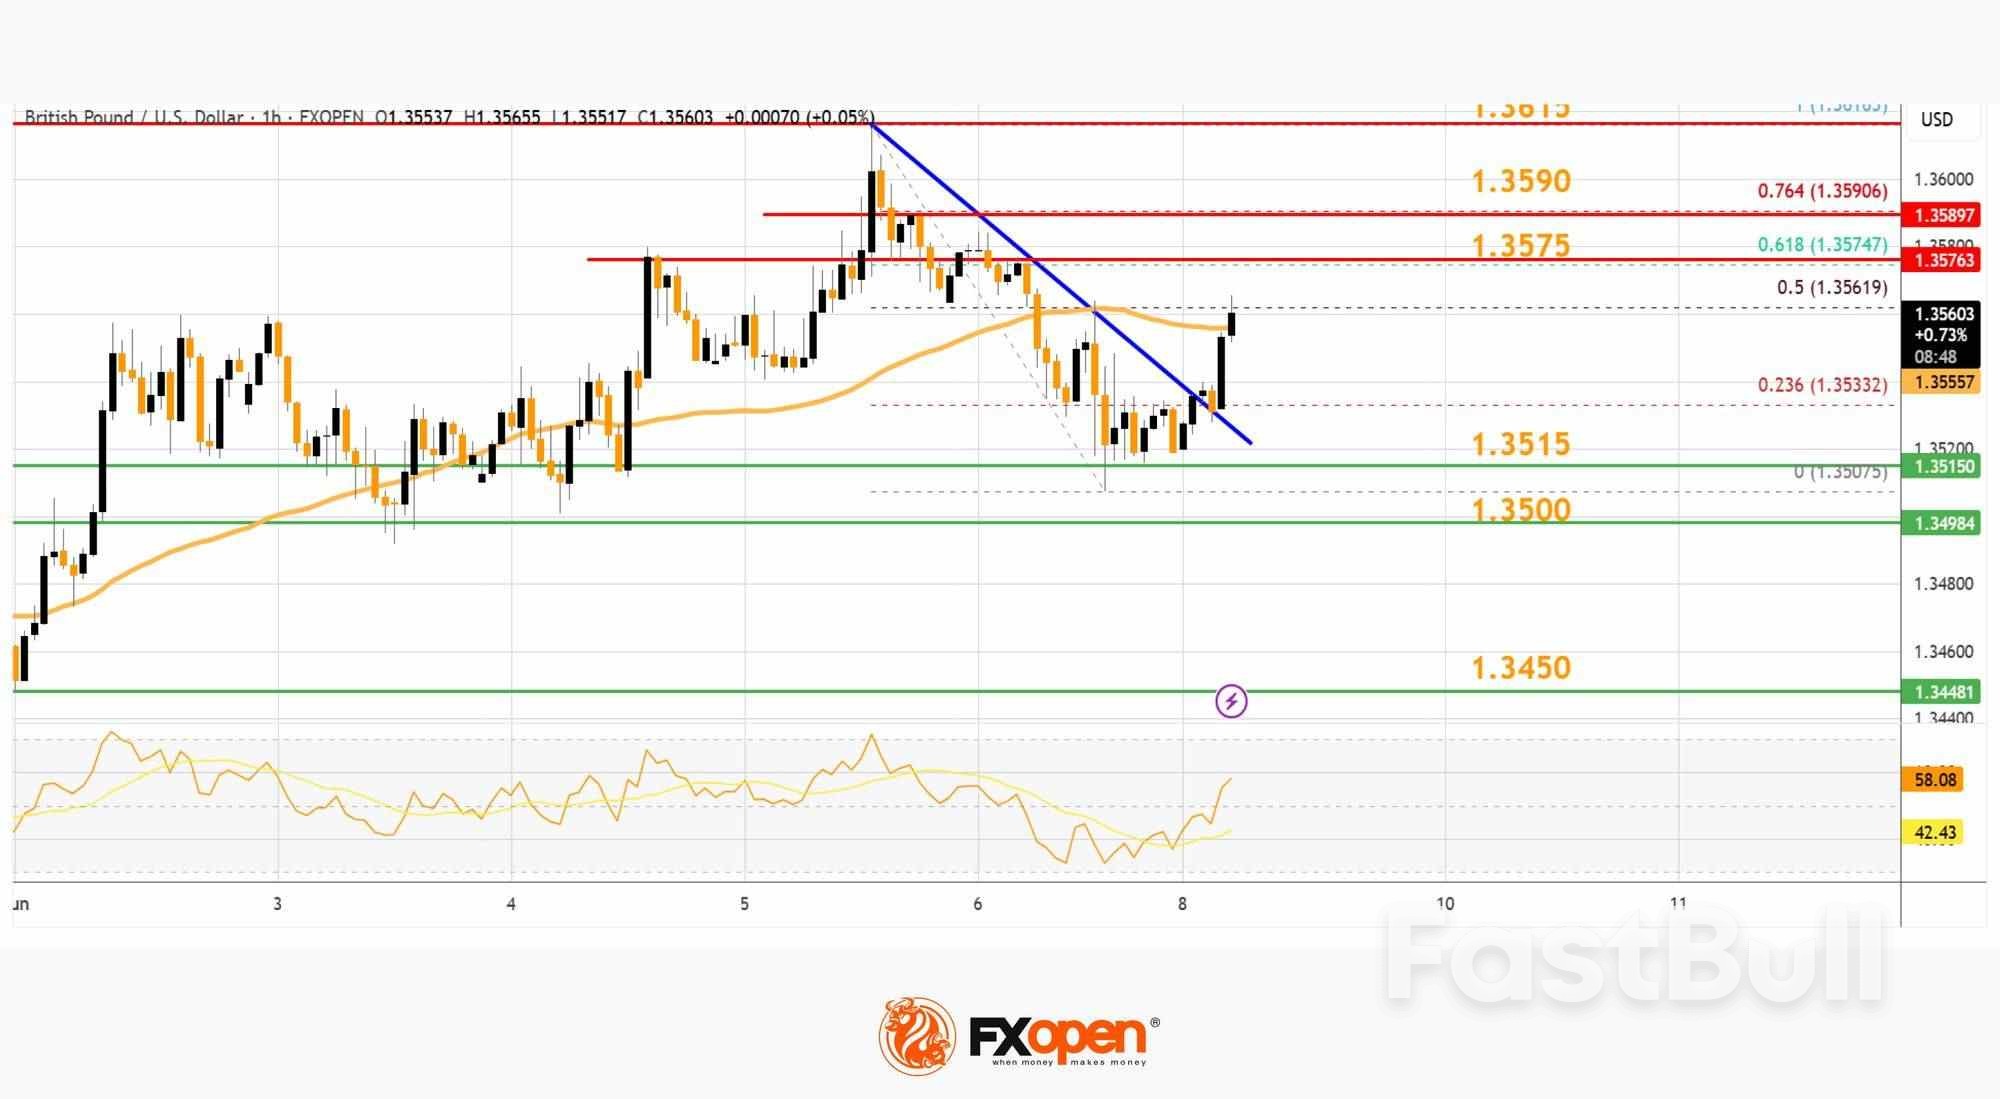
On the hourly chart of GBP/USD, the pair declined after it failed to clear the 1.3615 resistance. The British Pound even traded below the 1.3575 support against the US Dollar.
Finally, the pair tested the 1.3500 zone and is currently attempting a fresh increase. The bulls were able to push the pair above the 50-hour simple moving average and 1.3540. There was a break above a key bearish trend line with resistance at 1.3535.
The pair tested the 50% Fib retracement level of the downward move from the 1.3616 swing high to the 1.3507 low. It is now showing positive signs above 1.3540.
On the upside, the GBP/USD chart indicates that the pair is facing resistance near 1.3575 and the 61.8% Fib retracement level of the downward move from the 1.3616 swing high to the 1.3507 low.
The next major resistance is near 1.3590. A close above the 1.3590 resistance zone could open the doors for a move toward 1.3615. Any more gains might send GBP/USD toward 1.3650.
On the downside, immediate support is near the 1.3515. If there is a downside break below 1.3515, the pair could accelerate lower. The first major support is near the 1.3500 level. The next key support is seen near 1.3450, below which the pair could test 1.3420. Any more losses could lead the pair toward the 1.3350 support.
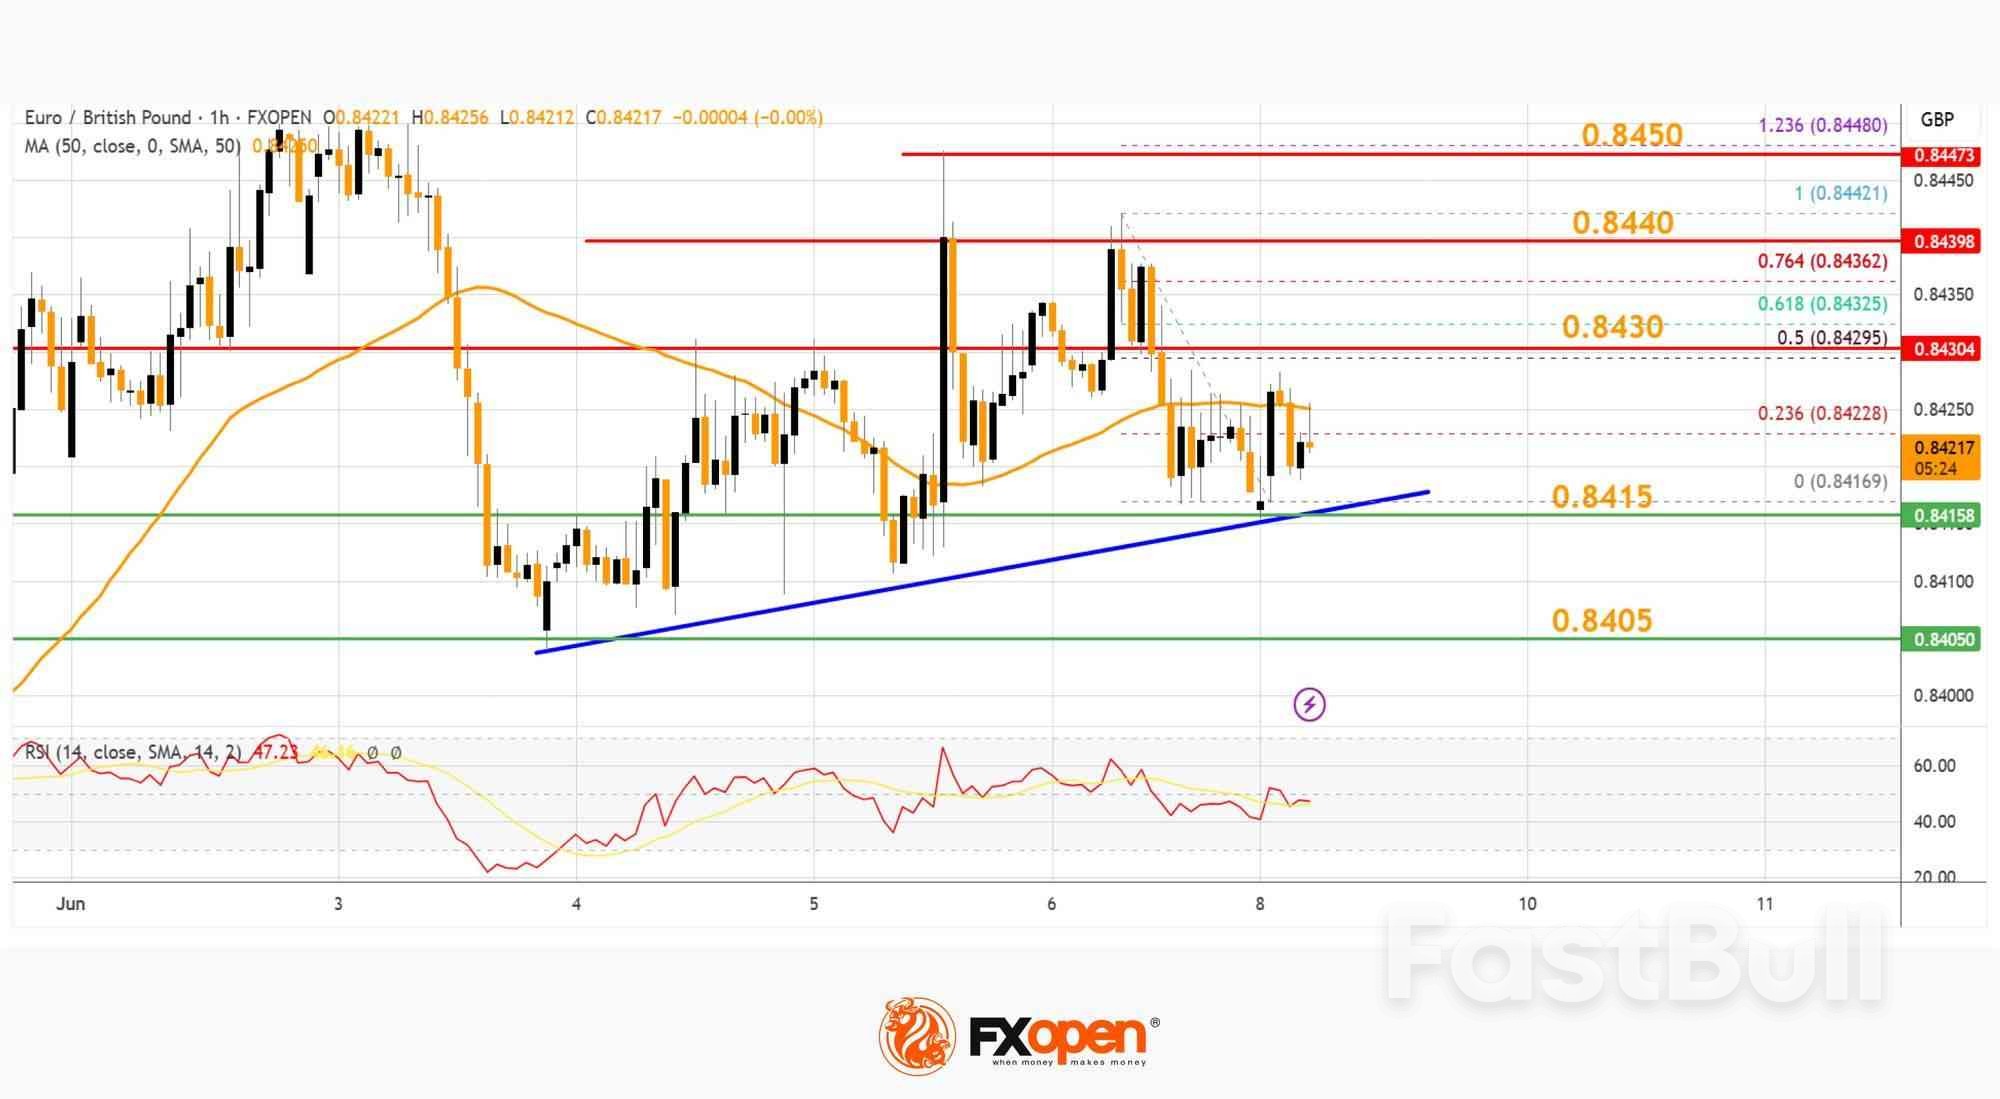
On the hourly chart of EUR/GBP, the pair started a fresh decline from well above 0.8460. The Euro traded below the 0.8440 and 0.8430 support levels against the British Pound.
The EUR/GBP chart suggests that the pair even declined below the 0.8420 level and tested 0.8415. It is now consolidating losses and trading below the 50-hour simple moving average. However, there is a connecting bullish trend line forming with support at 0.8415.
The pair is now facing resistance near the 50% Fib retracement level of the downward move from the 0.8442 swing high to the 0.8416 low at 0.8430.
The next major resistance could be 0.8440. The main resistance is near the 0.8450 zone. It coincides with the 1.236 Fib extension level of the downward move from the 0.8442 swing high to the 0.8416 low.
A close above the 0.8450 level might accelerate gains. In the stated case, the bulls may perhaps aim for a test of 0.8480. Any more gains might send the pair toward the 0.8500 level.
Immediate support sits near 0.8415. The next major support is near 0.8405. A downside break below the 0.8405 support might call for more downsides. In the stated case, the pair could drop toward the 0.8380 support level.
728 RM B 7/F GEE LOK IND BLDG NO 34 HUNG TO RD KWUN TONG KLN HONG KONG


White Label
Data API
Web Plug-ins
Poster Maker
Affiliate Program
The risk of loss in trading financial instruments such as stocks, FX, commodities, futures, bonds, ETFs and crypto can be substantial. You may sustain a total loss of the funds that you deposit with your broker. Therefore, you should carefully consider whether such trading is suitable for you in light of your circumstances and financial resources.
No decision to invest should be made without thoroughly conducting due diligence by yourself or consulting with your financial advisors. Our web content might not suit you since we don't know your financial conditions and investment needs. Our financial information might have latency or contain inaccuracy, so you should be fully responsible for any of your trading and investment decisions. The company will not be responsible for your capital loss.
Without getting permission from the website, you are not allowed to copy the website's graphics, texts, or trademarks. Intellectual property rights in the content or data incorporated into this website belong to its providers and exchange merchants.
Not Logged In
Log in to access more features

FastBull Membership
Not yet
Purchase


Log In
Sign Up


