


- USDJPY
- XAUUSD
- XAGUSD
- WTI


Markets
Analysis
User
24/7
Economic Calendar
Education
Data
- Names
- Latest
- Prev


BNB is struggling to hold $750, and a bear pennant on the chart keeps a 15% drop toward the mid-$650s in play.

BNB (BNB), a Binance-tied cryptocurrency, may plunge by another 15% in February, continuing its slide from the October top above $1,300 and now struggling to hold above the $750 support level.
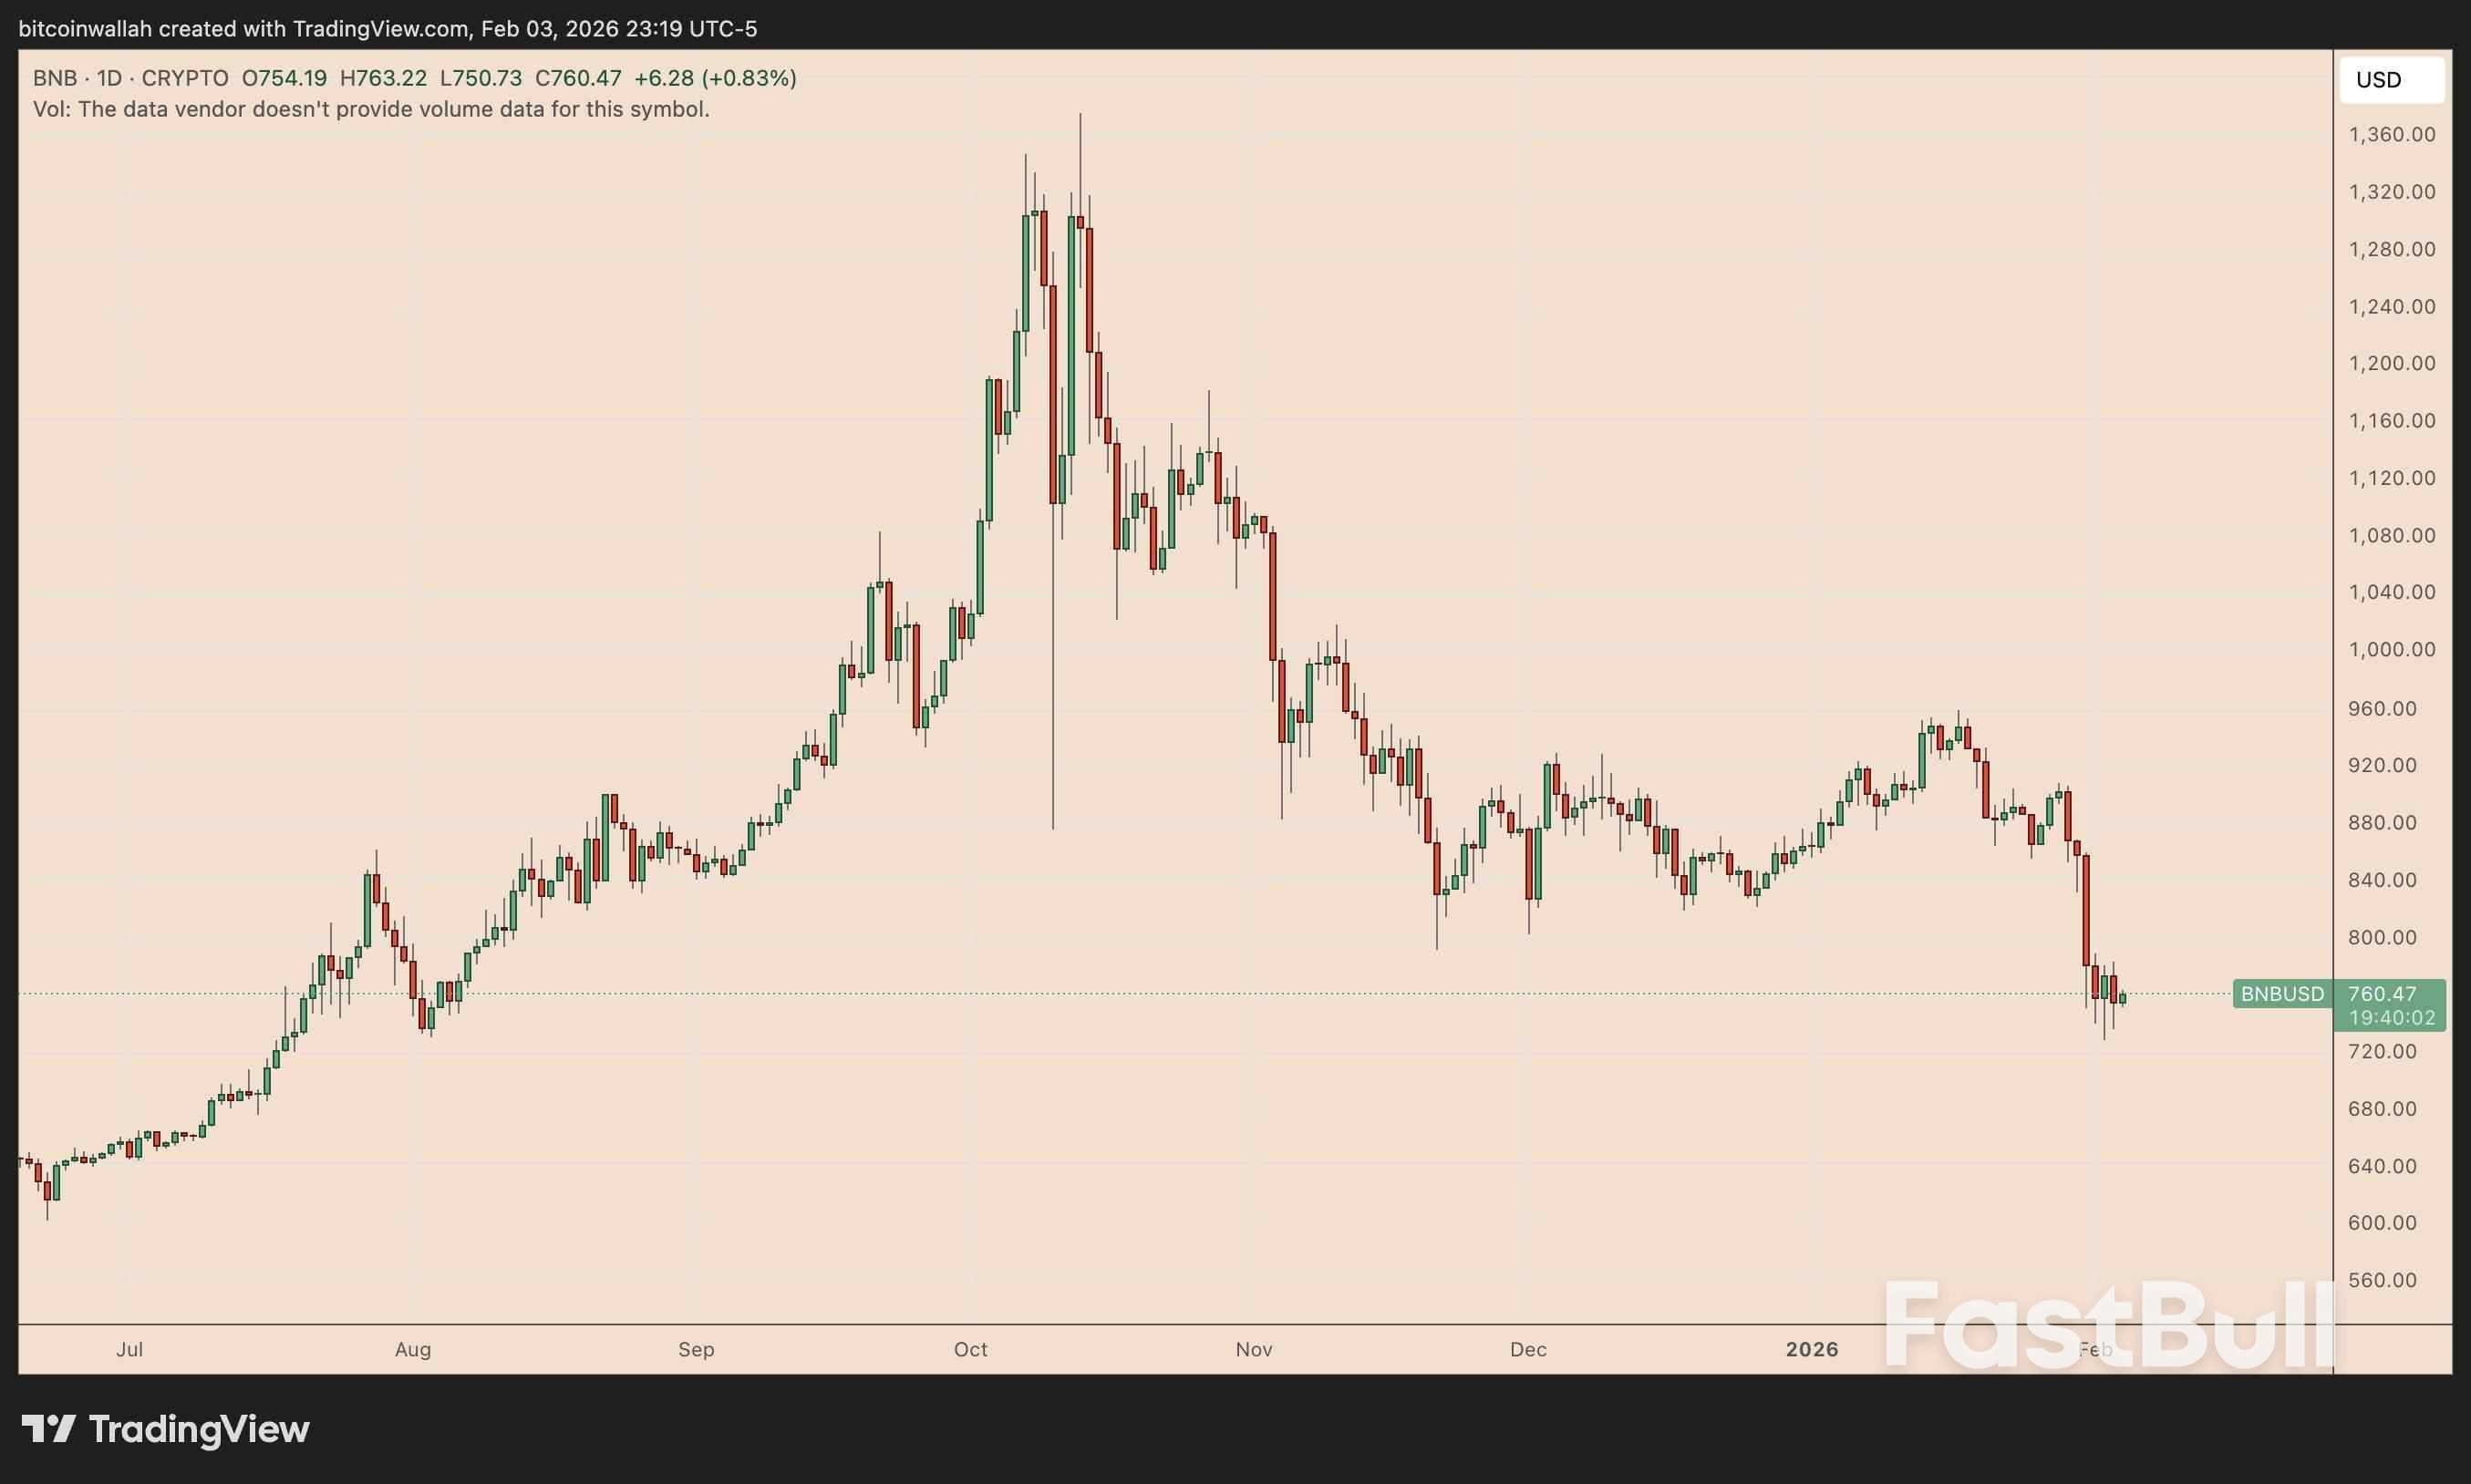 BNB/USD daily price chart. Source: TradingView
Let's examine the reasons behind my bearish outlook.
Markets have started pricing a sharper pullback in AI-linked equities after a crowded rally, and crypto has tracked that risk-off move.
A Goldman Sachs basket of US software stocks fell 6% on Tuesday, marking its biggest one-day drop since April's tariff-driven selloff. The tech-heavy Nasdaq-100 slipped 1.6%.
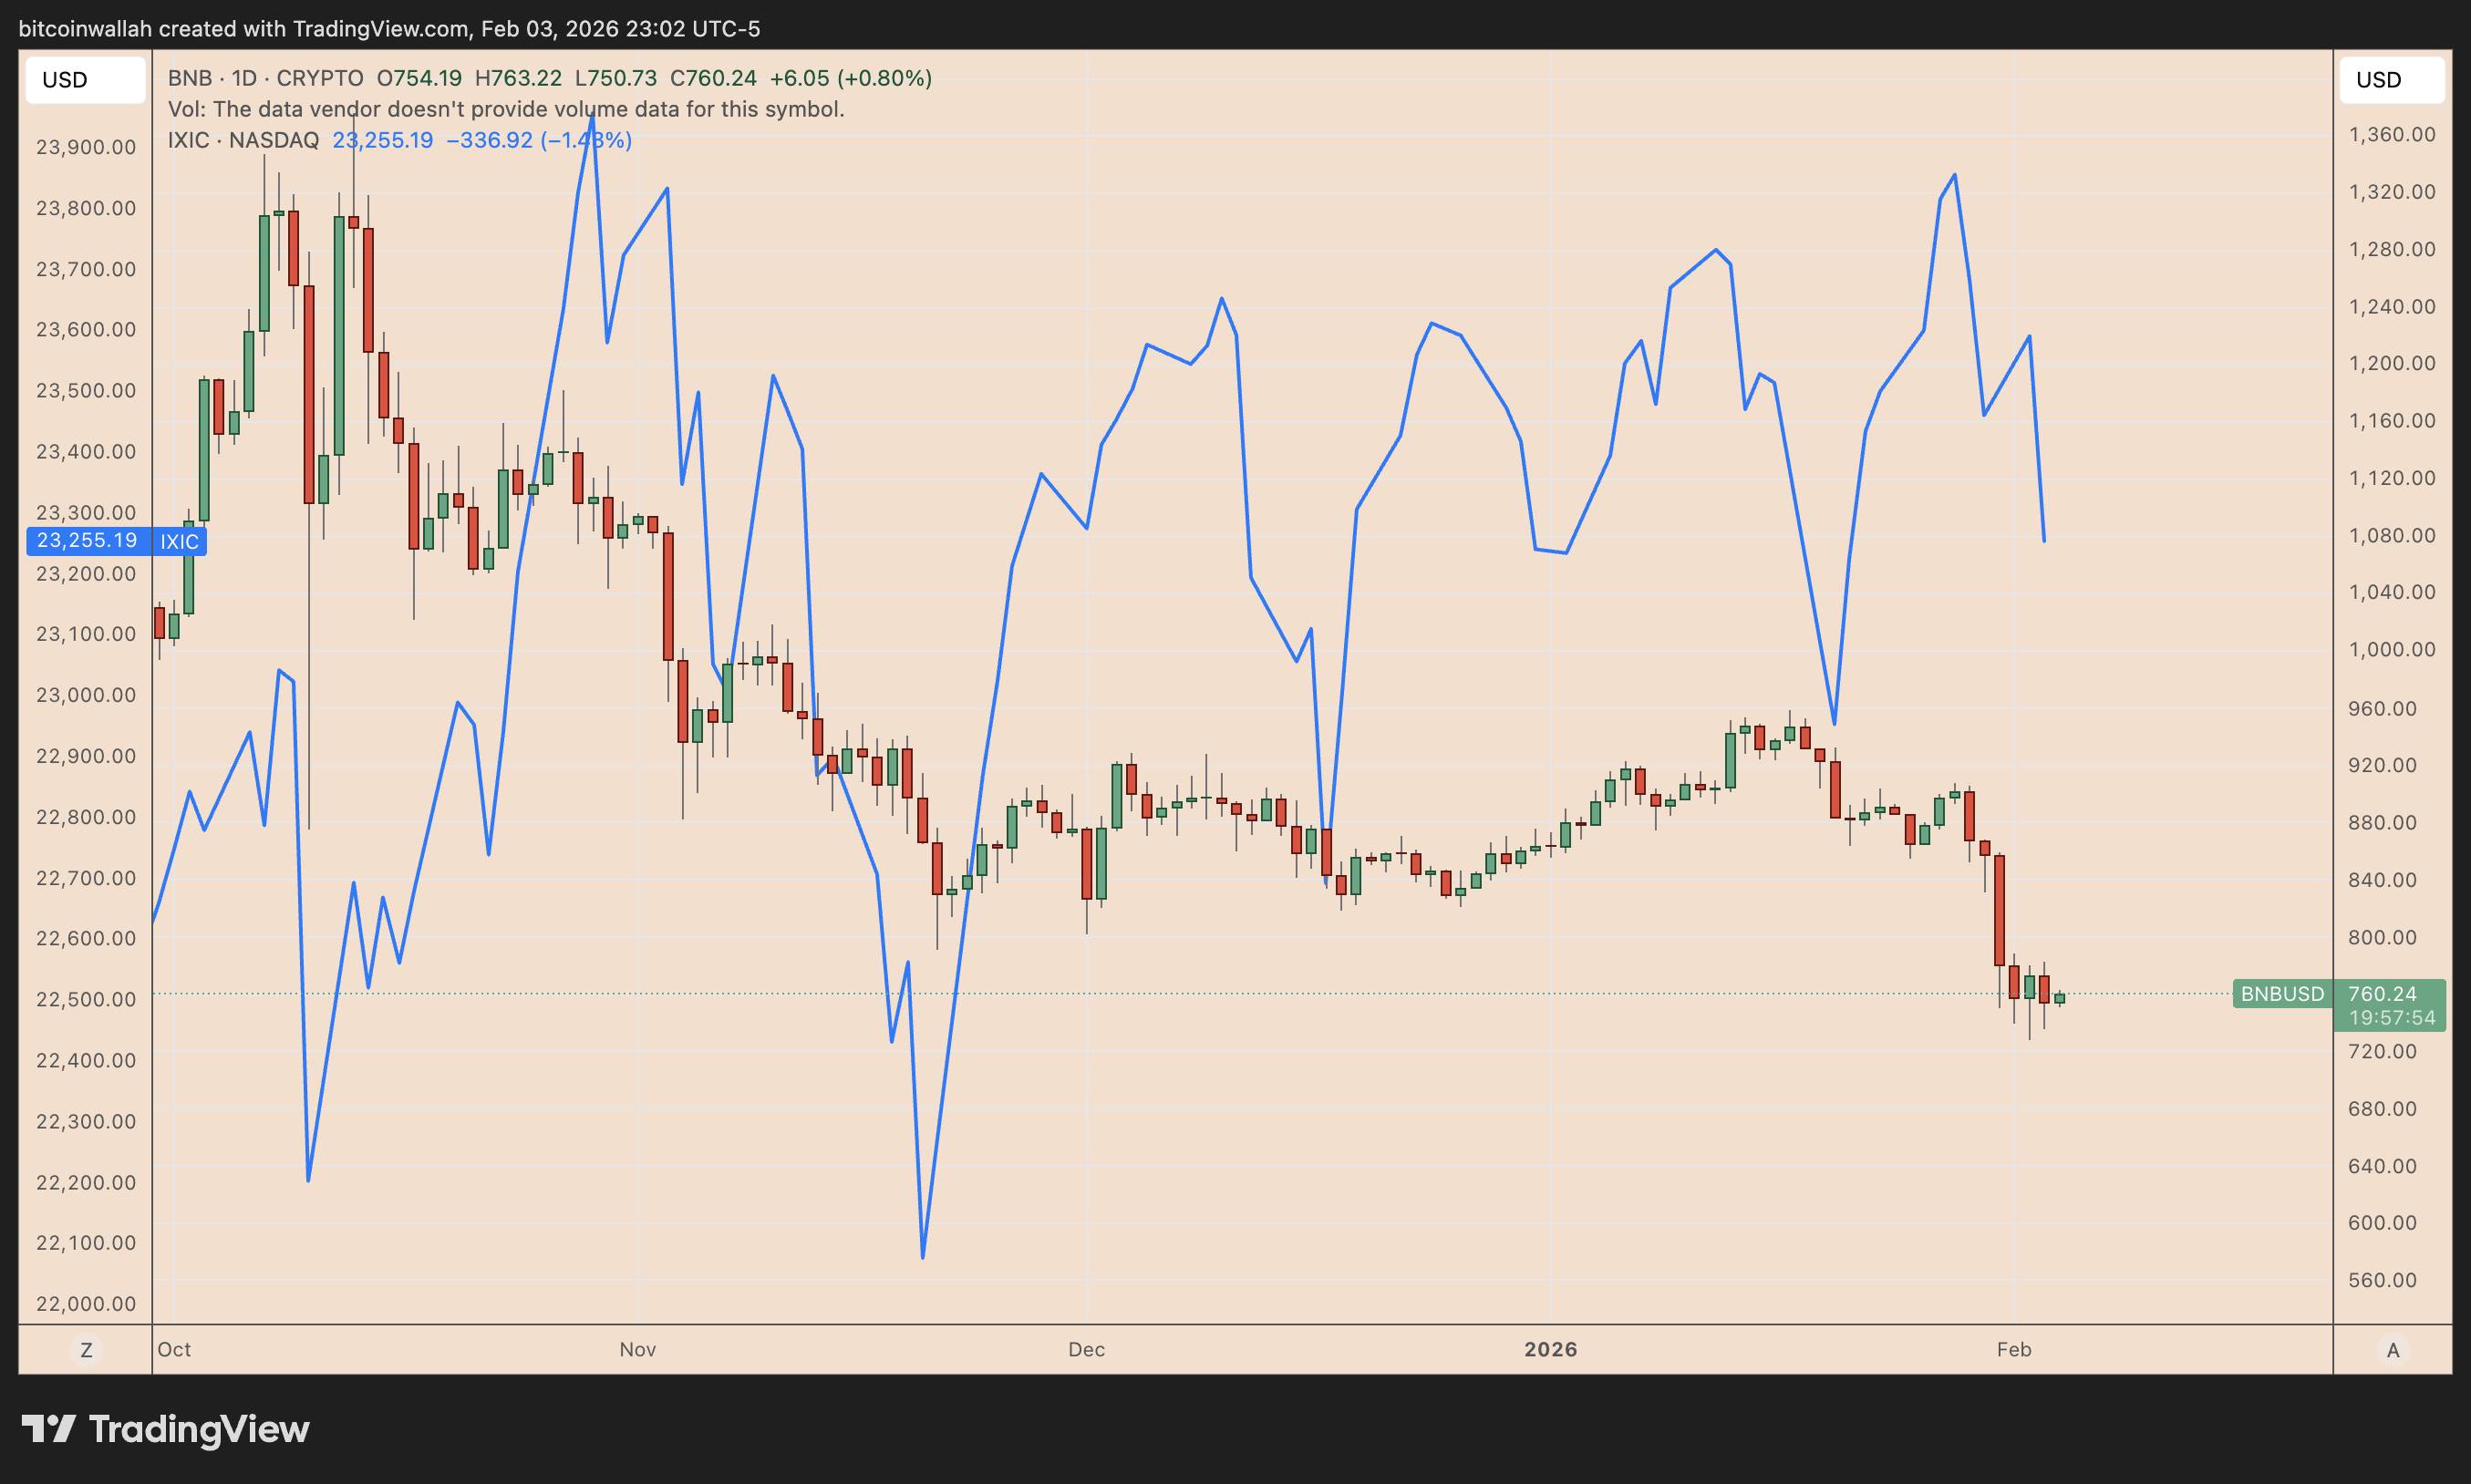 BNB/USD vs. Nasdaq Composite daily performance chart. Source: TradingView
BNB fell alongside, showing how closely cryptocurrencies have been tracking the tech sector's gains and losses.
AI trades have dominated US equities for the past three years. Still, more investors now see that rally, driven by the "Magnificent Seven" megacaps, starting to fade as leadership broadens across the market.
In 2026, that shift has become clearer, with value stocks sharply outperforming growth. I therefore expect further downside in these riskier assets, as gold (XAU) and silver (XAG) show signs of recovery.
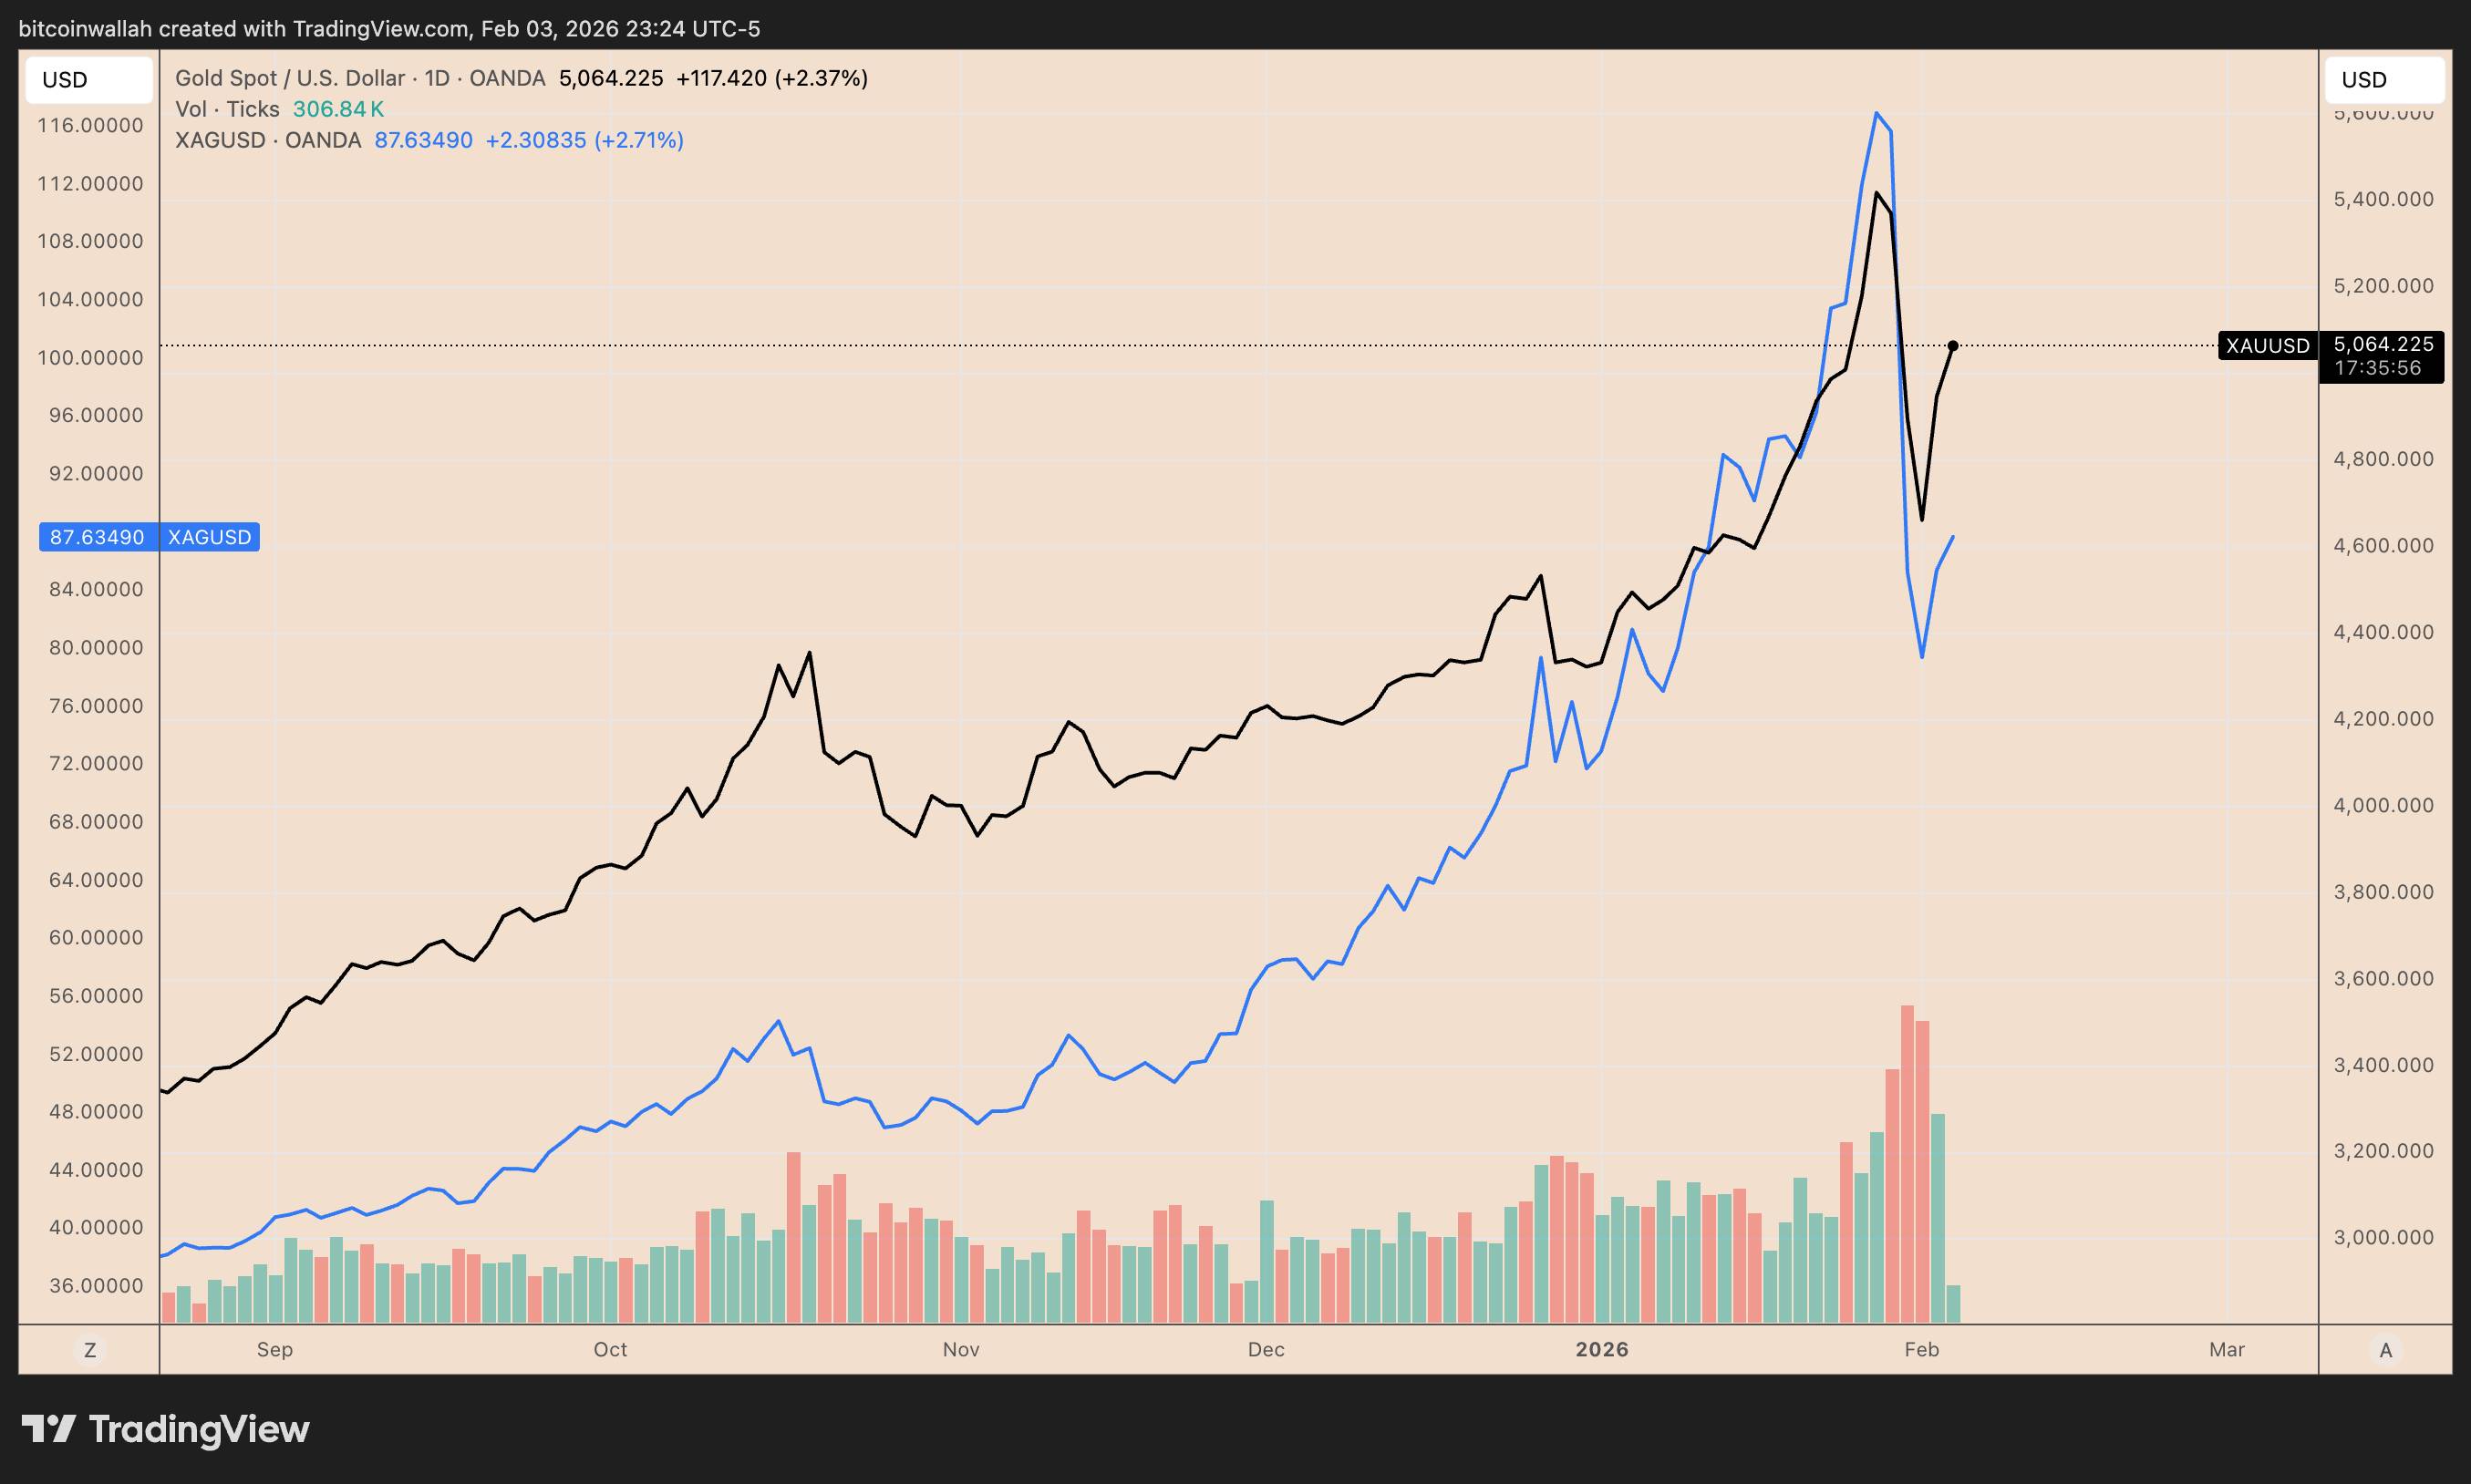 XAU/USD vs. XAG/USD daily price chart. Source: TradingView
That's a bid for protection from equities' overvaluations, which will likely hurt BNB.
At the same time, the nomination of Kevin Warsh as the next Fed chairman has pushed traders to reassess the "higher-for-longer" path for rates. Higher expected rates usually pressure liquidity-sensitive assets like BNB first.
BNB has also faced coin-specific pressure from negative coverage tied to Binance and co-founder Changpeng Zhao.
The latest wave centers on allegations of market manipulation linked to '10/10,' with claims circulating that Binance-linked activity amplified a price crash on Oct. 10 that triggered roughly $19 billion in liquidations across the crypto market.
Binance and CZ have pushed back on manipulation claims previously, and no new confirmed legal determination has emerged yet. Still, the headlines have weighed on sentiment during an already fragile BNB market.
On the 4-hour chart, BNB is carving a bear pennant: a sharp drop followed by tight, contracting consolidation. That structure often resolves in the direction of the prior downside move.
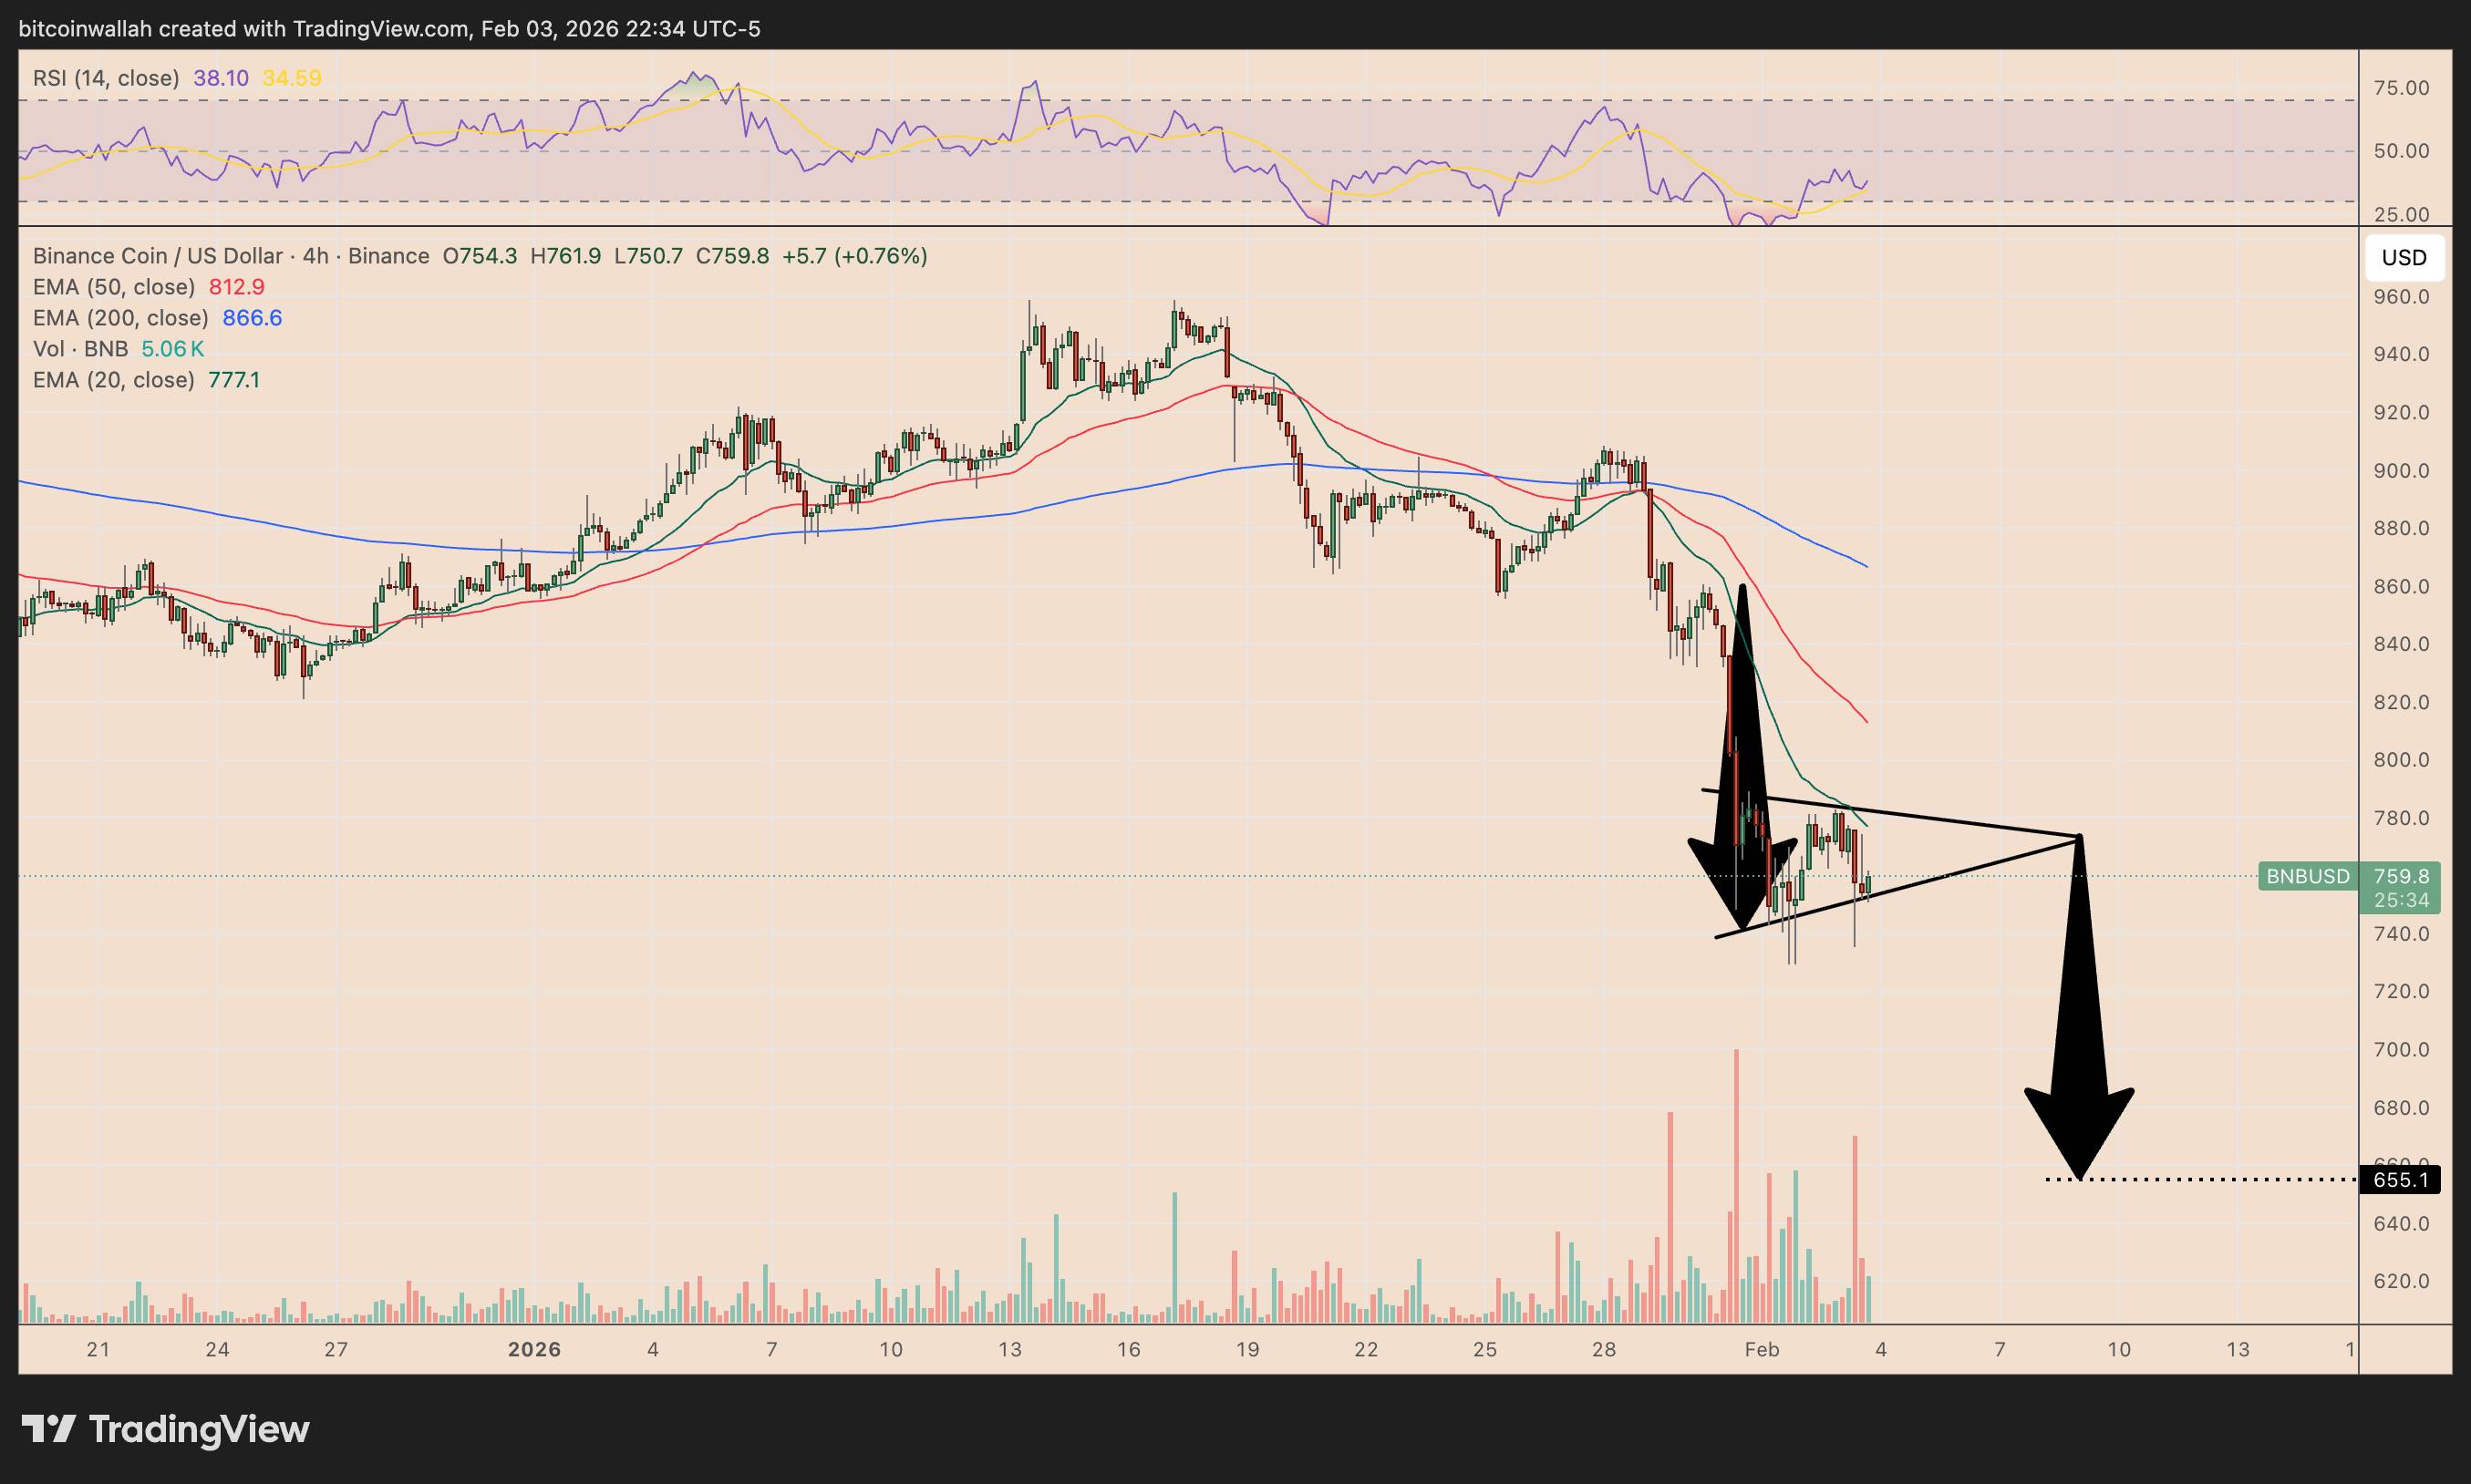 BNB/USD four-hour price chart. Source: TradingView
A breakdown from the pennant's lower trendline would keep the downtrend intact and open the door to a move toward the mid-$650s, roughly another 15% lower from current levels.
The nearby moving averages sit above the BNB price, which adds overhead resistance if bulls try to reclaim momentum.
Moreover, BNB cost-basis bands keep the downside pressure intact.
Most buyers from the last 12 months are sitting on losses, according to Glassnode data. That makes quick selloffs more likely if BNB tries to bounce, because many holders will use rallies to reduce damage.
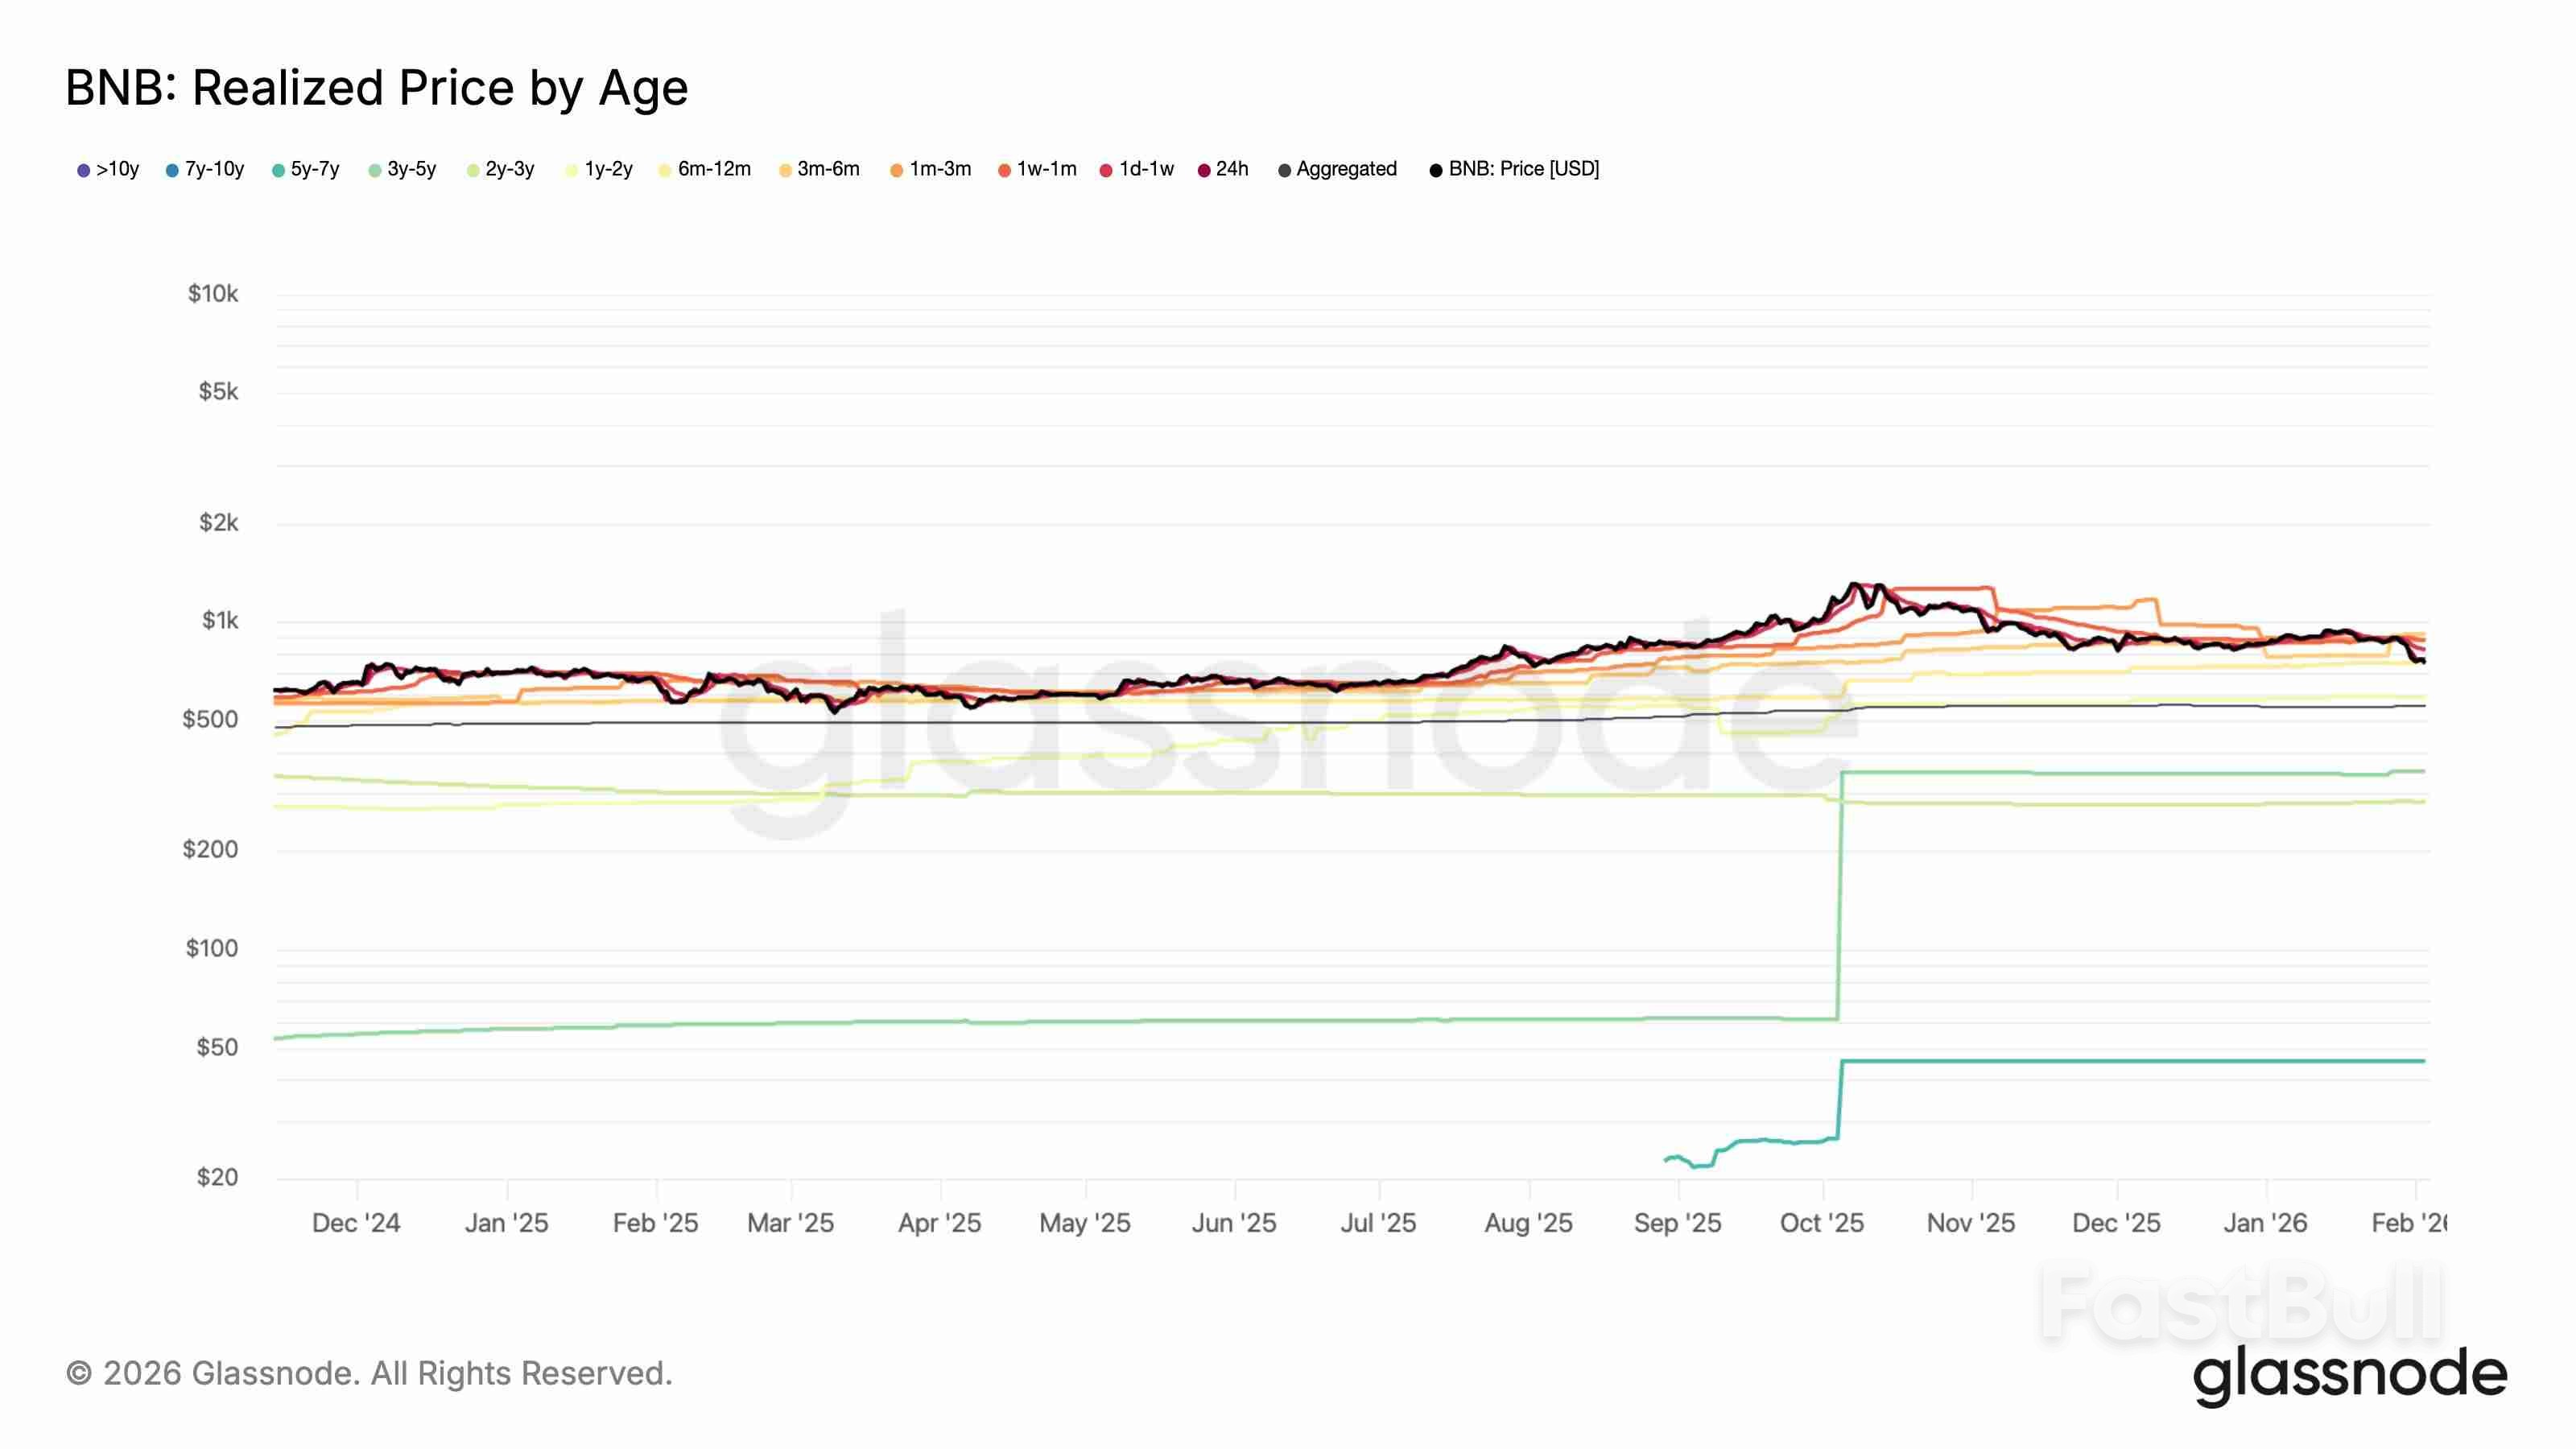 BNB realized price by age vs. price. Source: Glassnode
Buyers from around 12 months ago sit close to break-even. That creates another layer of selling if the price climbs back toward their average entry level.
Overall, my bias is strongly bearish toward BNB.
728 RM B 7/F GEE LOK IND BLDG NO 34 HUNG TO RD KWUN TONG KLN HONG KONG


The risk of loss in trading financial instruments such as stocks, FX, commodities, futures, bonds, ETFs and crypto can be substantial. You may sustain a total loss of the funds that you deposit with your broker. Therefore, you should carefully consider whether such trading is suitable for you in light of your circumstances and financial resources.
No decision to invest should be made without thoroughly conducting due diligence by yourself or consulting with your financial advisors. Our web content might not suit you since we don't know your financial conditions and investment needs. Our financial information might have latency or contain inaccuracy, so you should be fully responsible for any of your trading and investment decisions. The company will not be responsible for your capital loss.
Without getting permission from the website, you are not allowed to copy the website's graphics, texts, or trademarks. Intellectual property rights in the content or data incorporated into this website belong to its providers and exchange merchants.
Not Logged In
Log in to access more features


Log In
Sign Up


