• Trade
  • Markets
  • Copy
  • Contests
  • 24/7
  • Calendar
  • Q&A
  • Chats
Screeners
SYMBOL
LAST
BID
ASK
HIGH
LOW
NET CHG.
%CHG.
SPREAD
SOURCE
SPX
S&P 500 Index
7743.98
7743.98
7743.98
7758.43
7718.37
+21.38
+ 0.28%
--
--
DJI
Dow Jones Industrial Average
52475.10
52475.10
52475.10
52634.32
52335.43
+97.53
+ 0.19%
--
--
IXIC
NASDAQ Composite Index
26549.84
26549.84
26549.84
26587.34
26414.92
+72.04
+ 0.27%
--
--
USDX
US Dollar Index
102.013
102.013
102.093
102.145
101.878
+0.055
+ 0.05%
--
--
EURUSD
Euro / US Dollar
1.11408
1.11408
1.11417
1.11605
1.11250
-0.00114
-0.10%
--
--
GBPUSD
Pound Sterling / US Dollar
1.33279
1.33279
1.33289
1.33382
1.32955
+0.00037
+ 0.03%
--
--
XAUUSD
Gold / US Dollar
4023.55
4023.55
4023.96
4068.79
4015.72
-43.69
-1.07%
--
--
WTI
Light Sweet Crude Oil
100.583
100.583
100.613
101.530
99.860
-0.622
-0.61%
--
--

Community Accounts

Signal Accounts
--
Profit Accounts
--
Loss Accounts
--
View More

Become a signal provider

Sell trading signals to earn additional income

View More

Guide to Copy Trading

Get started with ease and confidence

View More

Signal Accounts for Members

All Signal Accounts

Best Return
  • Best Return
  • Best P/L
  • Best MDD
Past 1W
  • Past 1W
  • Past 1M
  • Past 1Y

All Contests

  • All
  • Recommend
  • Stocks
  • Cryptocurrencies
  • Central Banks
  • Trump Updates
  • Featured News
Top News Only
Share

Ukrainian President Zelensky: Russia’s Message Is Clear – They Want The Conflict To Continue, And Everyone In The World Still Has To Make A Huge Effort To Exert Appropriate Pressure Through Strong Measures To Achieve A Major De-escalation Of The Situation

Share

PBF Energy: Freight Dynamics And Increasing Supply Of Heavy Crude Oil Have Widened The Price Spread Between Light And Heavy Crude Oil

Share

U.S. Inflation Accelerated In September, Fueling Expectations Of A Fed Rate Hike In December

Share

Kremlin Aide Ushakov: If Ukraine Launches A Large-scale Attack During The November 4th Celebrations, It Could Affect Russia's Attitude Toward The Trilateral Negotiations

Share

The US Economy Grew Faster This Summer, Driven By Continued Investment In AI And Consumer Spending

Share

A Spokesperson For The British Prime Minister Stated That The Government Will Push Forward With Welfare Reforms Before The Next General Election. Prime Minister Burnham And Chancellor Of The Exchequer Healy Believe The Welfare Bill Needs To Be Cut

Share

Market News: The Oil Tanker Leruo, Carrying Russian Diesel Fuel, Was Originally Bound For Brazil, But Has Now Changed Its Destination To "standby On The Atlantic Coast"

Share

Qatari Foreign Ministry: We Are Not Scapegoats For The Failures Of Certain Israeli Politicians

Share

Air France Stated That Flights To And From Riyadh Will Be Suspended Until December 12, 2026

Share

Nick Timuraos, The Fed's Mouthpiece: The Core PCE Index Rose 0.32% Month-over-month In September, And 3.1% Year-over-year (compared To 3.0% In August And 2.8% A Year Ago). The Six-month Annualized Increase Was 2.9% (compared To 2.8% In August And 2.9% A Year Ago). The Three-month Annualized Increase Was Also 2.9%

Share

The US Core PCE Rose 3.10% Year-on-Year In September, In Line With Expectations

Share

The Yield On The 30-year U.S. Treasury Note Fell 1.08 Basis Points To 5.352%, While The Yield On The 2-year Note Fell 2.51 Basis Points To 4.71%

Share

A Spokesperson For The Qatari Foreign Ministry Stated That The Accusations Would Not Deter Its Mediation Efforts Or Support For The Palestinians. The Allegations Of Qatari Interference In The Israeli Elections Are Part Of A Disinformation Campaign Launched By Some Israeli Politicians And Media Outlets

Share

Following The Release Of The US PCE Data, US Treasury Yields Fell Further; The 10-year Treasury Yield Is Currently Down 2.74 Basis Points To 5.02%

Share

Qatari Foreign Ministry: We Vehemently Deny The Allegations That We Interfered In The Israeli Elections

Share

U.S. Treasury Prices Stabilized, Influenced By Personal Consumption Expenditure Prices, GDP Forecasts, And Unemployment Claims Data

Share

The U.S. PCE Price Index Rose 0.5% Month-over-month In September, In Line With Expectations

Share

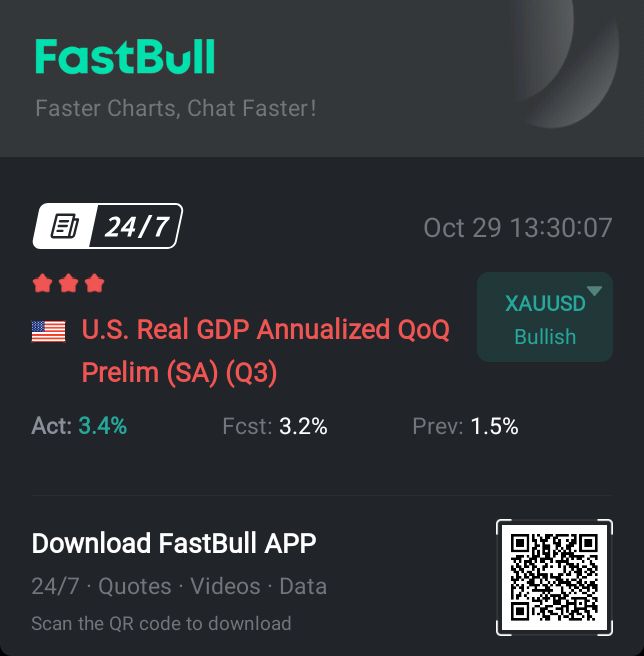
The Initial Estimate For The Annualized Quarterly Rate Of US Real GDP In The Third Quarter Was 3.4%, A Significant Acceleration From 2.2% In The Previous Quarter, In Line With Market Expectations Of 3.2%

Share

The U.S. Core PCE Price Index Rose 0.3% Month-over-month In September; The Expected Increase Was Also 0.3%

Share

Canada's Nonfarm Payrolls Fell By 49,600 In August Compared To The Previous Month

TIME
ACT
FCST
PREV
IMPACT
Italy Unemployment Rate (SA) (Sept)

A:--

F: --

P: --

EURUSD
  • EURUSD
  • XAUUSD
  • XAGUSD
  • WTI
  • USDX
Italy Quarterly Unemployment Rate (SA) (Sept)

A:--

F: --

P: --

EURUSD
  • EURUSD
  • XAUUSD
  • XAGUSD
  • WTI
  • USDX
South Africa PPI YoY (Sept)

A:--

F: --

P: --

XAUUSD
  • XAUUSD
  • XAGUSD
  • WTI
  • USDX
U.K. M4 Money Supply YoY (Sept)

A:--

F: --

P: --

GBPUSD
  • GBPUSD
  • XAUUSD
  • XAGUSD
  • WTI
  • USDX
U.K. Mortgage Lending (Sept)

A:--

F: --

P: --
GBPUSD
  • GBPUSD
  • XAUUSD
  • XAGUSD
  • WTI
  • USDX
U.K. M4 Money Supply MoM (Sept)

A:--

F: --

P: --

GBPUSD
  • GBPUSD
  • XAUUSD
  • XAGUSD
  • WTI
  • USDX
U.K. Mortgage Approvals (Sept)

A:--

F: --

P: --
GBPUSD
  • GBPUSD
  • XAUUSD
  • XAGUSD
  • WTI
  • USDX
Euro Zone Consumer Inflation Expectations (Oct)

A:--

F: --

P: --

EURUSD
  • EURUSD
  • XAUUSD
  • XAGUSD
  • WTI
  • USDX
Euro Zone Selling Price Expectations (Oct)

A:--

F: --

P: --

EURUSD
  • EURUSD
  • XAUUSD
  • XAGUSD
  • WTI
  • USDX
Euro Zone Industrial Climate Index (Oct)

A:--

F: --

P: --

EURUSD
  • EURUSD
  • XAUUSD
  • XAGUSD
  • WTI
  • USDX
Euro Zone Consumer Confidence Index Final (Oct)

A:--

F: --

P: --

EURUSD
  • EURUSD
  • XAUUSD
  • XAGUSD
  • WTI
  • USDX
Euro Zone Economic Sentiment Indicator (Oct)

A:--

F: --

P: --

EURUSD
  • EURUSD
  • XAUUSD
  • XAGUSD
  • WTI
  • USDX
Euro Zone Services Sentiment Index (Oct)

A:--

F: --

P: --

EURUSD
  • EURUSD
  • XAUUSD
  • XAGUSD
  • WTI
  • USDX
Italy 5-Year BTP Bond Auction Avg. Yield

A:--

F: --

P: --

EURUSD
  • EURUSD
  • XAUUSD
  • XAGUSD
  • WTI
  • USDX
Italy 10-Year BTP Bond Auction Avg. Yield

A:--

F: --

P: --

EURUSD
  • EURUSD
  • XAUUSD
  • XAGUSD
  • WTI
  • USDX
U.S. Initial Jobless Claims 4-Week Avg. (SA)

A:--

F: --

P: --
XAUUSD
  • XAUUSD
  • XAGUSD
  • WTI
  • USDX
U.S. Weekly Continued Jobless Claims (SA)

A:--

F: --

P: --
XAUUSD
  • XAUUSD
  • XAGUSD
  • WTI
  • USDX
U.S. Real Personal Consumption Expenditures MoM (Sept)

A:--

F: --

P: --

USDX
  • USDX
  • XAUUSD
  • XAGUSD
  • WTI
U.S. PCE Price Index MoM (Sept)

A:--

F: --

P: --

XAUUSD
  • XAUUSD
  • XAGUSD
  • WTI
  • USDX
U.S. Personal Income MoM (Sept)

A:--

F: --

P: --

USDX
  • USDX
  • XAUUSD
  • XAGUSD
  • WTI
U.S. PCE Price Index YoY (SA) (Sept)

A:--

F: --

P: --

XAUUSD
  • XAUUSD
  • XAGUSD
  • WTI
  • USDX
U.S. PCE Price Index Prelim QoQ (SA) (Q3)

A:--

F: --

P: --

XAUUSD
  • XAUUSD
  • XAGUSD
  • WTI
  • USDX
U.S. Core PCE Price Index MoM (Sept)

A:--

F: --

P: --

XAUUSD
  • XAUUSD
  • XAGUSD
  • WTI
  • USDX
U.S. GDP Deflator Prelim QoQ (SA) (Q3)

A:--

F: --

P: --

XAUUSD
  • XAUUSD
  • XAGUSD
  • WTI
  • USDX
U.S. Real Personal Consumption Expenditures Prelim QoQ (Q3)

A:--

F: --

P: --

USDX
  • USDX
  • XAUUSD
  • XAGUSD
  • WTI
U.S. Core PCE Price Index Annualized QoQ Prelim (SA) (Q3)

A:--

F: --

P: --

XAUUSD
  • XAUUSD
  • XAGUSD
  • WTI
  • USDX
U.S. Personal Outlays MoM (SA) (Sept)

A:--

F: --

P: --

XAUUSD
  • XAUUSD
  • XAGUSD
  • WTI
  • USDX
U.S. Real GDP Annualized QoQ Prelim (SA) (Q3)

A:--

F: --

P: --

XAUUSD
  • XAUUSD
  • XAGUSD
  • WTI
  • USDX
U.S. Weekly Initial Jobless Claims (SA)

A:--

F: --

P: --
XAUUSD
  • XAUUSD
  • XAGUSD
  • WTI
  • USDX
U.S. Core PCE Price Index YoY (Sept)

A:--

F: --

P: --

XAUUSD
  • XAUUSD
  • XAGUSD
  • WTI
  • USDX
Euro Zone ECB Deposit Rate

--

F: --

P: --

Euro Zone ECB Main Refinancing Rate

--

F: --

P: --

Euro Zone ECB Marginal Lending Rate

--

F: --

P: --

ECB Monetary Policy Statement
ECB Press Conference
U.S. Dallas Fed PCE Price Index YoY (Sept)

--

F: --

P: --

U.S. EIA Weekly Natural Gas Stocks Change

--

F: --

P: --

Brazil CAGED Net Payroll Jobs (Sept)

--

F: --

P: --

U.S. Weekly Treasuries Held by Foreign Central Banks

--

F: --

P: --

South Korea Retail Sales MoM (Sept)

--

F: --

P: --

South Korea Services Output MoM (Sept)

--

F: --

P: --

South Korea Industrial Output MoM (SA) (Sept)

--

F: --

P: --

Japan Tokyo CPI MoM (Oct)

--

F: --

P: --

Japan Jobs to Applicants Ratio (Sept)

--

F: --

P: --

Japan Tokyo CPI YoY (Oct)

--

F: --

P: --

Japan Tokyo Core CPI YoY (Oct)

--

F: --

P: --

Q&A with Experts
    • All
    • Chatrooms
    • Groups
    • Friends
    Capri flag
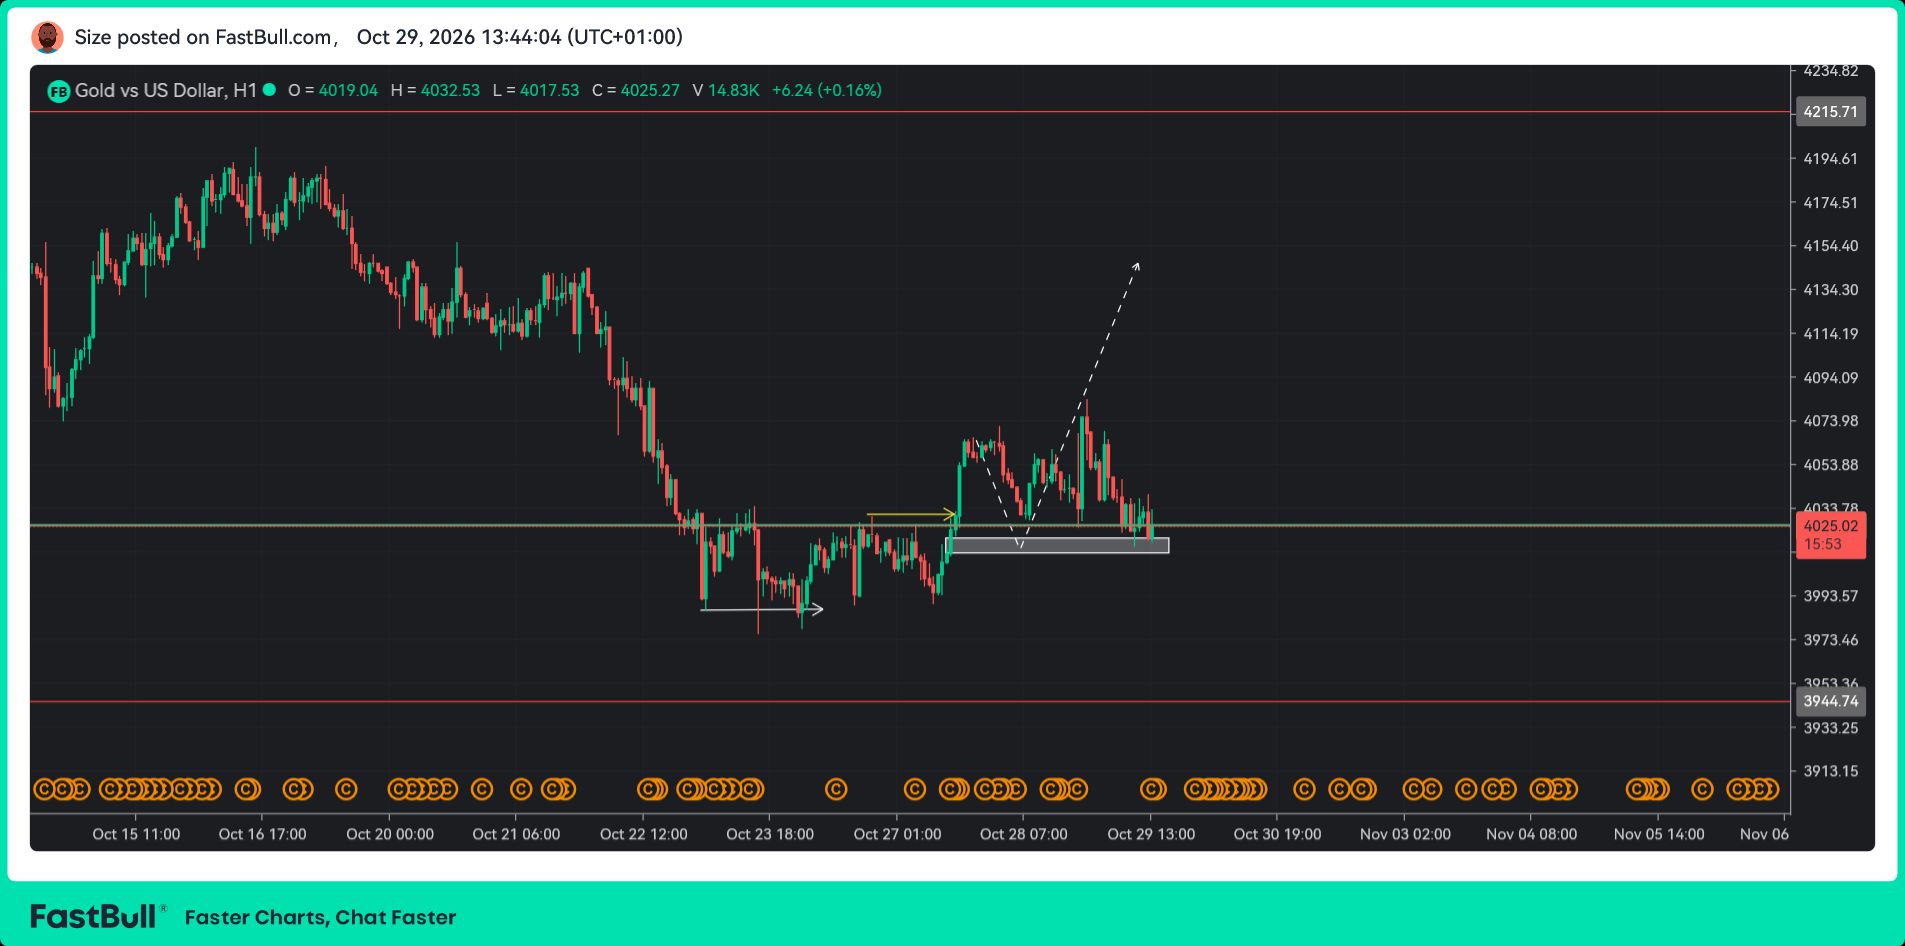
    below blue closing of H1 is important for more sell side
    Skylark flag
    Skylark
    GBP data released show the Actual-3.5 Forecast - 3.2 Previous - 1.5
    Size flag
    Muhammad Z
    I'm doing well. How about you? How are things with you?
    How has trading been treating you this week?@Muhammad Z
    Size flag
    Capri
    @Size H1
    @CapriOkay mate, let me check it out..
    Muhammad Z flag
    Dear brother, please teach us too—how can we market within this?
    Skylark flag
    Muhammad Z
    I'm doing well. How about you? How are things with you?
    @Muhammad ZI'm doing great bro, so tell me how is the market treating you to day?
    Muhammad Z flag
    Brother, I’m new here; I don’t know about this.
    Muhammad Z flag
    Brother, tell us the method too.
    5934746 flag
    price has become unpredictable
    Skylark flag
    Muhammad Z
    Dear brother, please teach us too—how can we market within this?
    @Muhammad Zokay I'll advise you to go to the fast bull educational website
    Size flag
    Size flag
    Size
    @CapriDo you mean this FVG mate? This is what I'm watching mate..
    5934225 flag
    Size
    @Size draw a bearish flag there
    Muhammad Z flag
    Sorry brother, please tell me the complete procedure for this.
    Skylark flag
    What is an Indicator
    Traders can anticipate the price movements in the forex market by using the Moving Average (MA), Relative Strength Index (RSI) and other technical indicators.
    Videos
    Muhammad Z flag
    Brother, could you tell me how I can trade on this? Is this app reliable or not?
    Huynh Thao flag
    các tinh sấu đã ra hết vàng va bạc sắp tăng mạnh
    Size flag
    Muhammad Z
    Dear brother, please teach us too—how can we market within this?
    @Muhammad ZOf course, brother. We can all learn from each other
    Size flag
    Muhammad Z
    Brother, I’m new here; I don’t know about this.
    What exactly are you trying to understand about the market?@Muhammad Z
    Muhammad Z flag
    Brother, this is my first time here, so I don't know how to make a deposit.
    Type here...
    Add Symbol or Code

      No matching data

      All
      Recommend
      Stocks
      Cryptocurrencies
      Central Banks
      Trump Updates
      Featured News
      • All
      • Russia-Ukraine Conflict
      • Middle East Flashpoint
      • All
      • Russia-Ukraine Conflict
      • Middle East Flashpoint
      Search
      Products

      Charts Free Forever

      Chats Q&A with Experts
      Screeners Economic Calendar Data Tools
      Membership Features
      Data Warehouse Market Trends Institutional Data Policy Rates Macro

      Market Trends

      Market Sentiment Order Book Forex Correlations

      Top Indicators

      Charts Free Forever
      Markets

      News

      24/7 Analysis Education

      Latest Views

      Latest Update

      Signals

      Copy Rankings Latest Signals Become a signal provider AI Rating
      Contests
      Brokers

      Overview Brokers Assessment Rankings Regulators News Claims
      Broker listing Forex Brokers Comparison Tool Live Spread Comparison Scam
      Q&A Complaint Scam Alert Videos Tips to Detect Scam
      More

      Business
      Events
      Careers About Us Advertising Help Center

      White Label

      Broker API

      Data API

      Web Plug-ins

      Affiliate Program

      Awards Institution Evaluation IB Seminar Salon Event Exhibition
      Vietnam Thailand Singapore Dubai
      Fans Party Investment Sharing Session
      FastBull Summit BrokersView Expo
      Recent Searches
        Top Searches
          Markets
          Analysis
          User
          24/7
          Economic Calendar
          Education
          Data
          • Names
          • Latest
          • Prev

          View All

          No data

          Scan to Download

          Faster Charts, Chat Faster!

          Download
          English
          • English
          • Español
          • العربية
          • Bahasa Indonesia
          • Bahasa Melayu
          • Tiếng Việt
          • ภาษาไทย
          • Français
          • Italiano
          • Türkçe
          • Русский язык
          • 简中
          • 繁中
          Open Account
          Search
          Products
          Charts Free Forever
          Markets
          News
          Signals

          Copy Rankings Latest Signals Become a signal provider AI Rating
          Contests
          Brokers

          Overview Brokers Assessment Rankings Regulators News Claims
          Broker listing Forex Brokers Comparison Tool Live Spread Comparison Scam
          Q&A Complaint Scam Alert Videos Tips to Detect Scam
          More

          Business
          Events
          Careers About Us Advertising Help Center

          White Label

          Broker API

          Data API

          Web Plug-ins

          Affiliate Program

          Awards Institution Evaluation IB Seminar Salon Event Exhibition
          Vietnam Thailand Singapore Dubai
          Fans Party Investment Sharing Session
          FastBull Summit BrokersView Expo

          Bearish Signs Intensify for Chinese Stocks Ahead of Third Plenum

          Alex

          Economic

          Stocks

          Summary:

          Hang Seng China Enterprises Index down over 9% from May high. MSCI China, Hang Seng Tech gauges already entered corrections.

          Bearish signals are mounting for Chinese stocks ahead of one of the country’s biggest annual policy meetings.
          The Hang Seng China Enterprises Index fell 1.5% on Monday, taking its decline from a May 20 high to over 9% and putting it near a technical correction. On the mainland, the CSI 300 Index slid for a fifth session. That followed a seventh week of losses on Friday, its longest losing run since early 2012.
          Bearish Signs Intensify for Chinese Stocks Ahead of Third Plenum_1
          A rally in Chinese equities that began earlier this year has lost momentum due to an uneven economic recovery and growing concern over likely geopolitical risks from elections in Europe and the US. Investors don’t expect a quick boost for stocks from the Third Plenum, the July 15-18 meeting that will gather some 400 government bigwigs, military chiefs, provincial bosses and academics in Beijing to steer the country’s political and economic course.
          Stimulus so far has had only minimal impact on the nation’s ailing property sector or consumer confidence.
          “The Chinese domestic economy remains soft and there’s little expectation for stimulus from the third Plenum,” said Xin-Yao Ng, director of investment at abrdn Asia Ltd. “There is some negative sentiment from the elections in Europe with uncertainties around its attitude toward China with more left-wing parties taking influence.”
          Sentiment is particularly fragile among Chinese onshore investors. The CSI 300 index has erased all gains this year, and the Shanghai Stock Exchange Composite Index has been trading below 3,000 points — a key psychological level — since June 21. Small-cap stocks, a segment Goldman Sachs says is particularly vulnerable to slowing economic growth, have been hit particularly hard this year.
          Meanwhile, there are signs that the so-called national team may have stepped in recently to boost confidence ahead of the plenum. Some exchange traded funds favored by China’s sovereign wealth fund have seen large inflows since the Shanghai stock gauge fell below the 3,000 level. State funds were crucial in stabilizing the stock market when that index plunged in a February rout.
          “Investors are staying on top of macro and policy developments in China but feel no rush to return to the market despite record-low exposure in recent years,” Morgan Stanley strategists including Laura Wang wrote in a note following their recent US marketing trip. “Currency weakness, geopolitical uncertainty, and China’s macro challenges remain near-term hurdles.”
          Still, cheap valuations and global funds’ light positioning in Chinese equities create a favorable set up for a rebound if there are positive surprises from the policy meetings and the Federal Reserve’s interest-rate path. About a third of 19 Asia-based strategists and fund managers surveyed informally by Bloomberg News said they see Chinese stocks, together with Indian peers, as likely outperformers in Asia in the second half of the year.
          MSCI Inc.’s key gauge of Chinese stocks fell into a technical correction at the end of June, while a Bloomberg Intelligence measure of developer shares has lost more than 30% from its May high. The Hang Seng Tech Index too has entered a correction.

          Source:Bloomberg

          To stay updated on all economic events of today, please check out our Economic calendar
          Risk Warnings and Disclaimers
          You understand and acknowledge that there is a high degree of risk involved in trading. Following any strategies or investment methods may lead to potential losses. The content on the site is provided by our contributors and analysts for information purposes only. You are solely responsible for determining whether any trading assets, securities, strategy, or any other product is suitable for investing based on your own investment objectives and financial situation.
          Add to Favorites
          Share
          FastBull
          Copyright © 2026 FastBull Ltd

          728 RM B 7/F GEE LOK IND BLDG NO 34 HUNG TO RD KWUN TONG KLN HONG KONG

          TelegramInstagramTwitterfacebooklinkedin
          App Store Google Play Android Windows
          Products
          Charts

          Chats

          Q&A with Experts
          Screeners
          Economic Calendar
          Data
          Tools
          Membership
          Features
          Function
          Markets
          Copy Trading
          Latest Signals
          Contests
          24/7
          Analysis
          Education
          Company
          Careers
          About Us
          Contact Us
          Advertising
          Download FastBull
          Help Center
          Feedback
          User Agreement
          Privacy Policy
          Personal Information Protection Statement
          Business

          White Label

          Broker API

          Data API

          Web Plug-ins

          Poster Maker

          Affiliate Program

          Risk Disclosure

          The risk of loss in trading financial instruments such as stocks, FX, commodities, futures, bonds, ETFs and crypto can be substantial. You may sustain a total loss of the funds that you deposit with your broker. Therefore, you should carefully consider whether such trading is suitable for you in light of your circumstances and financial resources.

          No decision to invest should be made without thoroughly conducting due diligence by yourself or consulting with your financial advisors. Our web content might not suit you since we don't know your financial conditions and investment needs. Our financial information might have latency or contain inaccuracy, so you should be fully responsible for any of your trading and investment decisions. The company will not be responsible for your capital loss.

          Without getting permission from the website, you are not allowed to copy the website's graphics, texts, or trademarks. Intellectual property rights in the content or data incorporated into this website belong to its providers and exchange merchants.

          Not Logged In

          Log in to access more features

          Connect Broker
          Become a signal provider
          Help Center
          Customer Service
          Dark Mode
          Price Up/Down Colors

          Log In

          Sign Up

          Position
          Layout
          Fullscreen
          Default to Chart
          The chart page opens by default when you visit fastbull.com