


- GBPUSD
- XAUUSD
- XAGUSD
- WTI
- USDX


Markets
Analysis
User
24/7
Economic Calendar
Education
Data
- Names
- Latest
- Prev


Those who hoped that Friday's sharp drop in gold and silver prices — which shed 9% off gold and 27% off silver — would slow this Monday woke up to another nightmare this morning.
Those who hoped that Friday's sharp drop in gold and silver prices — which shed 9% off gold and 27% off silver — would slow this Monday woke up to another nightmare this morning. Both metals are heavily sold in Asia, suggesting that leveraged positions and stop losses have not yet been fully cleared.
There has been a lot of speculation in recent weeks, and that speculative air is now coming out quite violently.
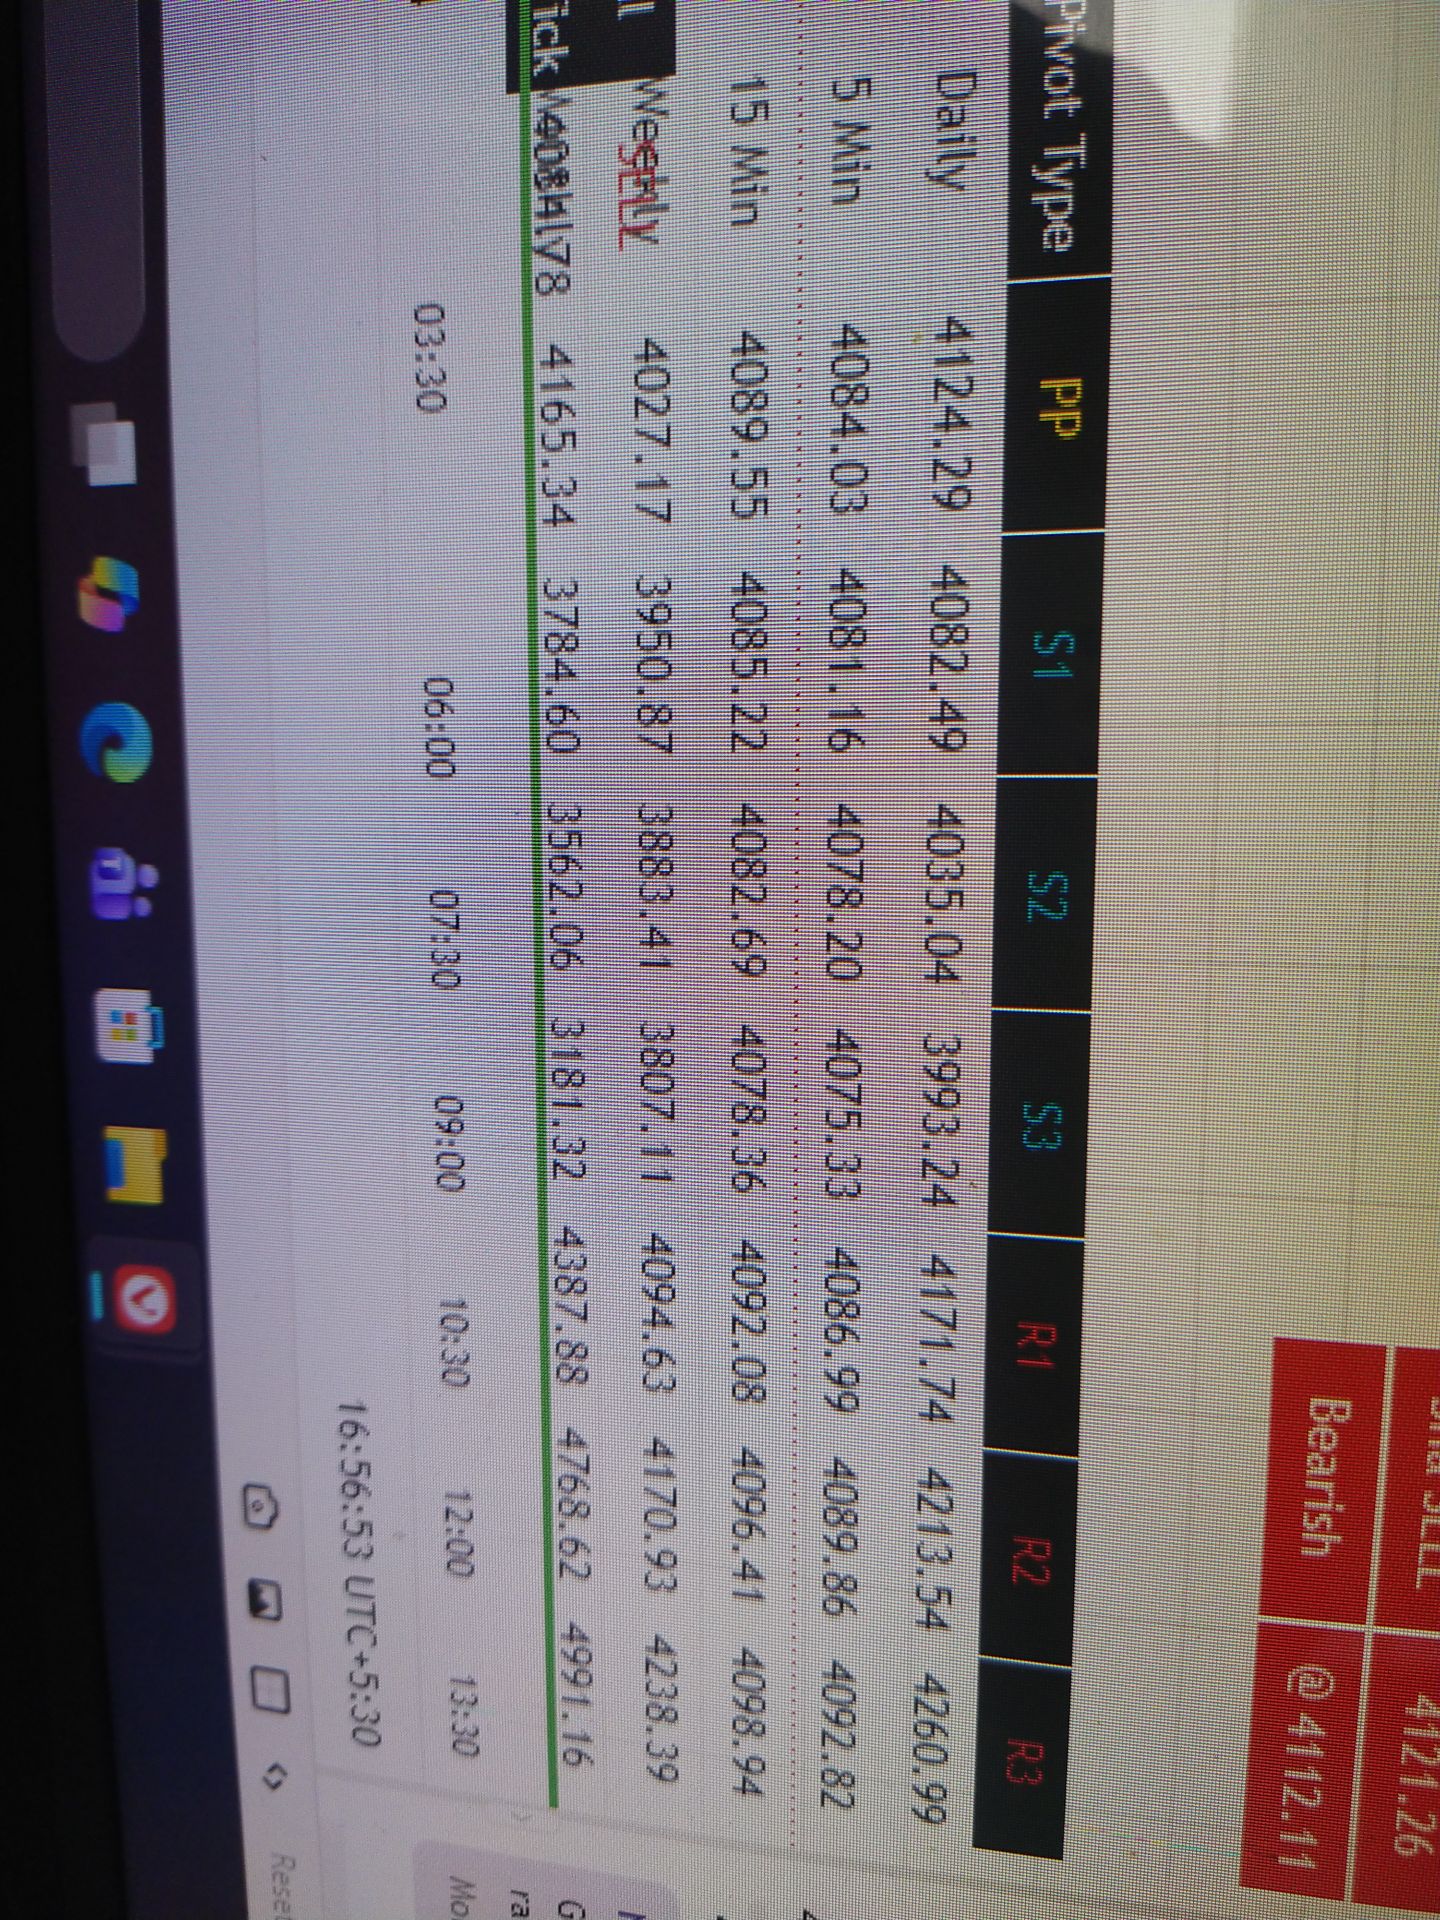
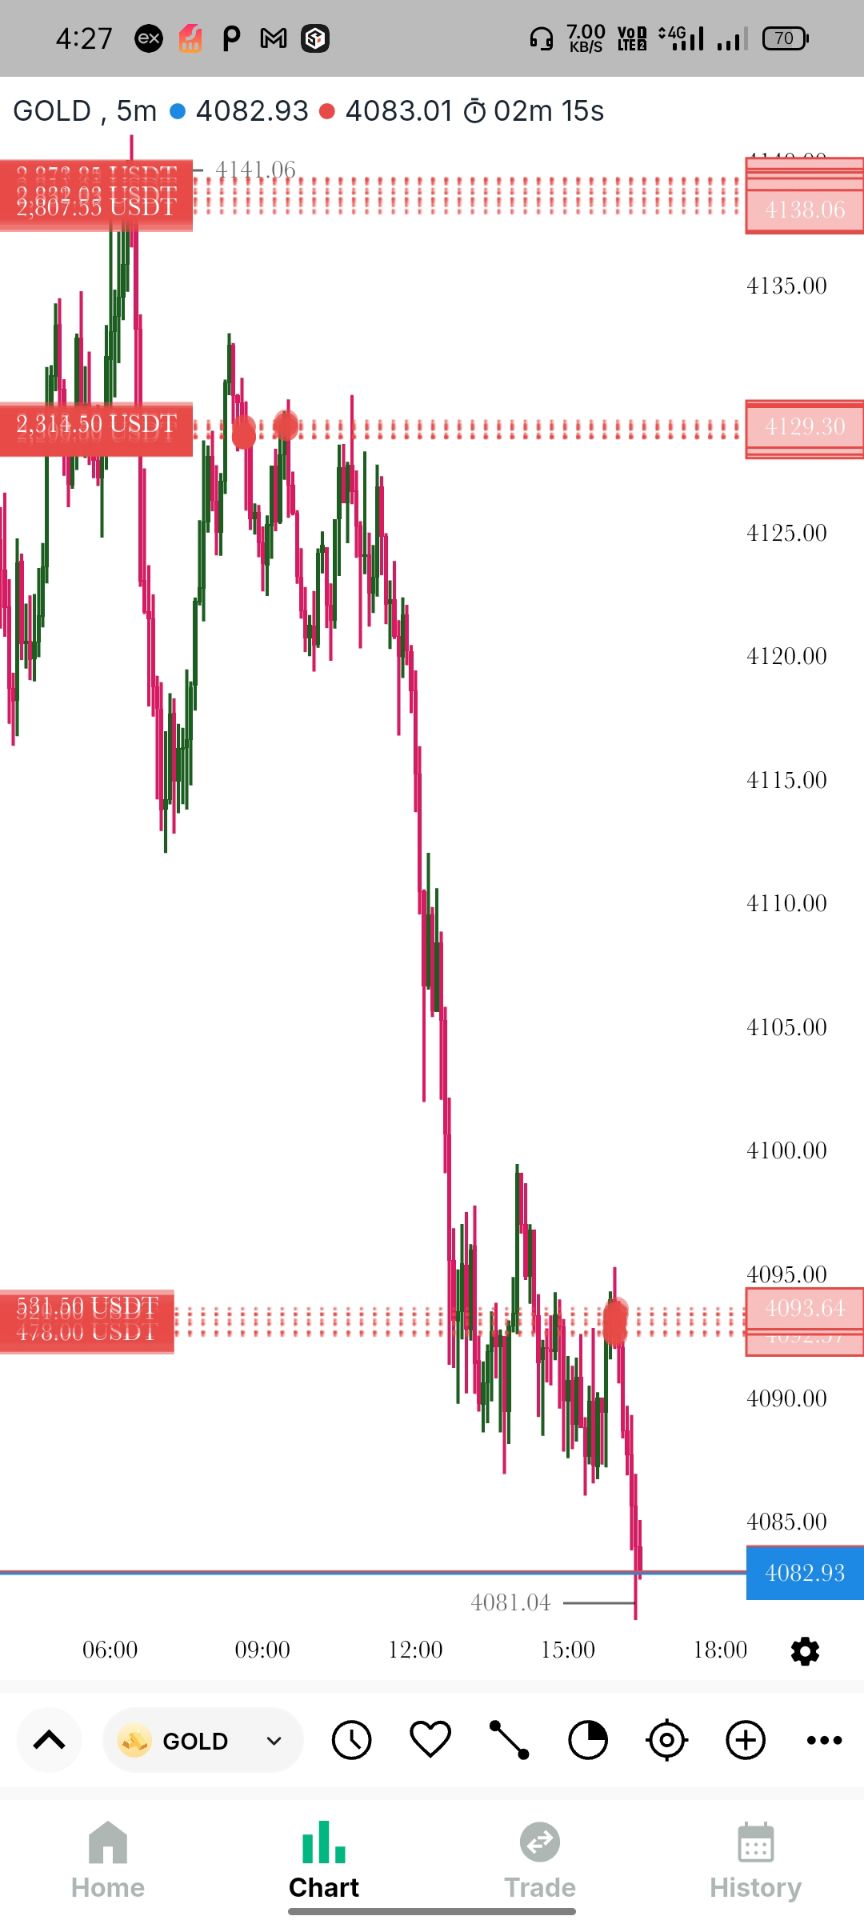
Looking at levels, for gold, I had been pointing to a possible correction toward the $4'600–4'800 range in the event of a sell-off, and we are hovering near $4'600 per ounce support this morning. I must admit that the sell-off has been far more brutal than I — and many — expected. This morning, the minor 23.6% Fibonacci retracement from October 2023 to last week has been cleared.
Given the high volatility and the size of leveraged positions, the sell-off could deepen toward the 50-DMA (currently near $4'480) and potentially further to the 200-DMA (currently near $4'235). The key technical level I am watching sits lower, at $4'115 — the major 38.2% Fibonacci retracement of the rally since late 2023. This level should hold if the "Sell America, Sell the Dollar" theme remains in play amid waning trust in White House trade and geopolitical policies.
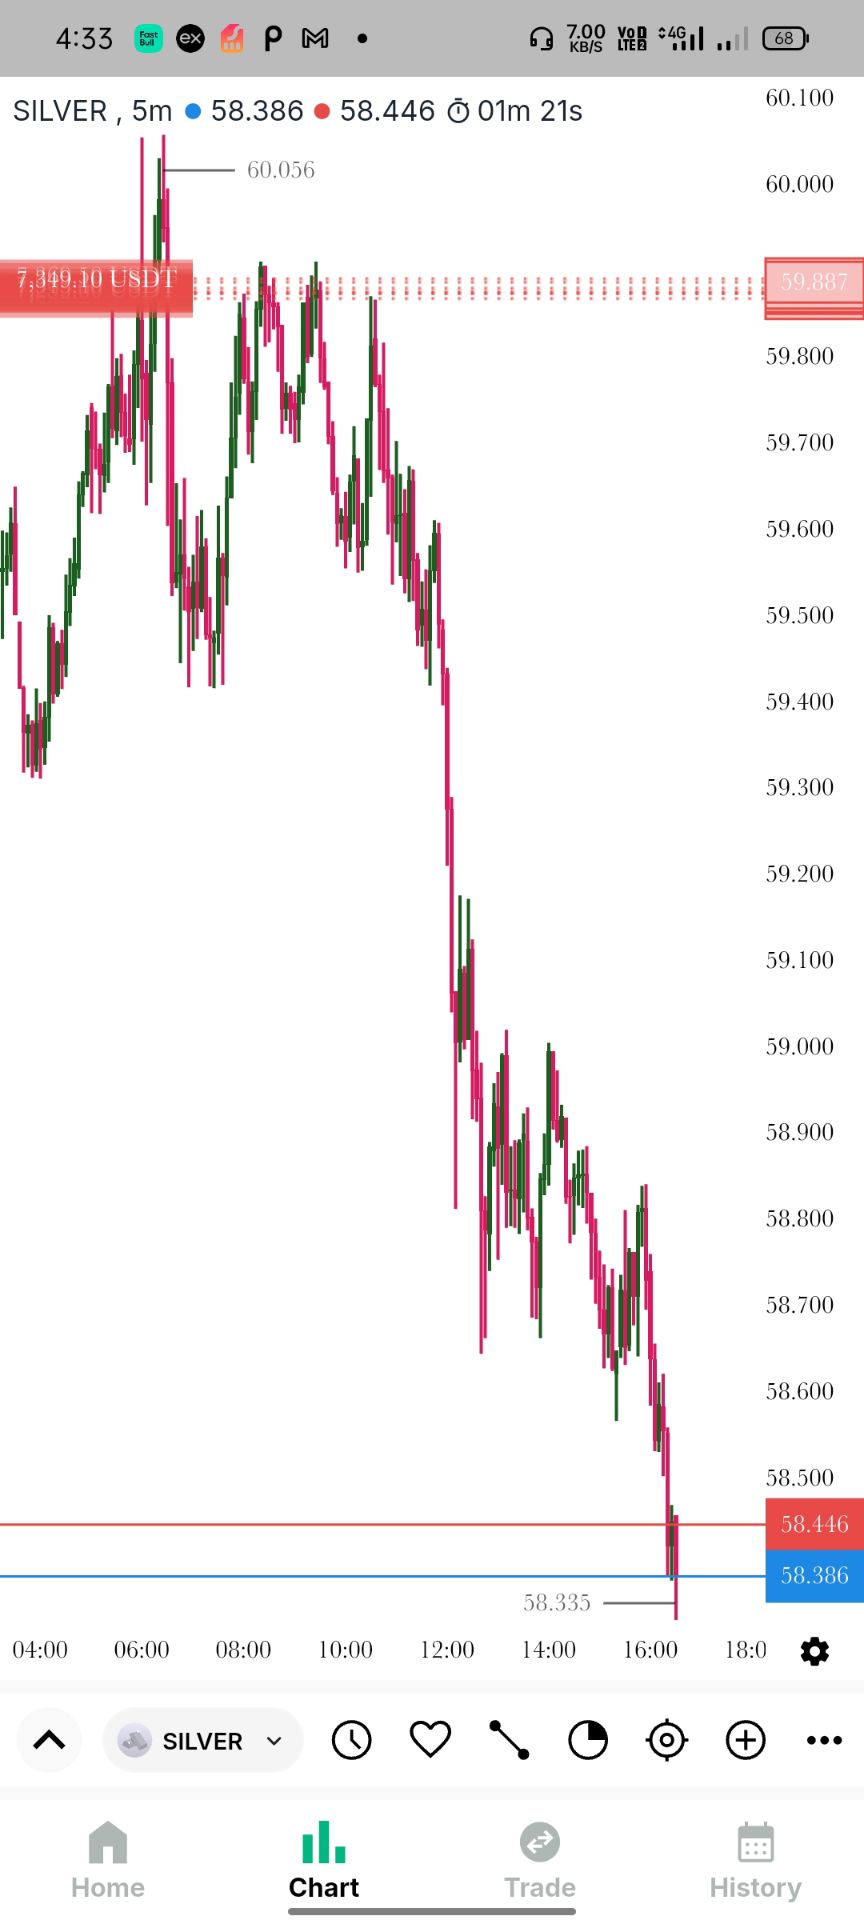
For silver, the rally on the way up was faster than gold's, so the correction on the way down is faster too. Silver was down more than 26% on Friday, another 13% this morning, and losses are being printed faster than I can finish my sentence. Overall, it has given back nearly 40% since last week's peak at the time of writing.
More importantly, silver has slipped below two key technical levels: the 50-DMA and the major 38.2% Fibonacci retracement. The latter suggests silver has entered a bearish consolidation phase, with the risk of deeper losses before the correction slows.
How deep? The next key level is the 50% retracement, just below $70 per ounce — a psychological level that could act as a speed bump and attract dip buyers. Below that, the major 61.8% retracement at $57.80 per ounce would be another level to watch.
Whether the latest sell-off in metals becomes an opportunity for a fresh start — especially for those who missed the rally — will depend on several factors, including the US dollar.
The US dollar has been better bid since Friday, with the dollar index rebounding around 1% off four-year lows following news that the Federal Reserve may have a new Chair. Kevin Warsh was chosen to be the next Fed President and will replace Jerome Powell if confirmed.
The nomination ends months of speculation over who would lead the Fed next and offers clues about the future policy direction. Based on his past views, Mr Warsh has been critical of the Fed's leadership and its relentlessly expanding balance sheet. He has also voiced strong concerns about inflation eroding purchasing power while inflating asset prices.
As such, he is expected to favour balance sheet reduction for bringing inflation down. And there is scope to shrink the Fed's balance sheet substantially! Before 2008, the balance sheet stood below $1 trillion, peaked near $9 trillion in 2022, and now sits around $6.5 trillion. That could mark the end of the era of free money for markets — and that is bad news.
A balance sheet reduction could pose a major challenge for long-dated US bonds and US equity indices that have enjoyed a multi-decade climb. The knee-jerk reaction to the Warsh news was a spike in the US 10-year yield, which has eased this morning, partly as flows exit metals. But over a longer horizon — 12 months and beyond — a smaller Fed balance sheet would add upward pressure on long maturity yields.
Regarding rate cuts… the market reaction in the US 2-year yield suggests markets still expect rate cuts, betting that balance sheet reduction — combined with AI-driven productivity gains — could ultimately lower inflation. I won't lie: I agree. The Fed's monstrous balance sheet was always going to be addressed. It just might be happening now.
So what does that mean for equities? Could lower rates offset the impact of a smaller Fed balance sheet? It all depends on how quickly that balance sheet shrinks. The US — and global — economy has become deeply addicted to central bank buying, and weaning markets off free money could be so painful that some think the Fed's balance sheet could ultimately end up larger under Warsh than before. Time will tell.
US equities are poised to start the week with a sharp sell-off, despite falling yields. Risk-off dominates the narrative — ironically triggered in part by the collapse in gold. If gold cannot protect investors during a sell-off, what can?
The Swiss franc? The USDCHF is trading below 0.78, raising questions about whether negative rates could return in Switzerland this year.
Elsewhere, the European Central Bank (ECB) and the Bank of England (BoE) are expected to stand pat this week, while the Reserve Bank of Australia (RBA) is expected to hike. Policy divergence should create attractive FX opportunities.
In equities, it is a heavy earnings week: Palantir and Disney today, AMD tomorrow, Google and Qualcomm on Wednesday, and Amazon on Thursday. Even strong results from Meta, Microsoft and Apple have failed to fully revive bullish sentiment. Investors are increasingly selective, scrutinising whether cloud growth is truly AI-driven and whether AI investments are delivering real returns. Earnings will not be a walk in the park.
728 RM B 7/F GEE LOK IND BLDG NO 34 HUNG TO RD KWUN TONG KLN HONG KONG


The risk of loss in trading financial instruments such as stocks, FX, commodities, futures, bonds, ETFs and crypto can be substantial. You may sustain a total loss of the funds that you deposit with your broker. Therefore, you should carefully consider whether such trading is suitable for you in light of your circumstances and financial resources.
No decision to invest should be made without thoroughly conducting due diligence by yourself or consulting with your financial advisors. Our web content might not suit you since we don't know your financial conditions and investment needs. Our financial information might have latency or contain inaccuracy, so you should be fully responsible for any of your trading and investment decisions. The company will not be responsible for your capital loss.
Without getting permission from the website, you are not allowed to copy the website's graphics, texts, or trademarks. Intellectual property rights in the content or data incorporated into this website belong to its providers and exchange merchants.
Not Logged In
Log in to access more features


Log In
Sign Up


