


- USDX
- XAUUSD
- XAGUSD
- WTI


Markets
Analysis
User
24/7
Economic Calendar
Education
Data
- Names
- Latest
- Prev


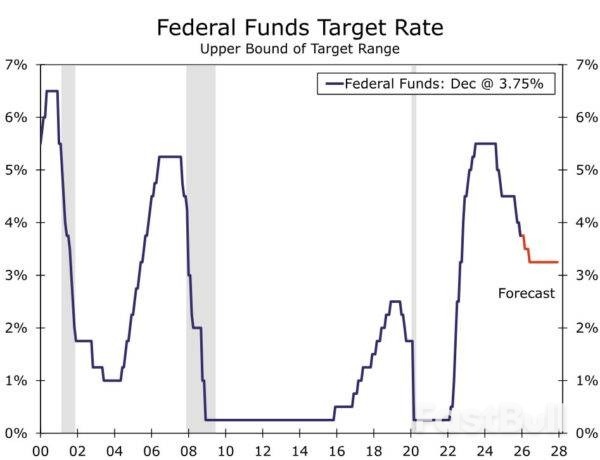
As expected, the FOMC reduced the fed funds target range by 25 bps to 3.50%-3.75% and signaled that additional easing will face a higher bar at its next meeting on January 28.
As expected, the FOMC reduced the fed funds target range by 25 bps to 3.50%-3.75% at the conclusion of its December meeting. As was also anticipated, the decision was not unanimous. Three voting members did not support the policy decision, with dissents registered in both a more hawkish and dovish direction. Specifically, Governor Miran dissented in favor of a steeper, 50 bps cut, while Presidents Schmid (Kansas City) and Goolsbee (Chicago) dissented in favor in keeping the policy rate unchanged.
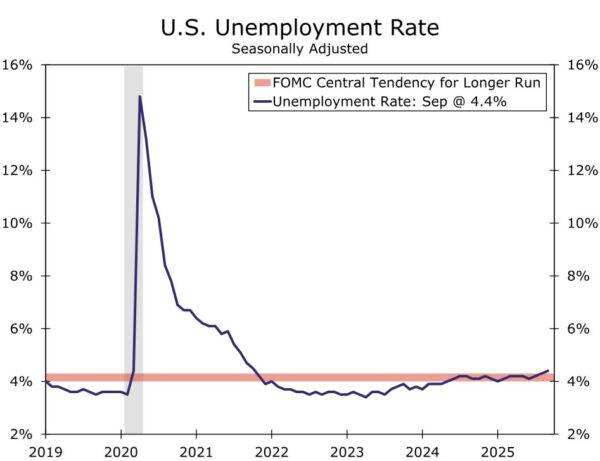
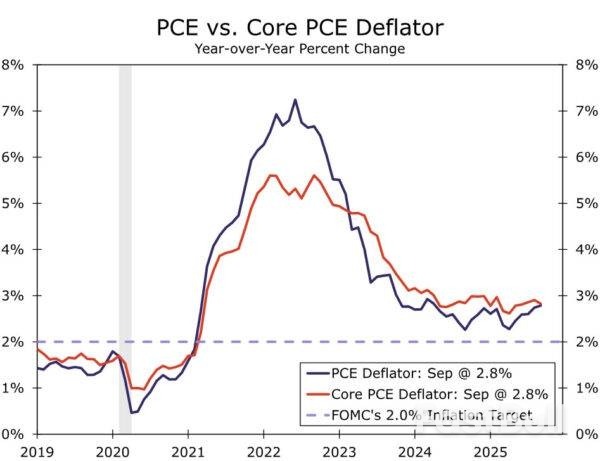
The dispersed views on the best course of action reflect the tricky environment the FOMC finds itself in. The FOMC did not have several key readings on the economy as originally scheduled due to the government shutdown (e.g., Q3 GDP, Oct. & Nov. Employment Situation and CPI, etc.). But, the latest data available continue to indicate some tension in the Committee's employment and inflation mandates (Figures 1 & 2).
With 75 bps of cuts since September and policy not as clearly restrictive, the bar for additional easing has been raised. In the post meeting statement, the Committee gave itself more optionality around future cuts, saying that "In considering the extent and timing of additional adjustments to the target range…", with the emphasized text new to the statement. The suggestion that the FOMC will not be so ready to cut rates again in the near term likely helped to limit the number of hawkish dissents.
The Summary of Economic Projections did signal some broader unease among the Committee besides the two hawkish dissents. The dot plot revealed that six participants in total did not favor reducing the policy rate at today's meeting, implying four non-voting regional presidents also preferred to hold the policy rate steady. Nonetheless, a bias toward further easing persists among the Committee. The median dot for year-end 2026 and 2027 remained at 3.375% and 3.125%, respectively. The longer-run median was unchanged at 3.00%, with the dot plot illustrating that all but two participants see the current policy rate at least somewhat restrictive.
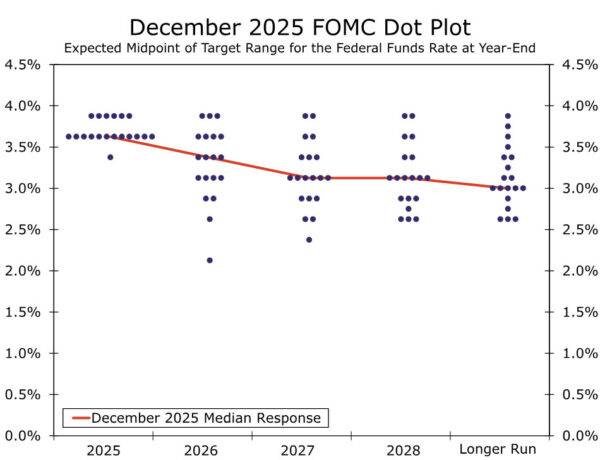
The biggest change to the SEP was a major upward revision to the 2026 growth outlook, with the median projection rising from 1.8% to 2.3%. Some of this change likely reflects the government shutdown, with Q4-2025 real GDP growth expected to see a material drag, setting the economy up for a bounce-back in Q4-2026. That said, this dynamic cannot fully explain the change, and it puts the median FOMC participant closer to our above-consensus forecast of 2.5% real GDP growth next year. Elsewhere, the changes generally were smaller, with some modest downward revisions to the inflation forecasts next year, and no change to the median longer run projections for the real GDP growth and the unemployment rate.
The Federal Reserve also announced that it will begin growing its balance sheet again in the coming days through the purchase of Treasury bills. As we have discussed previously, these purchases are meant to maintain short-term interest rate control, keep bank reserves ample and ensure the smooth functioning of financial markets. Fed officials have been clear for months that this step in no way represents a change in the stance of monetary policy. We agree with this assessment, and the beginning of reserve management purchases (RMPs) will have no bearing on our view of the stance of monetary policy.
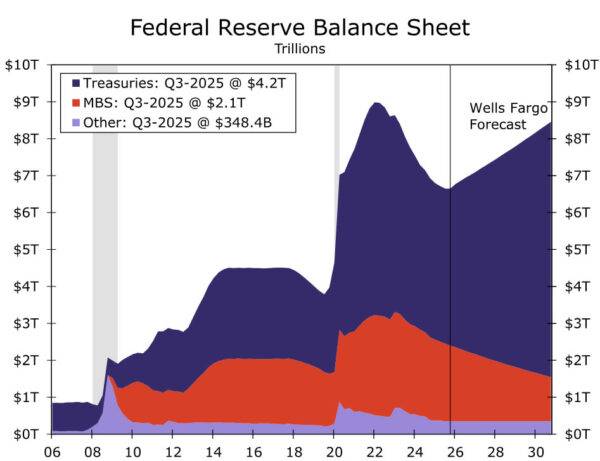
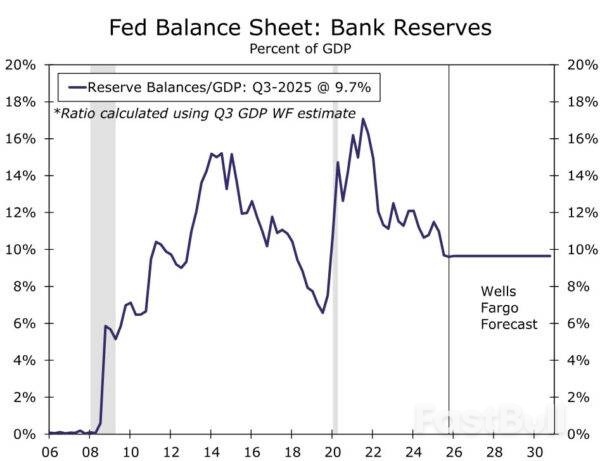
Specifically, the central bank announced that RMPs will begin on December 12 with an initial pace of $40 billion for the month. The post-meeting guidance stated that "the pace of RMPs will remain elevated for a few months to offset expected large increases in non-reserve liabilities in April. After that, the pace of total purchases will likely be significantly reduced in line with expected seasonal patterns in Federal Reserve liabilities." Our working assumption has been that the medium term, "equilibrium" pace of RMPs will be $25 billion per month to keep bank reserves ample. We read the above guidance as indicating that RMPs will downshift to roughly this pace starting in the spring. If realized, the Fed's balance sheet will grow by roughly $370 billion in 2026, and the reserve-to-GDP ratio will be 9.7% at the end of next year, comfortably above the lows in September 2019 when repo markets blew up (Figure 6).
Our base case remains that the current easing cycle is not over yet but rather that it is entering a slower phase. While the labor market is far from collapsing, the softening in conditions to the wrong side of "maximum employment" supports policy returning to a more neutral position. Directional progress on inflation next year should resume as the initial lift from tariffs fade, which would reduce the tension between the FOMC's employment and inflation mandate. We continue to look for two 25 bps rate cuts next year at the March and June meetings. Next week's economic data, specifically the "one and a half" employment report on Tuesday and the November CPI on Thursday, will be key to the outlook. We will have reports out previewing these data releases in the coming days.
728 RM B 7/F GEE LOK IND BLDG NO 34 HUNG TO RD KWUN TONG KLN HONG KONG


The risk of loss in trading financial instruments such as stocks, FX, commodities, futures, bonds, ETFs and crypto can be substantial. You may sustain a total loss of the funds that you deposit with your broker. Therefore, you should carefully consider whether such trading is suitable for you in light of your circumstances and financial resources.
No decision to invest should be made without thoroughly conducting due diligence by yourself or consulting with your financial advisors. Our web content might not suit you since we don't know your financial conditions and investment needs. Our financial information might have latency or contain inaccuracy, so you should be fully responsible for any of your trading and investment decisions. The company will not be responsible for your capital loss.
Without getting permission from the website, you are not allowed to copy the website's graphics, texts, or trademarks. Intellectual property rights in the content or data incorporated into this website belong to its providers and exchange merchants.
Not Logged In
Log in to access more features


Log In
Sign Up


