


- USDX
- XAUUSD
- XAGUSD
- WTI


Markets
Analysis
User
24/7
Economic Calendar
Education
Data
- Names
- Latest
- Prev


With Bitcoin trading roughly 42% below its October 2026 all-time high, sentiment across the crypto market has deteriorated sharply.
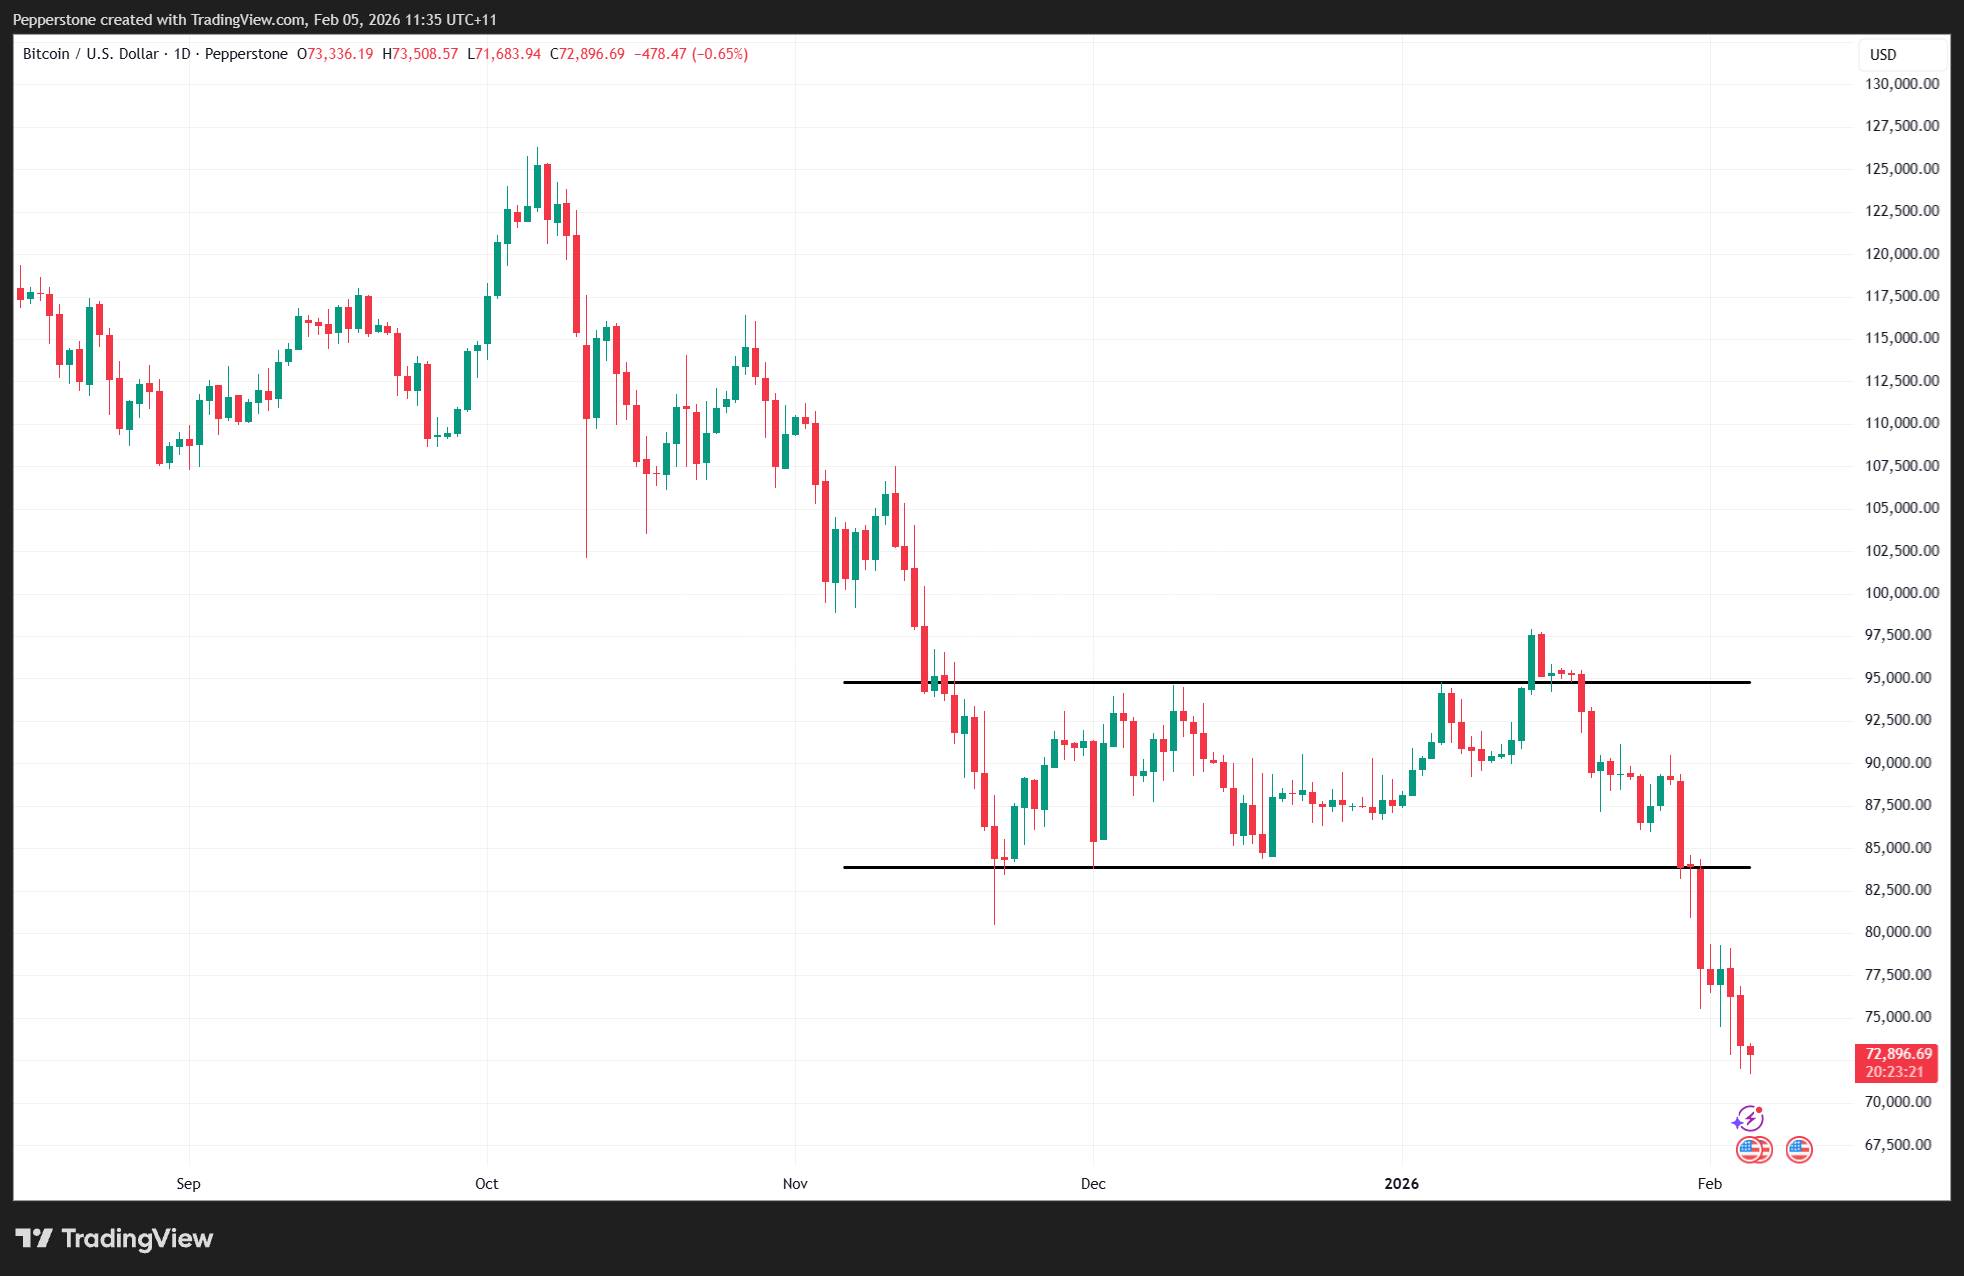
With Bitcoin trading roughly 42% below its October 2026 all-time high, sentiment across the crypto market has deteriorated sharply. In the absence of meaningful near-term catalysts to arrest the bear trend, investors have increasingly focused on crypto treasury entities, particularly those corporates that have issued preference shares or convertible notes and may face capital market constraints in funding dividends or refinancing debt at maturity.
There are now more than 200 listed 'Crypto treasury entities' - companies that have accumulated Bitcoin and/or Ethereum on their balance sheets. Many adopting a relatively simple model, issuing common equity into share price strength and using the proceeds to acquire crypto assets, which are then held as long-term treasury reserves.
Equity-Funded Treasuries Pose Limited Forced-Selling Risk
While many of the larger Bitcoin treasury entities have average entry prices above $100,000 per BTC and are therefore sitting on increasing unrealised losses, those that have not issued convertible notes or preference shares pose limited near-term risk of being forced sellers.
With no fixed cash obligations or refinancing deadlines, these entities can generally continue to hold their Bitcoin or Ethereum through the pronounced drawdowns, with sales only likely for discretionary reasons such as working capital needs or strategic reallocation.
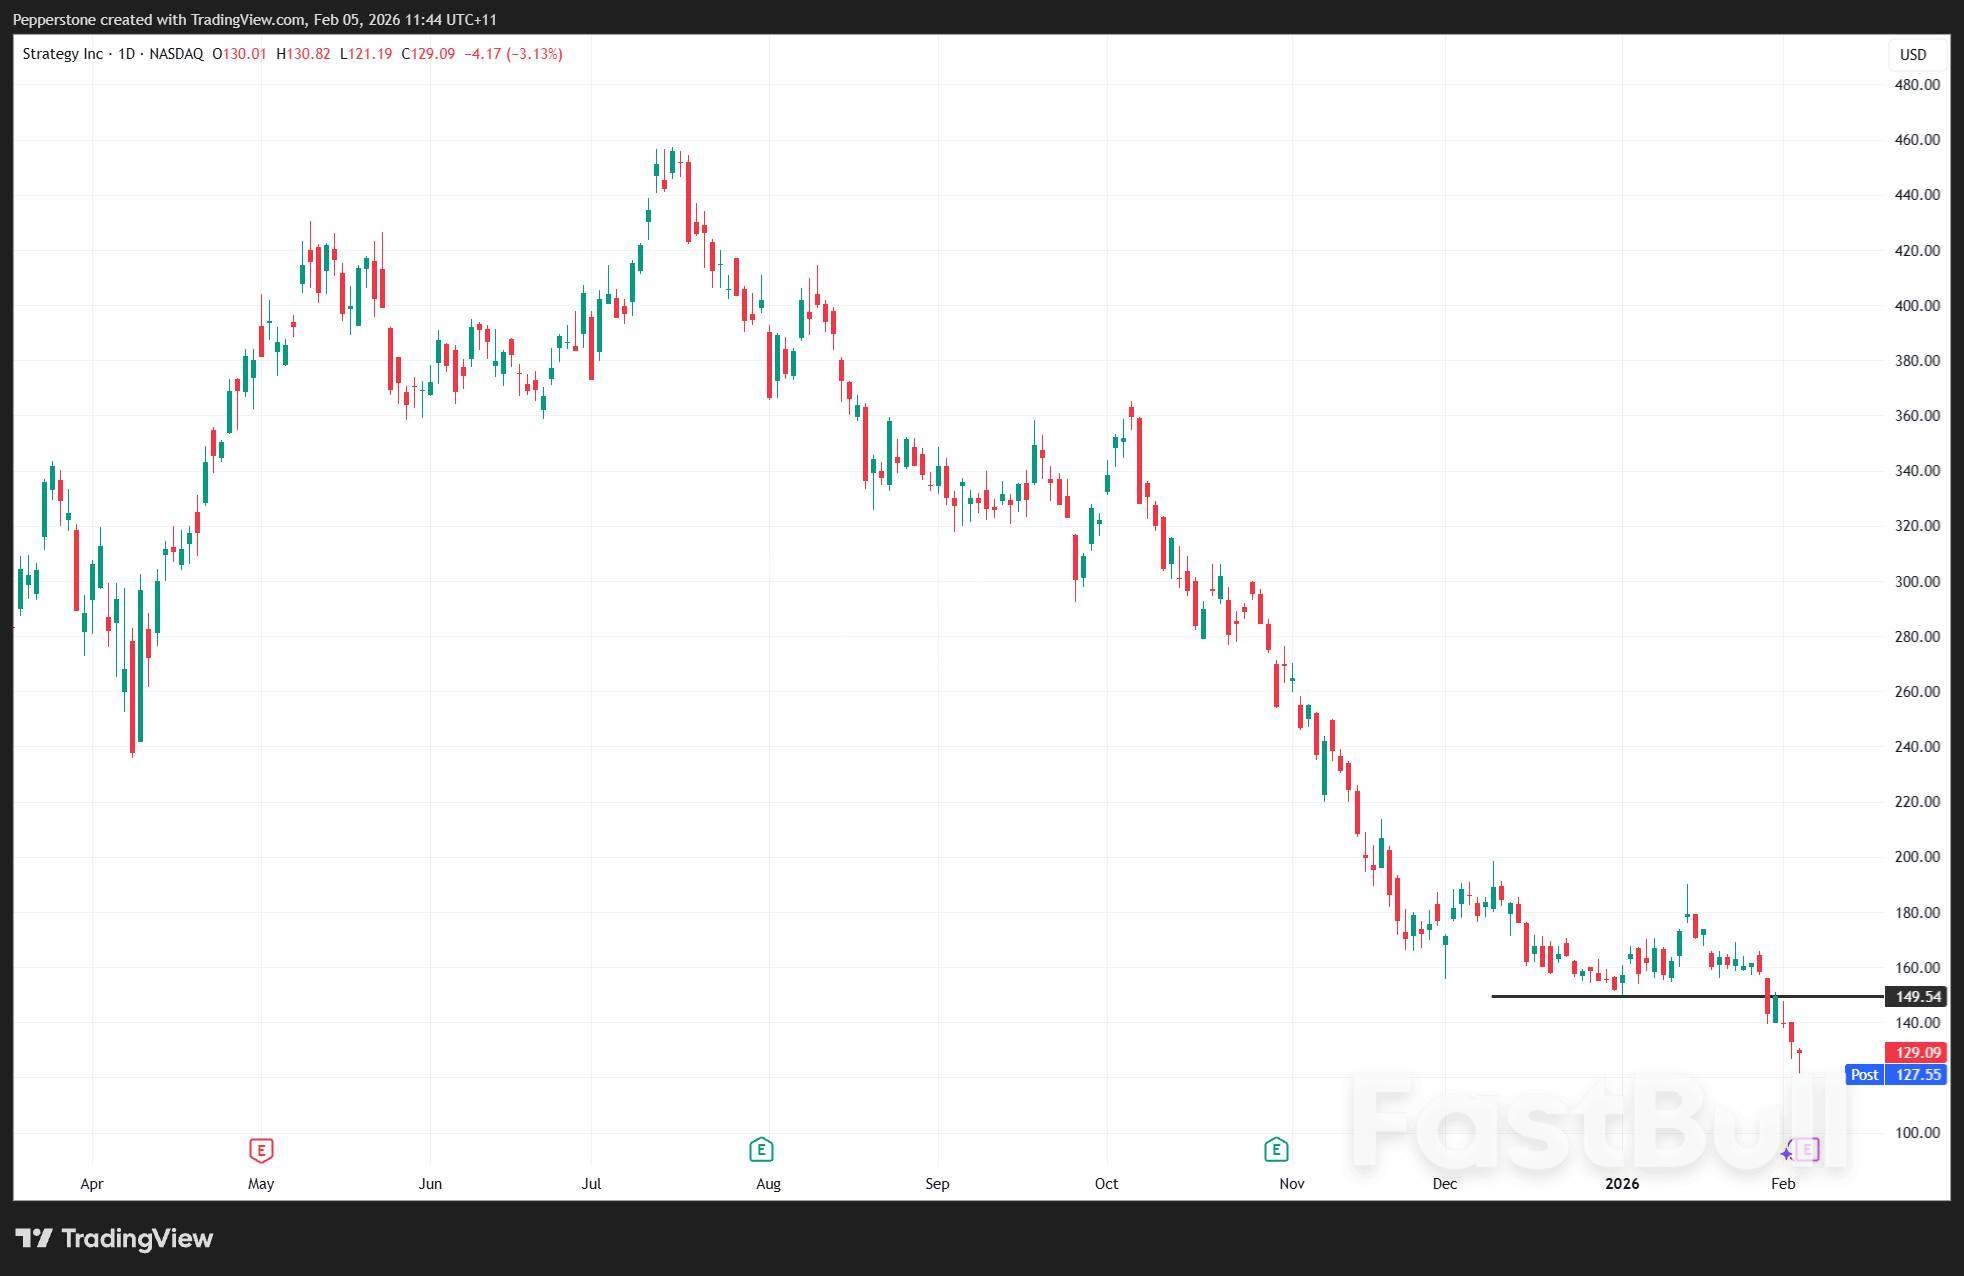
Michael Saylor's Strategy (MSTR) is structurally different from all other crypto treasury entities and is widely viewed as the only player with potential contagion risk for the broader crypto market.
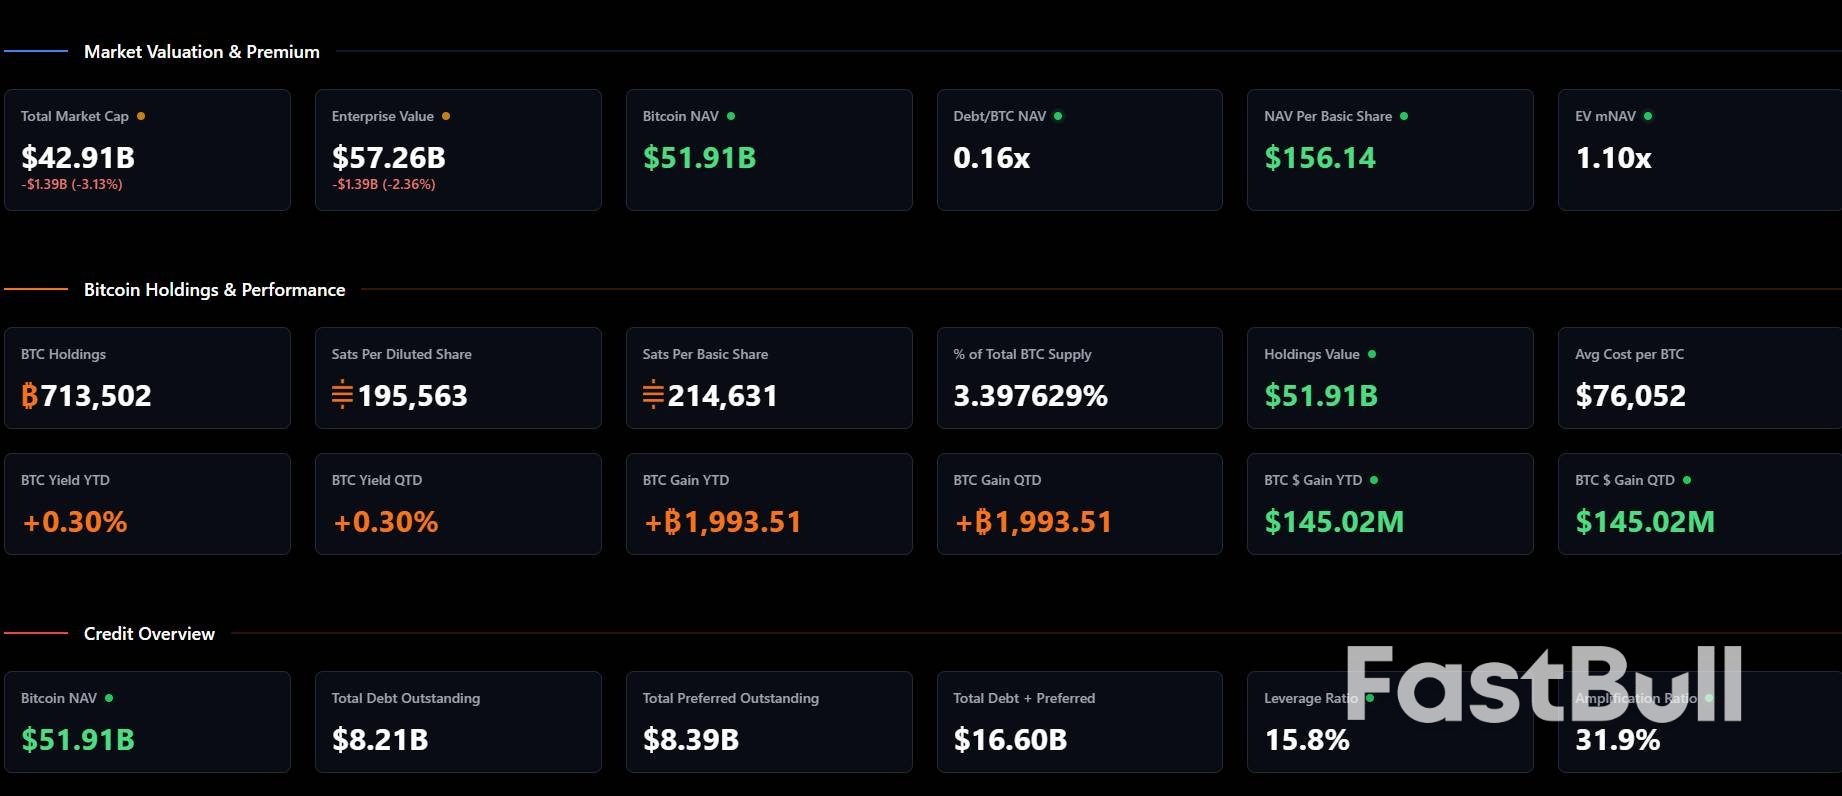
MSTR currently holds 713,502 BTC, representing around 3.4% of the total Bitcoin supply. This makes it by far the dominant corporate holder, with Bitcoin holdings roughly twenty times larger than Metaplanet, the second-largest BTC treasury entity. While Strategy has also issued common equity opportunistically, it has layered leverage on top of its balance sheet through approximately $8.21 billion in convertible notes and $8.39 billion in preference shares.
The five tranches of preference shares pay quarterly dividends, and the sustainability of these payments has become a focal point for the market. In addition, the convertible notes mature between 2028 and 2032, with particular concern centred on the 2028 tranche. If Strategy were unable to refinance or roll these notes, demand for future convertible issuance would likely fall sharply, restricting access to the capital markets.
The core risk scenario is not immediate liquidity stress, but a prolonged decline in Bitcoin prices that coincides with closed capital markets. In such an environment, Strategy could face difficulty issuing equity at attractive levels, raising the possibility of Bitcoin sales to meet obligations.
Given Michael Saylor's role as a symbolic leader of the crypto movement, any sale of Strategy's Bitcoin holdings would likely carry a significant psychological impact and could exacerbate downside pressure across the broader crypto market.
Importantly, Strategy has established a USD reserve of approximately $1.44 billion. This provides a meaningful liquidity buffer and should be sufficient to meet its near-term obligations, including preferred dividends and interest-related costs. As a result, Strategy is highly unlikely to sell any Bitcoin in the near future. That said, the presence of this buffer does not prevent the market from pricing higher long-term structural risk should conditions deteriorate further.
A key metric used to conceptualise balance sheet stress at Strategy is the total EV/mNAV ratio, defined as:
EV/mNAV = (Value of equity + debt + preferred − cash) ÷ (Market value of Bitcoin holdings)
This ratio measures how the market values the entire company and its capital structure relative to the market value of the Bitcoin it holds. Put another way, it approximates investor expectations around recovery value if Strategy were forced to liquidate its assets.
The ratio currently sits around 1.1x. While still above 1, this level still allows Strategy to issue equity at market prices and keeps the model skewed toward further Bitcoin accumulation when conditions permit. It also implies a leveraged response to Bitcoin price moves, meaning a 5% rally in Bitcoin could translate into a 9–10% move in Strategy's equity.
If EV/mNAV were to fall below 1x, it would likely signal:
• Growing concern among equity holders about dilution at unattractive prices
• Doubts around the sustainability of preferred dividends • Rising concerns over the ability to refinance convertible debt at maturity
• Capital market access becoming constrained
• A perception that leverage is now working against shareholders
• Convertible notes being treated as pure debt, with heightened refinancing risk
Strategy is not facing imminent forced selling risk, thanks to its USD liquidity buffer and long-dated liabilities. However, it remains uniquely exposed to prolonged Bitcoin weakness and capital market closure. This structural difference is why Strategy continues to trade as a leveraged proxy for Bitcoin sentiment and why its EV/mNAV ratio remains one of the most closely watched indicators in the crypto market. If the market really ramped up expectations that they would have no choice but to sell down its BTC holdings, that could be a big psychological blow to the crypto movement – of course, if the BTC price can reverse higher, then the opposite will be true, and MSTR and the BTC treasury entities will take advantage of the share price strength and provide a meaningful additional catalyst to the price.
728 RM B 7/F GEE LOK IND BLDG NO 34 HUNG TO RD KWUN TONG KLN HONG KONG


The risk of loss in trading financial instruments such as stocks, FX, commodities, futures, bonds, ETFs and crypto can be substantial. You may sustain a total loss of the funds that you deposit with your broker. Therefore, you should carefully consider whether such trading is suitable for you in light of your circumstances and financial resources.
No decision to invest should be made without thoroughly conducting due diligence by yourself or consulting with your financial advisors. Our web content might not suit you since we don't know your financial conditions and investment needs. Our financial information might have latency or contain inaccuracy, so you should be fully responsible for any of your trading and investment decisions. The company will not be responsible for your capital loss.
Without getting permission from the website, you are not allowed to copy the website's graphics, texts, or trademarks. Intellectual property rights in the content or data incorporated into this website belong to its providers and exchange merchants.
Not Logged In
Log in to access more features


Log In
Sign Up


