• Trade
  • Markets
  • Copy
  • Contests
  • News
  • 24/7
  • Calendar
  • Q&A
  • Chats
Trending
Screeners
SYMBOL
LAST
BID
ASK
HIGH
LOW
NET CHG.
%CHG.
SPREAD
SPX
S&P 500 Index
6878.48
6878.48
6878.48
6882.04
6855.73
+43.98
+ 0.64%
--
DJI
Dow Jones Industrial Average
48362.67
48362.67
48362.67
48457.47
48201.93
+227.79
+ 0.47%
--
IXIC
NASDAQ Composite Index
23428.82
23428.82
23428.82
23476.50
23362.93
+121.19
+ 0.52%
--
USDX
US Dollar Index
97.590
97.670
97.590
97.890
97.480
-0.310
-0.32%
--
EURUSD
Euro / US Dollar
1.17858
1.17865
1.17858
1.18018
1.17498
+0.00245
+ 0.21%
--
GBPUSD
Pound Sterling / US Dollar
1.35086
1.35094
1.35086
1.35184
1.34440
+0.00478
+ 0.36%
--
XAUUSD
Gold / US Dollar
4487.94
4488.35
4487.94
4497.69
4445.89
+44.79
+ 1.01%
--
WTI
Light Sweet Crude Oil
58.112
58.142
58.112
58.139
57.701
+0.202
+ 0.35%
--

Community Accounts

Signal Accounts
--
Profit Accounts
--
Loss Accounts
--
View More

Become a signal provider

Sell trading signals to earn additional income

View More

Guide to Copy Trading

Get started with ease and confidence

View More

Signal Accounts for Members

All Signal Accounts

Best Return
  • Best Return
  • Best P/L
  • Best MDD
Past 1W
  • Past 1W
  • Past 1M
  • Past 1Y

All Contests

  • All
  • Trump Updates
  • Recommend
  • Stocks
  • Cryptocurrencies
  • Central Banks
  • Featured News
Top News Only
Share

USA Stock Index Futures Add To Losses, S&P 500 E-Mini, NASDAQ 100 And Dow Futures Down 0.2% Each

Share

Guangzhou Futures Exchange: To Adjust Transaction Fees, Price Limits And Margin Requirements For Some Platinum, Palladium And Lithium Carbonate Futures From Dec 25

Share

Canadian Dollar Holds On To Most Of Its Gains After GDP Data, Up 0.4% On The Day At 1.3695 Per USA Dollar

Share

The US Dollar Index Rose Briefly After The Release Of Q3 GDP Data, Currently Trading At 97.99. US Stock Futures Saw Little Movement, With NASDAQ 100 Futures Maintaining A Decline Of Approximately 0.15%. The Yield On The 10-year US Treasury Note Rose Briefly To 4.149%. Spot Gold Fell By About $4 To $4485.51 Per Ounce

Share

USA Dollar Index Ticks Slightly Higher After US GDP Data, Last Down 0.2% On Day At 98.0

Share

Euro Pares Gains Versus US Dollar After Stronger-Than-Expected US GDP Data, Last Up 0.2% At $1.1782

Share

USA Advance Q3 Pce Services Price Index Ex-Energy/Housing +3.4 Percent

Share

USA Advance Q3 Pce Price Index Ex-Food/Energy/Housing +2.7 Percent

Share

US Dollar Trims Losses Versus Yen After US GDP Data, Last Down 0.5% At 156.19 Yen

Share

Guangzhou Futures Exchange: Recently, There Have Been Numerous Uncertainties Affecting Market Operations, Leading To Significant Price Fluctuations In Related Commodities. All Member Units Are Requested To Strengthen Market Risk Prevention Measures, Enhance Investor Education, Remind Investors To Participate In Trading Rationally And Compliantly, And Maintain The Stable Operation Of The Market

Share

[Market Update] Following The Release Of US GDP Data, Spot Gold Fell By $5 In The Short Term, Currently Trading At $4486.58 Per Ounce

Share

Guangzhou Futures Exchange: Effective From The Settlement On December 25, 2025, The Daily Price Limit For Platinum And Palladium Futures Contracts Will Be Adjusted To 10%, And The Trading Margin Requirement Will Be Adjusted To 12%. If The Above-mentioned Daily Price Limit And Trading Margin Requirement Differ From The Currently Implemented Daily Price Limit And Trading Margin Requirement, The Larger Of The Two And The Higher Requirement Will Apply

Share

The Annualized Quarter-on-quarter Growth Rate Of U.S. Personal Consumption Expenditures (Pce) In The Third Quarter Was Revised To 3.5%, Compared With The Expected 2.7% And The Initial Estimate Of 2.5%

Share

US Advance Q3 Core Pce +2.9% (Consensus +2.9%)

Share

Official: US 'Not Satisfied' With M23 Withdrawal From Congo Town

Share

Canada's GDP Fell 0.3% Month-on-month In October, The Largest Contraction Since December 2022, Compared With An Expected Decline Of 0.2% And A Previous Growth Of 0.20%

Share

The Main Shanghai Nickel Futures Contract Rose More Than 5%, Currently Trading At 128,750 Yuan/ton

Share

Ishares Silver Trust Rises 2.1%, Global X Silver Miners ETF Up 2.1%

Share

Spot Silver Rose More Than 2.00% Intraday, Currently Trading At $70.40 Per Ounce. New York Silver Futures Extended Their Gains To 3.00% Intraday, Currently Trading At $70.63 Per Ounce

Share

LME Nickel Rose 4.00% Intraday, Currently Trading At $15,836.70 Per Ton

TIME
ACT
FCST
PREV
U.S. Weekly Total Rig Count

A:--

F: --

P: --

U.S. Weekly Total Oil Rig Count

A:--

F: --

P: --

China, Mainland 5-Year Loan Prime Rate

A:--

F: --

P: --

China, Mainland 1-Year Loan Prime Rate (LPR)

A:--

F: --

P: --

U.K. Current Account (Q3)

A:--

F: --

P: --
U.K. GDP Final YoY (Q3)

A:--

F: --

P: --

U.K. GDP Final QoQ (Q3)

A:--

F: --

P: --
Italy PPI YoY (Nov)

A:--

F: --

P: --

Mexico Economic Activity Index YoY (Oct)

A:--

F: --

P: --

Canada National Economic Confidence Index

A:--

F: --

P: --

Canada Industrial Product Price Index YoY (Nov)

A:--

F: --

P: --
U.S. Chicago Fed National Activity Index (Nov)

A:--

F: --

P: --
Canada Industrial Product Price Index MoM (Nov)

A:--

F: --

P: --
U.S. 2-Year Note Auction Avg. Yield

A:--

F: --

P: --

RBA Monetary Policy Meeting Minutes
Mexico Trade Balance (Nov)

A:--

F: --

P: --

Canada GDP YoY (Oct)

A:--

F: --

P: --

Canada GDP MoM (SA) (Oct)

A:--

F: --

P: --

U.S. Core PCE Price Index Prelim YoY (Q3)

A:--

F: --

P: --

U.S. PCE Price Index Prelim YoY (Q3)

A:--

F: --

P: --

U.S. Annualized Real GDP Prelim (Q3)

A:--

F: --

P: --

U.S. Non-Defense Capital Durable Goods Orders MoM (Excl. Aircraft) (Oct)

A:--

F: --

P: --
U.S. PCE Price Index Prelim QoQ (SA) (Q3)

A:--

F: --

P: --

U.S. Core PCE Price Index Annualized QoQ Prelim (SA) (Q3)

A:--

F: --

P: --

U.S. GDP Deflator Prelim QoQ (SA) (Q3)

A:--

F: --

P: --

U.S. Durable Goods Orders MoM (Excl. Defense) (SA) (Oct)

A:--

F: --

P: --

U.S. Durable Goods Orders MoM (Excl.Transport) (Oct)

A:--

F: --

P: --
U.S. Real Personal Consumption Expenditures Prelim QoQ (Q3)

A:--

F: --

P: --

U.S. Real GDP Annualized QoQ Prelim (SA) (Q3)

A:--

F: --

P: --

U.S. Durable Goods Orders MoM (Oct)

A:--

F: --

P: --
U.S. Weekly Redbook Index YoY

--

F: --

P: --

U.S. Manufacturing Output MoM (SA) (Nov)

--

F: --

P: --

U.S. Manufacturing Capacity Utilization (Nov)

--

F: --

P: --

U.S. Industrial Output YoY (Oct)

--

F: --

P: --

U.S. Industrial Output MoM (SA) (Nov)

--

F: --

P: --

U.S. Capacity Utilization MoM (SA) (Nov)

--

F: --

P: --

U.S. Richmond Fed Manufacturing Shipments Index (Dec)

--

F: --

P: --

U.S. Richmond Fed Services Revenue Index (Dec)

--

F: --

P: --

U.S. Conference Board Consumer Expectations Index (Dec)

--

F: --

P: --

U.S. Conference Board Present Situation Index (Dec)

--

F: --

P: --

U.S. Richmond Fed Manufacturing Composite Index (Dec)

--

F: --

P: --

U.S. Conference Board Consumer Confidence Index (Dec)

--

F: --

P: --

U.S. 5-Year Note Auction Avg. Yield

--

F: --

P: --

U.S. Weekly Total Oil Rig Count

--

F: --

P: --

U.S. Weekly Total Rig Count

--

F: --

P: --

U.S. API Weekly Cushing Crude Oil Stocks

--

F: --

P: --

U.S. API Weekly Crude Oil Stocks

--

F: --

P: --

U.S. API Weekly Refined Oil Stocks

--

F: --

P: --

U.S. API Weekly Gasoline Stocks

--

F: --

P: --

Mexico Unemployment Rate (Not SA) (Nov)

--

F: --

P: --

U.S. MBA Mortgage Application Activity Index WoW

--

F: --

P: --

U.S. Weekly Continued Jobless Claims (SA)

--

F: --

P: --

U.S. Weekly Initial Jobless Claims (SA)

--

F: --

P: --

U.S. Initial Jobless Claims 4-Week Avg. (SA)

--

F: --

P: --

U.S. EIA Weekly Crude Oil Imports Changes

--

F: --

P: --

U.S. EIA Weekly Heating Oil Stock Changes

--

F: --

P: --

Canada Federal Government Budget Balance (Oct)

--

F: --

P: --

Japan Construction Orders YoY (Nov)

--

F: --

P: --

Japan New Housing Starts YoY (Nov)

--

F: --

P: --

Turkey Capacity Utilization (Dec)

--

F: --

P: --

Q&A with Experts
    • All
    • Chatrooms
    • Groups
    • Friends
    EuroTrader flag
    trish
    gbp jpy is on crazy bull
    @trishthe yen has been the sore loser in recent weeks. so it's reaction is massive
    Kung Fu flag
    Lord Yellow Mountain
    @Lord Yellow Mountain😂😂he's got ghost followers
    RPGFX flag
    ifan afian
    b.e hit 3 x wait dulu
    @ifan afianMaybe gold is not ready for the bull move yet
    EuroTrader flag
    Kung Fu flag
    P4J3str4d3s
    @Kung Fuok ok brother
    @P4J3str4d3smy target price is 4479.60
    RPGFX flag
    L5OPZEP94G
    People get annoyed when someone isn't like them, haha. I just need to have money in my pocket, the rest is up to you.
    @L5OPZEP94GDefinitely, we are not here to please people but to make money and fill our pockets
    P4J3str4d3s flag
    @Kung Fuoh ok ok a scalp one
    trish flag
    sell gold guys
    EuroTrader flag
    EuroTrader
    @trishthis is a good trade. they should play out when price raids this the most recent highs and am expecting structure shift lower
    RPGFX flag
    Kung Fu
    @Kung FuDid you sell?
    Kung Fu flag
    P4J3str4d3s
    @Kung Fuoh ok ok a scalp one
    @P4J3str4d3s Yes, exactly. The trend is bullish in the higher time frame, you know.
    HOÀNG LÊ flag
    Silver has risen, will gold rise too?
    Lord Yellow Mountain flag
    L5OPZEP94G
    People get annoyed when someone isn't like them, haha. I just need to have money in my pocket, the rest is up to you.
    @L5OPZEP94G ok i think you should have a mental examination bro. we will help you with the bill. if we catch you sell signal
    Kung Fu flag
    RPGFX
    @RPGFXyes, brother. A very short sell with target price at 4479.60
    RPGFX flag
    HOÀNG LÊ
    Silver has risen, will gold rise too?
    of course gold and silver work hand in hand with each other@HOÀNG LÊ
    EuroTrader flag
    trish
    sell gold guys
    @trishTwo strong positive data for the United states released a few moments ago. This should strengthen the United states dollar
    RPGFX flag
    Kung Fu
    @Kung FuOh, that is a nice scalp
    trish flag
    RPGFX flag
    trish
    @trishWhat do you think was responsible for the bullish move in GBPJPY?
    Kung Fu flag
    trish
    @trishthis is looking good, Brother
    Type here...
    Add Symbol or Code

      No matching data

      All
      Trump Updates
      Recommend
      Stocks
      Cryptocurrencies
      Central Banks
      Featured News
      • All
      • Russia-Ukraine Conflict
      • Middle East Flashpoint
      • All
      • Russia-Ukraine Conflict
      • Middle East Flashpoint

      Search
      Products

      Charts Free Forever

      Chats Q&A with Experts
      Screeners Economic Calendar Data Tools
      Membership Features
      Data Warehouse Market Trends Institutional Data Policy Rates Macro

      Market Trends

      Market Sentiment Order Book Forex Correlations

      Top Indicators

      Charts Free Forever
      Markets

      News

      News Analysis 24/7 Columns Education
      From Institutions From Analysts
      Topics Columnists

      Latest Views

      Latest Views

      Trending Topics

      Top Columnists

      Latest Update

      Signals

      Copy Rankings Latest Signals Become a signal provider AI Rating
      Contests
      Brokers

      Overview Brokers Assessment Rankings Regulators News Claims
      Broker listing Forex Brokers Comparison Tool Live Spread Comparison Scam
      Q&A Complaint Scam Alert Videos Tips to Detect Scam
      More

      Business
      Events
      Careers About Us Advertising Help Center

      White Label

      Data API

      Web Plug-ins

      Affiliate Program

      Awards Institution Evaluation IB Seminar Salon Event Exhibition
      Vietnam Thailand Singapore Dubai
      Fans Party Investment Sharing Session
      FastBull Summit BrokersView Expo
      Recent Searches
        Top Searches
          Markets
          News
          Analysis
          User
          24/7
          Economic Calendar
          Education
          Data
          • Names
          • Latest
          • Prev

          View All

          No data

          Scan to Download

          Faster Charts, Chat Faster!

          Download App
          English
          • English
          • Español
          • العربية
          • Bahasa Indonesia
          • Bahasa Melayu
          • Tiếng Việt
          • ภาษาไทย
          • Français
          • Italiano
          • Türkçe
          • Русский язык
          • 简中
          • 繁中
          Open Account
          Search
          Products
          Charts Free Forever
          Markets
          News
          Signals

          Copy Rankings Latest Signals Become a signal provider AI Rating
          Contests
          Brokers

          Overview Brokers Assessment Rankings Regulators News Claims
          Broker listing Forex Brokers Comparison Tool Live Spread Comparison Scam
          Q&A Complaint Scam Alert Videos Tips to Detect Scam
          More

          Business
          Events
          Careers About Us Advertising Help Center

          White Label

          Data API

          Web Plug-ins

          Affiliate Program

          Awards Institution Evaluation IB Seminar Salon Event Exhibition
          Vietnam Thailand Singapore Dubai
          Fans Party Investment Sharing Session
          FastBull Summit BrokersView Expo

          Fiscal Risk Dominant, Yen Intervention Fails

          Eva Chen

          Forex

          Summary:

          Japanese government bond prices continued to decline following the BOJ’s rate hike. If fiscal risks are not properly addressed, yen intervention is likely to be ineffective.

          BUY USDJPY
          EXP
          TRADING

          156.349

          Entry Price

          161.230

          TP

          153.600

          SL

          156.117 -0.910 -0.58%

          0.0

          Pips

          Flat

          153.600

          SL

          Exit Price

          156.349

          Entry Price

          161.230

          TP

          Fundamentals

          Japanese government bond prices extended their decline on Monday, pushing the 10-year bond yield up by 7.5 bps to 2.095%, the highest level since February 1999. The 2-year bond yield, which is sensitive to monetary policy expectations, rose by 3 bps to 1.12%, a record high since 1997.
          The renewed sell-off in sovereign bonds was triggered by the BOJ’s rate hike last Friday, which put pressure on the yen.
          Traders were disappointed that the BOJ did not provide clear guidance on when it might tighten policy again. Meanwhile, after warnings from Japan’s Finance Minister, Kaoru Katayama, and the top foreign exchange official, Atsushi Muraoka, about the recent currency weakness, the JPYUSD exchange rate briefly rose by 0.3% to 157.25.
          However, if Japanese authorities attempt to support the yen through foreign exchange intervention, such efforts are likely to be ineffective unless the government also properly manages fiscal policy risks.
          The Japanese government is expected to pass the budget for the fiscal year 2026 this Friday. Investors are concerned that the budget may include an unusually large scale of departmental spending. If this is the case, it could trigger a decline in Japanese government bond prices and further exacerbate yen depreciation pressures. The Ministry of Finance may then be forced to intervene in the market, but the success of such intervention is highly uncertain.
          Fiscal Risk Dominant, Yen Intervention Fails_1

          Technical Analysis

          During the day, the trend for USDJPY is biased upward, with a target above 157.88. The previous upward momentum from 139.87 is attempting to continue. If it can effectively break through the key structural resistance at 158.85, it will be an important medium-term bullish signal. The next target is the high at 161.94.
          On the other hand, as long as the support at 154.38 holds, the risk of a pullback remains. Therefore, the upside risk is still relatively high at present.

          Trade Recommendations

          Trade Direction: Buy
          Entry Price: 156.30
          Target Price: 161.23
          Stop Loss: 153.60
          Valid Until: January 7, 2026, 23:55:00
          Support: 156.98/156.00/154.35
          Resistance Levels: 157.92/158.88/159.93
          Risk Warnings and Disclaimers
          You understand and acknowledge that there is a high degree of risk involved in trading. Following any strategies or investment methods may lead to potential losses. The content on the site is provided by our contributors and analysts for information purposes only. You are solely responsible for determining whether any trading assets, securities, strategy, or any other product is suitable for investing based on your own investment objectives and financial situation.
          Add to Favorites
          Share

          Sterling Extends Rally as UK Growth Resilience Counters BoE Easing Bets

          Warren Takunda

          Technical Analysis

          Summary:

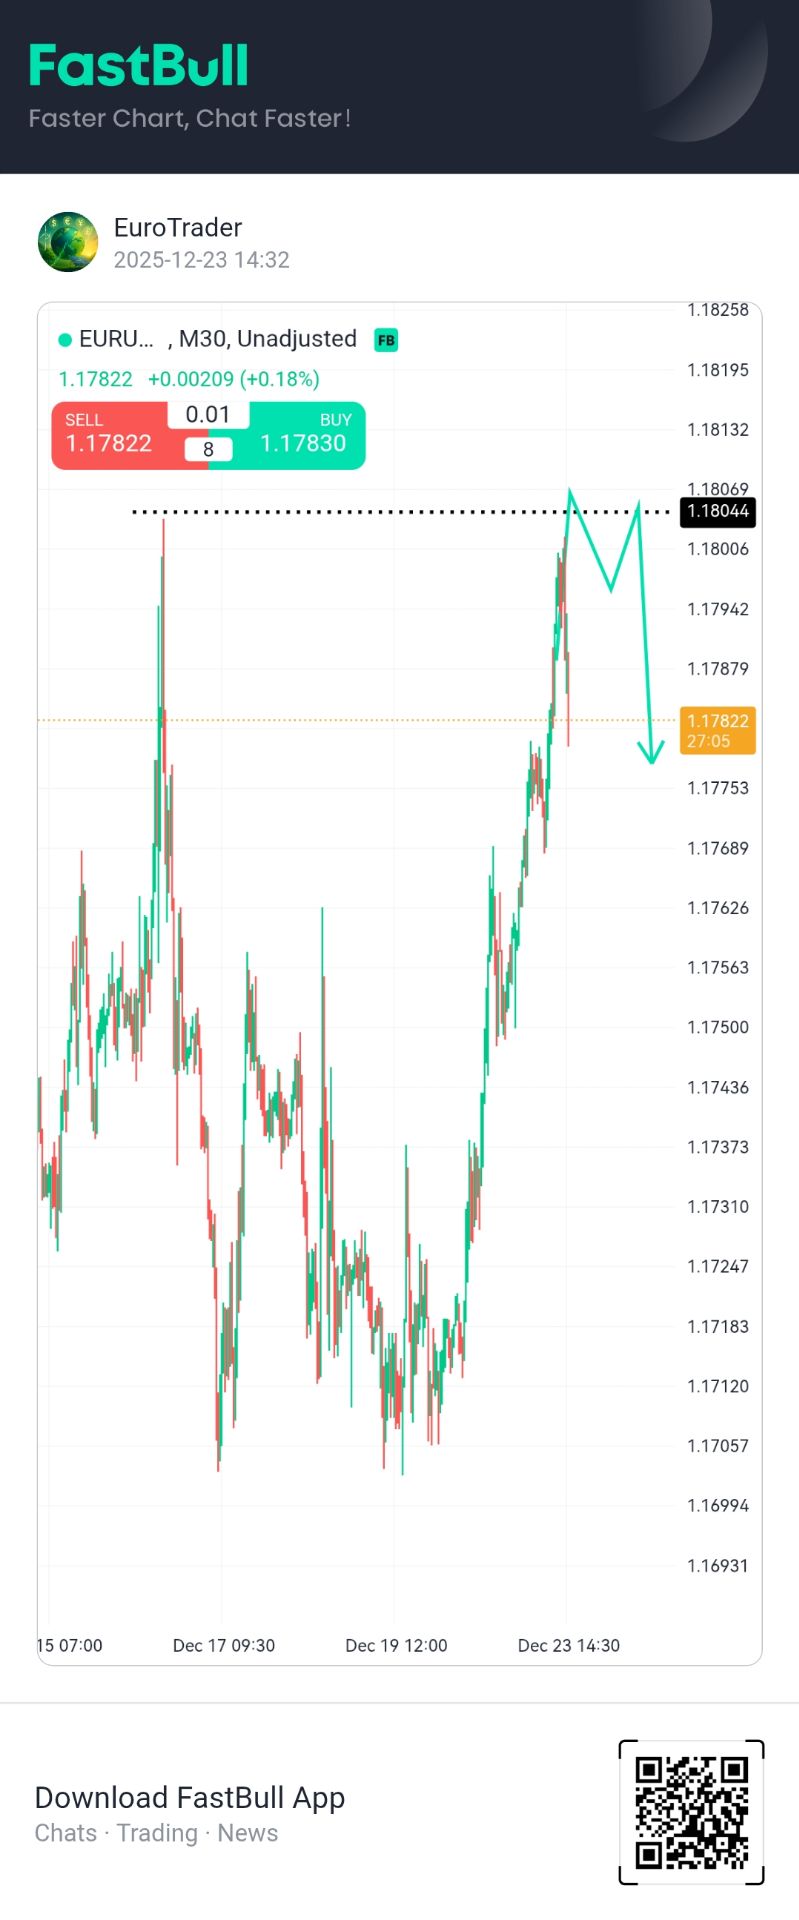
          GBP/USD climbed toward 1.3450 as steady UK growth offset BoE easing bets, with thin holiday trading and supportive technicals keeping the pound biased to the upside.

          BUY GBPUSD
          EXP
          PENDING

          1.34500

          Entry Price

          1.38000

          TP

          1.34000

          SL

          1.35086 +0.00478 +0.36%

          --

          Pips

          PENDING

          1.34000

          SL

          Exit Price

          1.34500

          Entry Price

          1.38000

          TP

          The British pound advanced sharply against the US dollar during Monday’s North American session, climbing nearly 0.6% as fresh UK economic data reassured investors that the economy continues to expand steadily, even as markets price in further monetary easing from the Bank of England next year. The GBP/USD pair rose to around 1.3450, rebounding decisively from an intraday low near 1.3372, amid subdued holiday trading conditions ahead of the Christmas Eve break.
          Thin liquidity amplified the move, but the underlying driver was renewed confidence in the UK’s growth outlook after official figures confirmed the economy expanded in line with expectations. Data released by the Office for National Statistics showed UK gross domestic product grew 0.1% quarter-on-quarter in the third quarter of 2025, while annual growth held steady at 1.3%, unchanged from the previous period. While modest, the figures helped reinforce the view that the UK economy has avoided a sharper slowdown, offering the pound some breathing room after weeks of pressure driven by soft inflation and dovish central bank rhetoric.
          Sterling pushed above the psychologically important 1.3400 level shortly after the data, suggesting that traders were more focused on growth stability than on the prospect of additional rate cuts. That reaction came despite broad expectations that the Bank of England will continue easing policy into 2026. UK inflation data released last week showed further cooling in price pressures, prompting BoE Governor Andrew Bailey to join the increasingly dovish chorus on the Monetary Policy Committee and back a rate reduction.
          Following Bailey’s comments, money markets adjusted expectations, pricing in roughly 37 basis points of additional easing by the Bank of England in 2026, according to interest-rate probability measures tracked by Capital Edge. Under normal circumstances, such expectations would weigh heavily on the currency. However, the pound’s resilience suggests that much of the dovish outlook is already priced in and that investors are now shifting attention to relative economic performance and transatlantic policy divergence.
          Across the Atlantic, the US economic calendar offered little fresh direction, leaving currency markets sensitive to commentary from Federal Reserve officials. Cleveland Fed President Beth Hammack struck a hawkish tone, warning that November’s consumer price index may have understated true inflation due to data irregularities. Hammack also suggested that the neutral interest rate could be higher than commonly assumed, a view that reinforces the Fed’s cautious stance on the timing and pace of future easing.
          In contrast, Fed Governor Stephen Miran offered a more balanced assessment, acknowledging irregularities in recent inflation data linked to the government shutdown but noting that incoming figures broadly align with his outlook on economic conditions. Miran added that while further policy rate reductions are likely at some point, the Fed remains data-dependent, leaving markets without a clear near-term signal.

          Technical AnalysisSterling Extends Rally as UK Growth Resilience Counters BoE Easing Bets_1

          From a technical perspective, GBP/USD has strengthened its near-term bullish bias. The pair reclaimed its 200-day simple moving average earlier this month and has since traded in a consolidative but constructive pattern. Momentum indicators have turned positive, supported by price action holding above key short-term averages. On Monday, the pair printed a fresh monthly high near 1.3457, reinforcing the view that buyers remain in control despite overbought conditions emerging on some oscillators.
          If bullish momentum persists, a test of the 1.3500 psychological level appears increasingly likely before year-end. A sustained break above that threshold would expose the October 1 high near 1.3527, with a further extension toward the 1.3800 area possible in early January should risk sentiment remain supportive and US dollar demand soften.
          TRADE RECOMMENDATION
          BUY GBPUSD
          ENTRY PRICE: 1.3450
          STOP LOSS: 1.3400
          TAKE PROFIT: 1.3800
          Risk Warnings and Disclaimers
          You understand and acknowledge that there is a high degree of risk involved in trading. Following any strategies or investment methods may lead to potential losses. The content on the site is provided by our contributors and analysts for information purposes only. You are solely responsible for determining whether any trading assets, securities, strategy, or any other product is suitable for investing based on your own investment objectives and financial situation.
          Add to Favorites
          Share

          Bullish Sentiment Remains Dominant, with Holiday Liquidity Amplifying the Rally

          Eva Chen

          Commodity

          Summary:

          Gold soared to a new record high above $4400 on Monday, finally breaking through after weeks of sluggish performance. Thin liquidity during the Christmas holiday may amplify the current gains in gold.

          BUY XAUUSD
          Close Time
          CLOSED

          4424.39

          Entry Price

          4685.00

          TP

          4362.00

          SL

          4487.94 +44.79 +1.01%

          545.4

          Pips

          Profit

          4362.00

          SL

          4478.93

          Exit Price

          4424.39

          Entry Price

          4685.00

          TP

          Fundamentals

          As the Christmas holiday approaches, gold and silver traders show no signs of slowing down. Precious metals continued to surge in the new week, with spot gold spiking to a new record high above $4400 on Monday.
          If gold can decisively hold above $4400, it will open up greater upside potential. However, the headwinds facing gold may not truly materialize until the second half of 2026. Even so, the possibility that market participants could price in this expectation prematurely cannot be ruled out. The key challenge to the bullish gold narrative lies in the fact that “major central banks will gradually shift from rate cuts and may re-raise rates in the future.” This is a point worth noting.
          But for now, gold buyers will continue to maintain their bullish momentum. However, thin liquidity may amplify the current gains. Especially as Christmas and New Year’s holidays approach, market trading is becoming increasingly light. Therefore, even though seasonal patterns show that December and January have been better-performing months for gold over the past two decades, liquidity factors must be taken into account when looking ahead to further gains.
          Bullish Sentiment Remains Dominant, with Holiday Liquidity Amplifying the Rally_1

          Technical Analysis

          Against this backdrop, gold’s technical breakout came earlier than expected. The decisive move above $4381 indicates that the consolidation since the $3997 peak has ended. As long as the $4271 level holds as support, the short-term outlook will remain strongly bullish.
          Currently, the market’s focus is on whether the price can smoothly break through the upper limit of the ascending channel, which would signal further accelerated price increases. If the upper limit is breached, the next target will be $4685, which is the 61.8% Fibonacci retracement of the rise from $3997 to $4381.

          Trade Recommendations

          Trade Direction: Buy
          Entry Price: 4395
          Target Price: 4685
          Stop Loss: 4362
          Valid Until: January 7, 2025 23:55:00
          Support: 4381/4375/4365
          Resistance: 4420/4450/4468
          Risk Warnings and Disclaimers
          You understand and acknowledge that there is a high degree of risk involved in trading. Following any strategies or investment methods may lead to potential losses. The content on the site is provided by our contributors and analysts for information purposes only. You are solely responsible for determining whether any trading assets, securities, strategy, or any other product is suitable for investing based on your own investment objectives and financial situation.
          Add to Favorites
          Share

          Short-term Geopolitical Factors Cannot Change the Overall Downward Trend

          Alan

          Commodity

          Summary:

          Recently, WTI crude oil experienced a rebound after a significant decline influenced by geopolitical factors, but market sentiment remains predominantly bearish regarding future oil prices, with technical analysis also indicating a continued downward trend.

          SELL WTI
          EXP
          TRADING

          56.947

          Entry Price

          52.800

          TP

          59.100

          SL

          58.112 +0.202 +0.35%

          0.0

          Pips

          Flat

          52.800

          TP

          Exit Price

          56.947

          Entry Price

          59.100

          SL

          Fundamentals

          Oil prices experienced a short-term rebound today, prompted by geopolitical developments—specifically, U.S. interdiction of oil shipments near Venezuela and intensified enforcement against the "shadow fleet," which heightened market sensitivity to localized supply disruptions; WTI responded immediately with gains. However, such geopolitical shocks tend to be temporary—fundamentally, supply fundamentals remain robust, with inventories slowly declining. Although the International Energy Agency revised demand forecasts upward this month, their overall assessment does not fully eliminate the risk of oversupply in the coming year; additionally, OPEC+ has reaffirmed its current production framework, indicating no short-term commitment to significant production cuts to support prices. U.S. crude oil inventories have shown only marginal fluctuations recently, with physical inventory draws insufficient to support a sustained price rally.
          In summary, geopolitical news induces short-term volatility, but medium-term supply-demand dynamics and inventory data pose stronger downward pressures on oil prices.

          Technical Analysis

          Short-term Geopolitical Factors Cannot Change the Overall Downward Trend_1
          In the 1D timeframe, WTI's candlestick pattern exhibits a clear downward channel, with SMA systems—both short-term and medium-term—aligning in a bearish configuration, indicating a strong continuation of the downtrend and a higher likelihood of sustained decline in the near term.
          Short-term Geopolitical Factors Cannot Change the Overall Downward Trend_2
          In the 4H timeframe, WTI broke below the US$55.00 support level last week and briefly found support at the April low of US$54.75. The recent trading sessions have seen a rebound, with WTI currently testing resistance at US$57.20. It remains below the MA60, creating a confluence of resistance levels that heightens short-term upward pressure.
          Currently, if WTI is unable to convincingly break above the US$57.20 resistance, the downtrend may continue, with potential further testing of the support at US$54.75 and even a possibility of breaching this level to accelerate the decline. Conversely, a successful breakout above US$57.20 could open the path for an upward extension toward the US$58.30 - US$60.00.

          Trading Recommendations

          Trading Direction: Sell
          Entry Price: 57.20
          Target Price: 52.80
          Stop Loss: 59.10
          Valid Until: January 5, 2026 23:00:00
          Support: 55.70, 54.75
          Resistance: 57.20, 58.15
          Risk Warnings and Disclaimers
          You understand and acknowledge that there is a high degree of risk involved in trading. Following any strategies or investment methods may lead to potential losses. The content on the site is provided by our contributors and analysts for information purposes only. You are solely responsible for determining whether any trading assets, securities, strategy, or any other product is suitable for investing based on your own investment objectives and financial situation.
          Add to Favorites
          Share

          XAUUSD – OPPORTUNITY TO SEEK LONG-TERM BUYING POSITION

          Wisd Uni

          Forex

          Commodity

          Summary:

          Gold surged above the 4385 resistance zone this morning, triggering buying sentiment and drawing more traders into the market. However, the current price area lacks a clear profit-taking structure, so a potential drop back below 4385 should be watched for a sell signal.

          SELL XAUUSD
          EXP
          PENDING

          4384.00

          Entry Price

          4350.00

          TP

          4390.00

          SL

          4487.94 +44.79 +1.01%

          --

          Pips

          PENDING

          4350.00

          TP

          Exit Price

          4384.00

          Entry Price

          4390.00

          SL

          Fundamental Analysis

          Gold prices (XAU/USD) continue to maintain an upward trend as markets anticipate upcoming rate cuts from the Federal Reserve, which reduces the opportunity cost of holding non-yielding assets like gold. This expectation provides strong support for the bullish momentum. In addition, global economic and geopolitical uncertainties are driving investors toward safe-haven assets, helping XAU/USD remain resilient even during short-term technical rebounds of the U.S. dollar.
          Central banks are also increasing their gold reserves, adding long-term demand while supply growth remains limited. However, gold may face short-term corrections if the USD strengthens on positive U.S. economic data or if the Fed signals a more hawkish stance than expected.
          Overall, fundamental factors still lean toward a bullish outlook for XAU/USD, supported by lower expected interest rates, safe-haven flows, and continued institutional buying. Traders should remain cautious of key U.S. data releases, as they can trigger sharp volatility and temporary pullbacks in gold prices

          Technical Analysis

          This morning, gold surged above the previous resistance area around 4385, breaking past the prior swing highs and triggering strong bullish sentiment. The breakout has encouraged sidelined traders to jump back into the market, increasing overall market participation.
          However, despite the upward move, the current price zone does not offer a clear profit-taking structure. Therefore, traders should carefully watch for a potential false breakout. A downside break back below 4385 may signal a shift in momentum and create an opportunity to sell.

          TRADING DIRECTION: SELL

          Entry: 4384
          Take Profit: 4350
          Stop Loss: 4390
          Support: 4350 / 4330
          Resistance: 4420 / 4450
          XAUUSD – OPPORTUNITY TO SEEK LONG-TERM BUYING POSITION_1
          Risk Warnings and Disclaimers
          You understand and acknowledge that there is a high degree of risk involved in trading. Following any strategies or investment methods may lead to potential losses. The content on the site is provided by our contributors and analysts for information purposes only. You are solely responsible for determining whether any trading assets, securities, strategy, or any other product is suitable for investing based on your own investment objectives and financial situation.
          Add to Favorites
          Share

          Moderately Hawkish! USD/JPY Set to Test 160

          Tank

          Forex

          Technical Analysis

          Summary:

          Prolonged geopolitical uncertainty from the ongoing Russia–Ukraine war, concerns over renewed escalation in the Israel–Iran conflict, and increasingly tense U.S.–Venezuela relations have all driven up demand for traditional safe-haven assets. In addition, market expectations that Japanese authorities will intervene to curb further depreciation of the yen have also supported the currency.

          BUY USDJPY
          EXP
          TRADING

          157.433

          Entry Price

          160.000

          TP

          155.000

          SL

          156.117 -0.910 -0.58%

          0.0

          Pips

          Flat

          155.000

          SL

          Exit Price

          157.433

          Entry Price

          160.000

          TP

          Fundamentals

          Supported by the inflation backdrop, at the end of its two-day policy meeting, the Bank of Japan (BoJ) voted unanimously — as widely expected — to raise the short-term interest rate from 0.5% to 0.75%. This marks the first rate hike since January this year and pushes rates to their highest level since 1995, signaling Japan's further move away from prolonged ultra-loose monetary policy. The BoJ stated in its announcement that recent data and survey results suggest a mechanism whereby wages and inflation rise moderately in tandem is likely to persist. With real interest rates still significantly low, if economic and price outlooks are realized, the bank will continue advancing the process of raising rates. Governor Kazuo Ueda emphasized in his post-meeting remarks that the pace and timing of future hikes will depend on how the economy responds to each policy adjustment. If wage growth expands further, the BoJ may continue raising rates, but it gave no clear guidance on specific timing or the number of hikes. This relatively cautious stance led the yen to weaken after the decision was announced; USD/JPY briefly rose to a one-month high, breaking above the 157 level. Meanwhile, Japan's 10-year government bond yield jumped to a 26-year high following the rate hike. The market believes the rate increase itself has been fully priced in, with the real focus being whether the BoJ will provide clearer, more hawkish forward guidance in the future. Several analysts noted that while the statement appeared slightly optimistic, the overall tone remained cautious and lacked a clear commitment to a rate hike path, leading markets to react in a "Buy the Rumor, Sell the News" manner. Some view holds that as long as real interest rates remain deeply negative, the BoJ still has room to raise rates, but the pace may be slow and highly dependent on sustained wage growth and whether inflation proves resilient.
          On December 19th, White House Economic Advisor Kevin Hassett stated that President Trump's assessment that inflation is at a low level is correct, despite official data, public opinion, and the views of most economists disagreeing. Hassett argued that the commonly used year-on-year inflation measure has flaws, and a more reasonable approach is to observe three-month moving average price pressures. According to this metric, inflation is not significantly above the Fed's 2% target but is actually below it, which is how the president views the inflation situation. A government report released earlier showed that the November Consumer Price Index rose 2.7% year-on-year, down from 3.0% in September. The data was delayed due to the government shutdown. Although inflation has eased, it remains above the Fed's target, and many Fed officials continue to worry about elevated price pressures; some even oppose rate cuts, citing persistent inflation risks and the possibility that Trump's tariff policies could push prices higher. Trump has long advocated for lower interest rates, even though such moves might further intensify price pressures. Facing low approval ratings for his economic policies, he insists inflation is easing and says he is rapidly bringing down high prices. Also on December 19th, New York Fed President John Williams said there is currently no urgent need to cut borrowing costs again following last week's Fed rate cut. He believes the current rate level has placed monetary policy in a fairly favorable position. Williams pointed out that the Fed's core goal is to bring inflation back to the 2% target while supporting the labor market, and within this balancing framework, the current rate policy is generally appropriate. He also noted that key inflation and employment data resumed publication after the recent government shutdown ended, but showed no substantive changes, while some technical issues have added complexity to interpreting the data.

          Technical Analysis

          Interpreted by the daily chart, the Bollinger Bands have narrowed and flattened, with moving averages running sideways. Last Friday saw a large bullish candle break above the Bollinger Upper Band, confirming a short-term return to an uptrend. If prices can sustain above 157, there is a high probability of testing 158 or 160 again. MACD formed a golden cross, with the MACD and Signal lines pulling back near the zero axis, indicating the correction phase has ended. RSI stands at 60, reflecting strong bullish sentiment, while support levels lie at 157 and 156.1. Based on the weekly chart, Bollinger Bands are widening upward, moving averages are diverging higher, and the bullish trend remains intact. After a golden cross, the MACD and signal lines returned above the zero axis, with price oscillating upward along the EMA12 — a sign of strong upward momentum. RSI is at 69, showing investors are predominantly in buying mode. Buying at lows is strongly recommended.
          Moderately Hawkish! USD/JPY Set to Test 160_1Moderately Hawkish! USD/JPY Set to Test 160_2

          Trading Recommendations:

          Trading direction: Buy
          Entry price: 157.3
          Target price: 160
          Stop loss: 155
          Support: 154.7/153.2/150
          Resistance: 158/158.8/160
          Risk Warnings and Disclaimers
          You understand and acknowledge that there is a high degree of risk involved in trading. Following any strategies or investment methods may lead to potential losses. The content on the site is provided by our contributors and analysts for information purposes only. You are solely responsible for determining whether any trading assets, securities, strategy, or any other product is suitable for investing based on your own investment objectives and financial situation.
          Add to Favorites
          Share

          Gold Hits Record High! Set to Surge Toward 4,500?

          Tank

          Forex

          Commodity

          Summary:

          Boosted by signs of easing U.S. inflation and cooling employment data, market expectations of a Federal Reserve interest rate cut have strengthened gold prices. The rate reduction could decrease the opportunity cost of holding gold, thereby supporting the valuation of this non-yielding precious metal.

          SELL XAUUSD
          EXP
          TRADING

          4416.97

          Entry Price

          4100.00

          TP

          4500.00

          SL

          4487.94 +44.79 +1.01%

          0.0

          Pips

          Flat

          4100.00

          TP

          Exit Price

          4416.97

          Entry Price

          4500.00

          SL

          Fundamentals

          Israeli Prime Minister Benjamin Netanyahu plans to meet with President Trump in the U.S. later this month to discuss the escalating threat posed by Iran’s accelerated ballistics missile program and to propose a new round of military operations involving U.S. participation. Such intermittent escalations of geopolitical tensions are expected to continue providing short-term safe-haven support for gold prices. On Sunday, officials informed Reuters that the U.S. is still tracking a third oil tanker near Venezuela, while U.S. President Donald Trump has intensified his oil embargo against Nicolás Maduro's regime. As of December 19, holdings in the world’s largest gold ETF, SPDR Gold Trust, declined by 0.57 tons to 1,052.54 tons, indicating some investors are taking partial profits amid high gold prices. Meanwhile, TD Securities’ latest commodities outlook indicates that, with the Fed’s interest rate cut cycle beginning, prolonged dollar depreciation pressures, structural supply constraints, and diverse demand from central banks and private sectors, gold prices could break through US$4,400 per ounce and reach new highs by the first half of 2025. The institution highlights that, supported by declining interest rates, a steepening yield curve, and potential concerns over the Federal Reserve’s policy independence, the likelihood of a significant correction in gold prices next year remains relatively low.
          According to the CME FedWatch tool, the probability of the Federal Reserve cut in January is only 19.9%, despite the fact that the Fed has previously reduced interest rates by 0.25 percentage points in each of the last three meetings. The University of Michigan's final December consumer sentiment index was revised downward from a preliminary reading of 53.3 to 52.9, whereas economists had anticipated an upward revision to 53.4. Cleveland Fed President Beth Hammack stated on Sunday that monetary policy is currently in a neutral stance and she plans to assess the impact of the 75-basis-point rate cut in the first quarter. Trading activity remains subdued as traders may be locking in gains ahead of the long holiday, potentially limiting gains in precious metals. The Chicago Fed's national activity index report for September will be released later Monday, with the preliminary Q3 US GDP figures set to be the main focus on Tuesday.

          Technical Analysis

          In the 1H timeframe, the Bollinger Bands are opening upward, and the SMAs are diverging, indicating that the bullish trend remains intact. The candlestick exhibits a long upper shadow, suggesting significant short-term resistance above. After the MACD formed a golden cross, underlying upward momentum has not weakened, and there is potential for the price to rise again toward 4410. The RSI stands at 79, indicating an overbought market, with support levels at 4377 and 4350. In the 1D timeframe, the price is strongly ascending along the upper Bollinger Band, and as long as it does not fall below the EMA12, the overall uptrend remains unchanged. In the short term, closely monitor whether there is a strong breakout above the trend channel at 4410; if so, a rise toward 4430-4450 is likely. Conversely, if resistance causes a pullback, the price may decline toward 4300 and 4130. Simultaneously, with an RSI of 77, the market remains overbought. It is recommended to go short before going long.
          Gold Hits Record High! Set to Surge Toward 4,500?_1Gold Hits Record High! Set to Surge Toward 4,500?_2

          Trading Recommendations

          Trading Direction: Sell
          Entry Price: 4410
          Target Price: 4100
          Stop Loss: 4500
          Support: 4200, 4100, 3800
          Resistance: 4450, 4500, 5000
          Risk Warnings and Disclaimers
          You understand and acknowledge that there is a high degree of risk involved in trading. Following any strategies or investment methods may lead to potential losses. The content on the site is provided by our contributors and analysts for information purposes only. You are solely responsible for determining whether any trading assets, securities, strategy, or any other product is suitable for investing based on your own investment objectives and financial situation.
          Add to Favorites
          Share
          FastBull
          Copyright © 2025 FastBull Ltd

          728 RM B 7/F GEE LOK IND BLDG NO 34 HUNG TO RD KWUN TONG KLN HONG KONG

          TelegramInstagramTwitterfacebooklinkedin
          App Store Google Play Google Play
          Products
          Charts

          Chats

          Q&A with Experts
          Screeners
          Economic Calendar
          Data
          Tools
          Membership
          Features
          Function
          Markets
          Copy Trading
          Latest Signals
          Contests
          News
          Analysis
          24/7
          Columns
          Education
          Company
          Careers
          About Us
          Contact Us
          Advertising
          Help Center
          Feedback
          User Agreement
          Privacy Policy
          Personal Information Protection Statement
          Business

          White Label

          Data API

          Web Plug-ins

          Poster Maker

          Affiliate Program

          Risk Disclosure

          The risk of loss in trading financial instruments such as stocks, FX, commodities, futures, bonds, ETFs and crypto can be substantial. You may sustain a total loss of the funds that you deposit with your broker. Therefore, you should carefully consider whether such trading is suitable for you in light of your circumstances and financial resources.

          No decision to invest should be made without thoroughly conducting due diligence by yourself or consulting with your financial advisors. Our web content might not suit you since we don't know your financial conditions and investment needs. Our financial information might have latency or contain inaccuracy, so you should be fully responsible for any of your trading and investment decisions. The company will not be responsible for your capital loss.

          Without getting permission from the website, you are not allowed to copy the website's graphics, texts, or trademarks. Intellectual property rights in the content or data incorporated into this website belong to its providers and exchange merchants.

          Not Logged In

          Log in to access more features

          FastBull Membership

          Not yet

          Purchase

          Become a signal provider
          Help Center
          Customer Service
          Dark Mode
          Price Up/Down Colors

          Log In

          Sign Up

          Position
          Layout
          Fullscreen
          Default to Chart
          The chart page opens by default when you visit fastbull.com