• Trade
  • Markets
  • Copy
  • Contests
  • 24/7
  • Calendar
  • Q&A
  • Chats
Screeners
SYMBOL
LAST
BID
ASK
HIGH
LOW
NET CHG.
%CHG.
SPREAD
SOURCE
SPX
S&P 500 Index
7175.83
7175.83
7175.83
7415.64
7173.63
-147.80
-2.02%
--
--
DJI
Dow Jones Industrial Average
49097.06
49097.06
49097.06
50454.81
49091.92
-1101.11
-2.19%
--
--
IXIC
NASDAQ Composite Index
23879.21
23879.21
23879.21
24939.62
23870.70
-550.67
-2.25%
--
--
USDX
US Dollar Index
103.833
103.833
103.913
103.867
103.488
+0.151
+ 0.15%
--
--
EURUSD
Euro / US Dollar
1.09660
1.09660
1.09695
1.10095
1.09551
-0.00066
-0.06%
--
--
GBPUSD
Pound Sterling / US Dollar
1.30868
1.30868
1.30920
1.31724
1.30788
-0.00605
-0.46%
--
--
XAUUSD
Gold / US Dollar
3624.91
3624.91
3625.35
3758.44
3619.69
-100.60
-2.70%
--
--
WTI
Light Sweet Crude Oil
83.032
83.032
83.062
83.785
81.546
+1.263
+ 1.54%
--
--

Community Accounts

Signal Accounts
--
Profit Accounts
--
Loss Accounts
--
View More

Become a signal provider

Sell trading signals to earn additional income

View More

Guide to Copy Trading

Get started with ease and confidence

View More

Signal Accounts for Members

All Signal Accounts

Best Return
  • Best Return
  • Best P/L
  • Best MDD
Past 1W
  • Past 1W
  • Past 1M
  • Past 1Y

All Contests

  • All
  • Recommend
  • Stocks
  • Cryptocurrencies
  • Central Banks
  • Trump Updates
  • Featured News
Top News Only
Share

MSCI Emerging Markets Equity Index Fell 1.3%, And The Developing Countries Currency Index Fell 0.06%

Share

Spot Silver Fell 5% On The Day, Currently Trading At $42.74 Per Ounce

Share

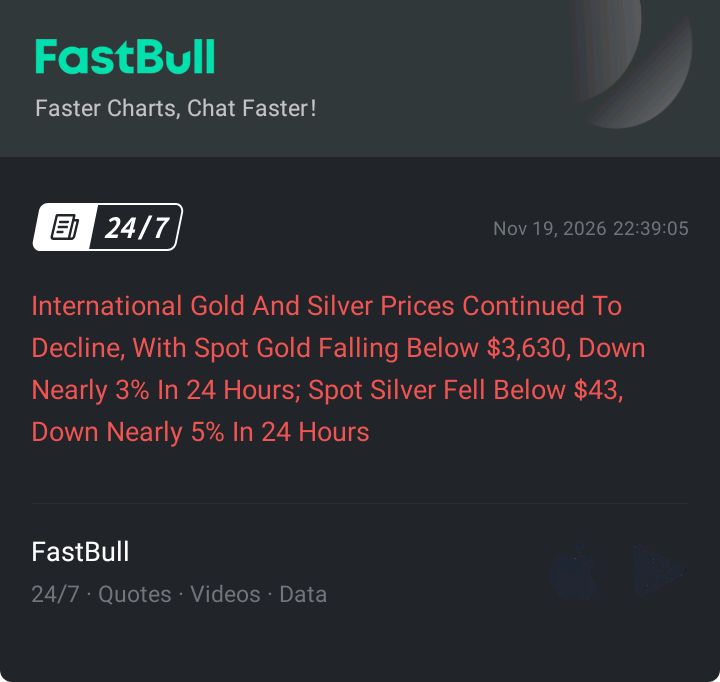
International Gold And Silver Prices Continued To Decline, With Spot Gold Falling Below $3,630, Down Nearly 3% In 24 Hours; Spot Silver Fell Below $43, Down Nearly 5% In 24 Hours

Share

New York Gold Futures Fell Below $3,630 Per Ounce, Down 2.99% On The Day

Share

New York Gold Futures Fell 3% On The Day, Currently Trading At $3,628.80 Per Ounce

Share

Spot Gold Fell Below $3,630 Per Ounce, Down 2.58% On The Day

Share

Spot Silver Fell Further To 4%, Currently Trading At $43.18 Per Ounce

Share

New York Gold Futures Fell Below $3,640 Per Ounce, Down 2.76% On The Day

Share

Spot Gold Fell Below $3,640 Per Ounce, Down 2.30% On The Day

Share

New York Gold Futures Fell Below $3,650 Per Ounce, Down 2.47% On The Day

Share

Spot Gold Fell Below $3,650 Per Ounce, Down 2.01% On The Day

Share

Spot Silver Fell More Than 3% To $43.63 Per Ounce, While Spot Gold Fell Nearly 2% To $3,652.4 Per Ounce

Share

New York Gold Futures Fell Below $3,660 Per Ounce, Down 2.19% On The Day

Share

Spot Gold Fell Below $3,660 Per Ounce, Down 1.74% On The Day

Share

BNP Paribas: Raised Its Forecast For The Fed's Interest Rate Hike Prospects, Now Believing That Monetary Policy Will Also Tighten In March, With 25 Basis Point Rate Hikes Implemented Successively In December, January, And March

Share

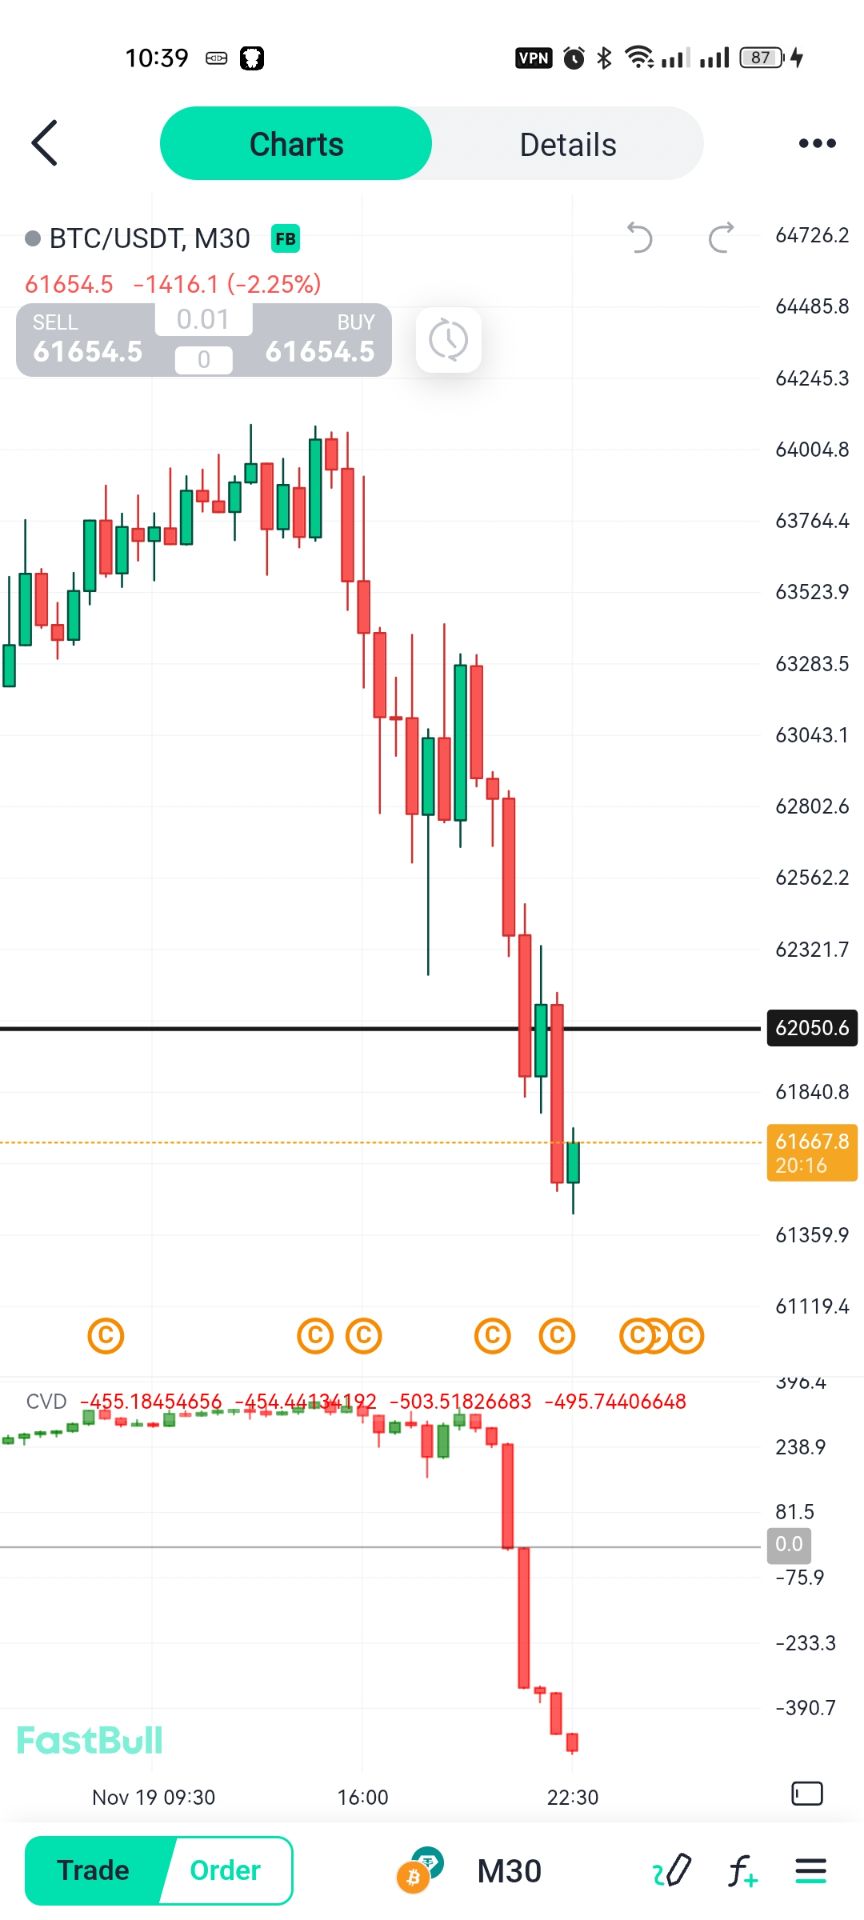
Bitcoin Fell To Its Lowest Point In Four Months, Currently Down 0.6% At $61,876.23

Share

A Spokesperson For The Iranian Foreign Ministry Stated That The US Accusations That Tehran Is Developing Chemical And Biological Weapons Are Intended To Create Panic And Provide A Justification For Military Action

Share

Chicago Federal Reserve President Goolsby: It Is Unclear What The Impact On The Financial Sector Would Be If There Were A Significant Pullback In AI-related Stocks

Share

Chicago Federal Reserve President Goolsby: The Economy's Capacity Is At High Risk And May Not Be Able To Withstand The Current "python Swallowing Pig" Level Of Corporate Investment Without Overheating

Share

Chicago Federal Reserve President Goolsby: Consumer Spending Has Been Quite Broad, Primarily Supported By Income Growth

TIME
ACT
FCST
PREV
IMPACT
Australia Unemployment Rate (SA) (Oct)

A:--

F: --

P: --

AUDUSD
  • AUDUSD
  • XAUUSD
  • XAGUSD
  • WTI
  • USDX
Euro Zone Current Account (Not SA) (Sept)

A:--

F: --

P: --

EURUSD
  • EURUSD
  • XAUUSD
  • XAGUSD
  • WTI
  • USDX
Euro Zone Current Account (SA) (Sept)

A:--

F: --

P: --

EURUSD
  • EURUSD
  • XAUUSD
  • XAGUSD
  • WTI
  • USDX
Euro Zone Labor Cost YoY (Q3)

A:--

F: --

P: --

EURUSD
  • EURUSD
  • XAUUSD
  • XAGUSD
  • WTI
  • USDX
Euro Zone Construction Output YoY (Sept)

A:--

F: --

P: --

EURUSD
  • EURUSD
  • XAUUSD
  • XAGUSD
  • WTI
  • USDX
Euro Zone Construction Output MoM (SA) (Sept)

A:--

F: --

P: --
EURUSD
  • EURUSD
  • XAUUSD
  • XAGUSD
  • WTI
  • USDX
U.K. CBI Industrial Prices Expectations (Nov)

A:--

F: --

P: --

GBPUSD
  • GBPUSD
  • XAUUSD
  • XAGUSD
  • WTI
  • USDX
U.K. CBI Industrial Trends - Orders (Nov)

A:--

F: --

P: --

GBPUSD
  • GBPUSD
  • XAUUSD
  • XAGUSD
  • WTI
  • USDX
South Africa Repo Rate

A:--

F: --

P: --

XAUUSD
  • XAUUSD
  • XAGUSD
  • WTI
  • USDX
Canada Industrial Product Price Index YoY (Oct)

A:--

F: --

P: --
USDCAD
  • USDCAD
  • XAUUSD
  • XAGUSD
  • WTI
  • USDX
U.S. Philadelphia Fed Business Activity Index (SA) (Nov)

A:--

F: --

P: --

USDX
  • USDX
  • XAUUSD
  • XAGUSD
  • WTI
Canada Industrial Product Price Index MoM (Oct)

A:--

F: --

P: --
USDCAD
  • USDCAD
  • XAUUSD
  • XAGUSD
  • WTI
  • USDX
U.S. Weekly Initial Jobless Claims (SA)

A:--

F: --

P: --
XAUUSD
  • XAUUSD
  • XAGUSD
  • WTI
  • USDX
U.S. Initial Jobless Claims 4-Week Avg. (SA)

A:--

F: --

P: --
XAUUSD
  • XAUUSD
  • XAGUSD
  • WTI
  • USDX
U.S. Weekly Continued Jobless Claims (SA)

A:--

F: --

P: --
XAUUSD
  • XAUUSD
  • XAGUSD
  • WTI
  • USDX
U.S. Philadelphia Fed Manufacturing Employment Index (Nov)

A:--

F: --

P: --

USDX
  • USDX
  • XAUUSD
  • XAGUSD
  • WTI
ECB President Lagarde Speaks
FOMC Member Hammack Speaks
U.S. Conference Board Leading Economic Index MoM (Oct)

A:--

F: --

P: --

USDX
  • USDX
  • XAUUSD
  • XAGUSD
  • WTI
U.S. Conference Board Lagging Economic Index MoM (Oct)

A:--

F: --

P: --

USDX
  • USDX
  • XAUUSD
  • XAGUSD
  • WTI
U.S. Conference Board Coincident Economic Index MoM (Oct)

A:--

F: --

P: --

USDX
  • USDX
  • XAUUSD
  • XAGUSD
  • WTI
U.S. Conference Board Leading Economic Index (Oct)

A:--

F: --

P: --

USDX
  • USDX
  • XAUUSD
  • XAGUSD
  • WTI
U.S. EIA Weekly Natural Gas Stocks Change

A:--

F: --

P: --

WTI
  • WTI
  • XAUUSD
  • XAGUSD
  • USDX
U.S. Kansas Fed Manufacturing Production Index (Nov)

A:--

F: --

P: --

USDX
  • USDX
  • XAUUSD
  • XAGUSD
  • WTI
U.S. Kansas Fed Manufacturing Composite Index (Nov)

A:--

F: --

P: --

USDX
  • USDX
  • XAUUSD
  • XAGUSD
  • WTI
U.S. 10-Year TIPS Auction Avg. Yield

A:--

F: --

P: --

XAUUSD
  • XAUUSD
  • XAGUSD
  • WTI
  • USDX
Argentina Trade Balance (Oct)

A:--

F: --

P: --

XAUUSD
  • XAUUSD
  • XAGUSD
  • WTI
  • USDX
Richmond Federal Reserve President Barkin delivered a speech.
South Korea PPI MoM (Oct)

A:--

F: --

P: --
XAUUSD
  • XAUUSD
  • XAGUSD
  • WTI
  • USDX
Richmond Federal Reserve President Barkin delivered a speech.
U.S. Weekly Treasuries Held by Foreign Central Banks

A:--

F: --

P: --

USDX
  • USDX
  • XAUUSD
  • XAGUSD
  • WTI
Japan National CPI MoM (Oct)

--

F: --

P: --

Japan National CPI MoM (Not SA) (Oct)

--

F: --

P: --

Japan National Core CPI YoY (Oct)

--

F: --

P: --

Japan National CPI YoY (Oct)

--

F: --

P: --

Philadelphia Fed President Henry Paulson delivers a speech
U.K. GfK Consumer Confidence Index (Nov)

--

F: --

P: --

China, Mainland 5-Year Loan Prime Rate

--

F: --

P: --

China, Mainland 1-Year Loan Prime Rate (LPR)

--

F: --

P: --

Turkey Capacity Utilization (Nov)

--

F: --

P: --

Turkey Consumer Confidence Index (Nov)

--

F: --

P: --

Germany PPI MoM (Oct)

--

F: --

P: --

Germany PPI YoY (Oct)

--

F: --

P: --

U.K. Core Retail Sales YoY (SA) (Oct)

--

F: --

P: --

U.K. Retail Sales MoM (SA) (Oct)

--

F: --

P: --

U.K. Retail Sales YoY (SA) (Oct)

--

F: --

P: --

ECB President Lagarde Speaks
India Industrial Production Index YoY (Oct)

--

F: --

P: --

Mexico Retail Sales MoM (Sept)

--

F: --

P: --

Canada Core Retail Sales MoM (SA) (Sept)

--

F: --

P: --

Canada Retail Sales MoM (SA) (Sept)

--

F: --

P: --

U.S. UMich Current Economic Conditions Index Final (Nov)

--

F: --

P: --

U.S. UMich 1-Year-Ahead Inflation Expectations Final (Nov)

--

F: --

P: --

U.S. UMich Consumer Expectations Index Final (Nov)

--

F: --

P: --

U.S. UMich Consumer Sentiment Index Final (Nov)

--

F: --

P: --

Euro Zone Consumer Confidence Index Prelim (Nov)

--

F: --

P: --

U.S. Weekly Total Oil Rig Count

--

F: --

P: --

U.S. Weekly Total Rig Count

--

F: --

P: --

Australia Composite PMI Prelim (Nov)

--

F: --

P: --

Australia Manufacturing PMI Prelim (Nov)

--

F: --

P: --

France Services PMI Prelim (SA) (Nov)

--

F: --

P: --

Q&A with Experts
    • All
    • Chatrooms
    • Groups
    • Friends
    Skylark flag
    Matthew
    @SkylarkHow you see gold
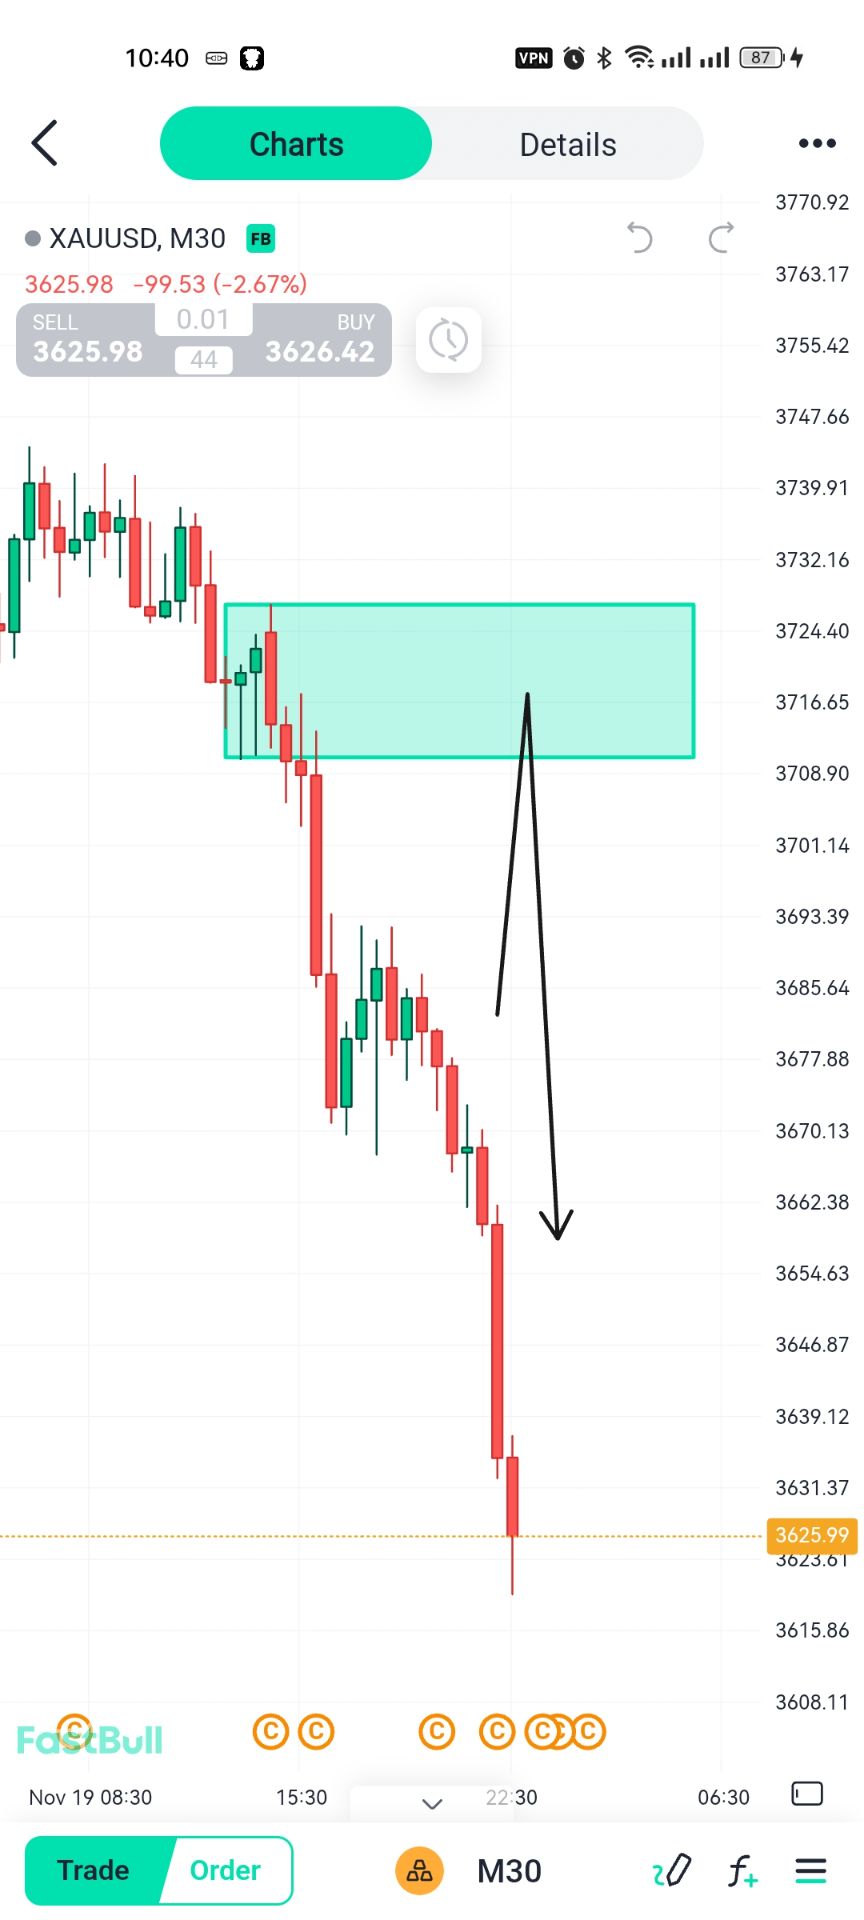
    @Matthewgold is bearish it has been bearish and the sells are having the upper hand in the market
    Skylark flag
    Matthew
    @EuroTraderI feel like throwing up .i miss gold trade
    @Matthewthere's no sign of anything bullish happening on gold today or tomorrow
    EuroTrader flag
    Matthew
    @EuroTraderI feel like throwing up .i miss gold trade
    @Matthewhaha maybe you should throw up so you can get immune to throwing up when things happen like this
    EuroTrader flag
    EuroTrader flag
    EuroTrader
    @Matthewmy advice is just to abandon the setup cause nothing is gonna make it play out just like we intended earlier
    Matthew flag
    EuroTrader
    @Matthewhaha maybe you should throw up so you can get immune to throwing up when things happen like this
    @EuroTradermaybe 🤔
    Matthew flag
    Skylark
    @Matthewthere's no sign of anything bullish happening on gold today or tomorrow
    @Skylarkthe problem is how i can enter the sell
    Skylark flag
    Matthew
    @Skylarkthe problem is how i can enter the sell
    @MatthewThe market is closed already and it over for today
    EuroTrader flag
    Matthew
    @EuroTradermaybe 🤔
    @Matthewthats the major challenge at the moment. How can we join in these shorts without getting stopped out
    Skylark flag
    Matthew
    @Skylarkthe problem is how i can enter the sell
    @MatthewI won't advise you to take any trade during Asia unless you see a good opportunity
    EuroTrader flag
    Matthew
    @EuroTradermaybe 🤔
    @MatthewAy London I'll share somethings in Bitcoin with you if you would be active at that time
    EuroTrader flag
    Skylark flag
    Matthew
    @Skylarkthe problem is how i can enter the sell
    @Matthewbecause I think gold need to pull back a bit go for retest before another downward movement
    EuroTrader flag
    EuroTrader
    @Matthewby the way we can still hope that we get a pin bar pattern but if a truth I doubt we would see it
    Skylark flag
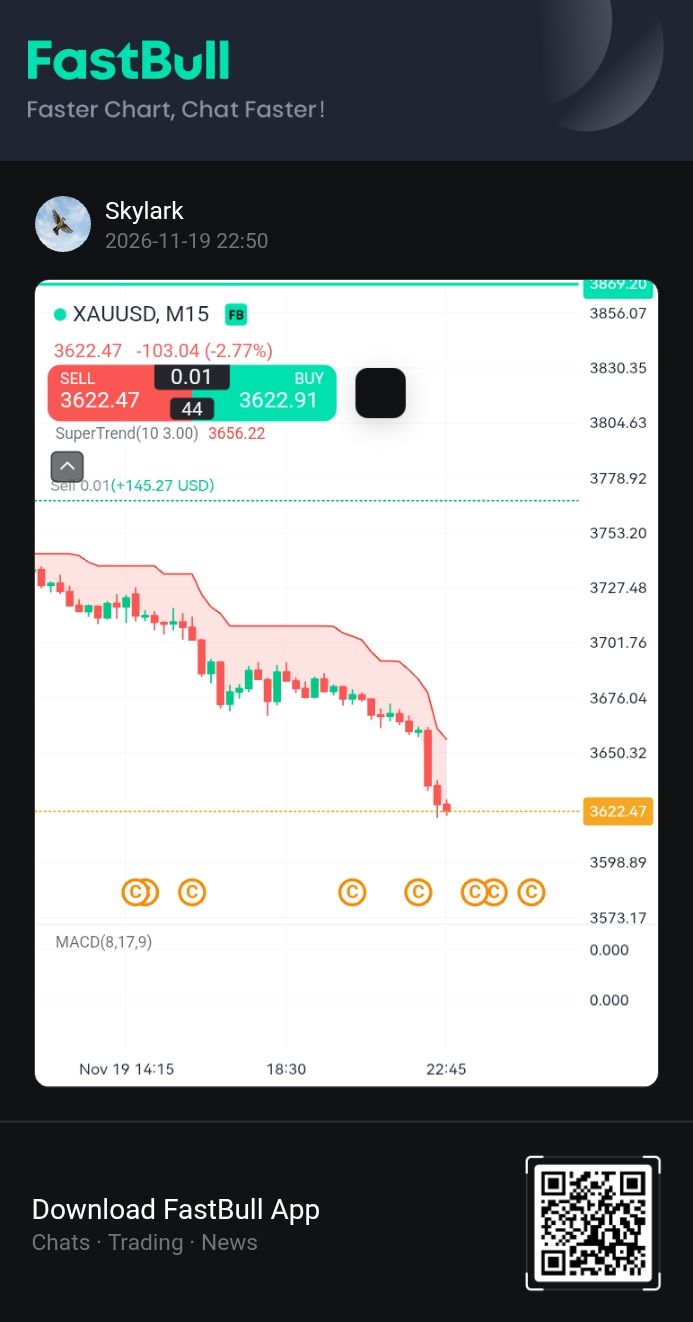
    https://m.fastbull.com/en/quotation-detail/8500_XAUUSD?shareType=4&stockId=8500_XAUUSD&symbol=XAUUSD&mainType=102&marketType=8500&dataPlatform=FB
    Skylark flag
    Skylark flag
    Skylark
    You see there was a sharp down movement and except a pullback or consolidation @Matthew
    "Skylark" recalled a message
    Skylark flag
    Matthew
    @Skylarkthe problem is how i can enter the sell
    @MatthewBefore the continuation of the downside movement so I'll advise you wait for the main Time
    Skylark flag
    Type here...
    Add Symbol or Code

      No matching data

      All
      Recommend
      Stocks
      Cryptocurrencies
      Central Banks
      Trump Updates
      Featured News
      • All
      • Russia-Ukraine Conflict
      • Middle East Flashpoint
      • All
      • Russia-Ukraine Conflict
      • Middle East Flashpoint

      Search
      Products

      Charts Free Forever

      Chats Q&A with Experts
      Screeners Economic Calendar Data Tools
      Membership Features
      Data Warehouse Market Trends Institutional Data Policy Rates Macro

      Market Trends

      Market Sentiment Order Book Forex Correlations

      Top Indicators

      Charts Free Forever
      Markets

      News

      24/7 Analysis Education

      Latest Views

      Latest Update

      Signals

      Copy Rankings Latest Signals Become a signal provider AI Rating
      Contests
      Brokers

      Overview Brokers Assessment Rankings Regulators News Claims
      Broker listing Forex Brokers Comparison Tool Live Spread Comparison Scam
      Q&A Complaint Scam Alert Videos Tips to Detect Scam
      More

      Business
      Events
      Careers About Us Advertising Help Center

      White Label

      Broker API

      Data API

      Web Plug-ins

      Affiliate Program

      Awards Institution Evaluation IB Seminar Salon Event Exhibition
      Vietnam Thailand Singapore Dubai
      Fans Party Investment Sharing Session
      FastBull Summit BrokersView Expo
      Recent Searches
        Top Searches
          Markets
          Analysis
          User
          24/7
          Economic Calendar
          Education
          Data
          • Names
          • Latest
          • Prev

          View All

          No data

          Scan to Download

          Faster Charts, Chat Faster!

          Download
          English
          • English
          • Español
          • العربية
          • Bahasa Indonesia
          • Bahasa Melayu
          • Tiếng Việt
          • ภาษาไทย
          • Français
          • Italiano
          • Türkçe
          • Русский язык
          • 简中
          • 繁中
          Open Account
          Search
          Products
          Charts Free Forever
          Markets
          News
          Signals

          Copy Rankings Latest Signals Become a signal provider AI Rating
          Contests
          Brokers

          Overview Brokers Assessment Rankings Regulators News Claims
          Broker listing Forex Brokers Comparison Tool Live Spread Comparison Scam
          Q&A Complaint Scam Alert Videos Tips to Detect Scam
          More

          Business
          Events
          Careers About Us Advertising Help Center

          White Label

          Broker API

          Data API

          Web Plug-ins

          Affiliate Program

          Awards Institution Evaluation IB Seminar Salon Event Exhibition
          Vietnam Thailand Singapore Dubai
          Fans Party Investment Sharing Session
          FastBull Summit BrokersView Expo

          Correction to the Downside Could Extend Toward 4200 Zone

          Manuel

          Bond

          Commodity

          Summary:

          This support region aligns closely with the 0.50 Fibonacci retracement level, raising the likelihood that a pullback could reach this target.

          SELL XAUUSD
          Close Time
          CLOSED

          4337.78

          Entry Price

          4240.00

          TP

          4405.00

          SL

          3624.91 -100.60 -2.70%

          672.2

          Pips

          Loss

          4240.00

          TP

          4405.09

          Exit Price

          4337.78

          Entry Price

          4405.00

          SL

          Prospects for a de-escalation in the Middle East remain limited after U.S. President Donald Trump indicated he views it as unlikely that Iran will accept the conditions set out by Washington to end the conflict. In parallel, Tehran has hardened its stance, warning that the Strait of Hormuz will remain closed as long as the United States does not accept its demands.
          Trump also reiterated his proposal to treat the strait as a zone under U.S. control and warned of potential military actions against Oman should it impede the reopening of the maritime route. For its part, Iran continues to defend its authority over the Strait of Hormuz, demanding that Washington agree to specific terms to fully restore maritime transit. Compounding these issues is the persistent disruption to commercial shipping in the Red Sea, a factor that continues to support international oil prices.
          Against this backdrop, Al Jazeera reported that a U.S. official stated there is no contradiction in the messages issued by the White House regarding negotiations with Tehran, highlighting that discussions held were constructive. Nevertheless, Trump appears to have chosen to wait until Iran is ready to move toward an agreement.
          On the economic front, U.S. data reflected a degree of slowing activity. Housing starts dropped 12.4% month-over-month in July, falling from 1.415 million to 1.239 million, weighed down by rising mortgage rates and high home prices. Similarly, industrial production expanded by just 0.2% month-over-month, missing the 0.3% growth expected by the market.
          Investor attention now turns to the release of the minutes from the Federal Reserve's latest monetary policy meeting, as market participants search for additional cues regarding the future path of interest rates.
          In fixed income markets, the yield on the 10-year U.S. Treasury note approached 4.75%, while the 30-year yield temporarily breached 5.30%—its highest level since 2007—before easing as the session progressed. An environment of elevated yields increases the opportunity cost of holding non-yielding assets, such as gold.
          On the other hand, expectations for additional monetary policy tightening have receded. According to the CME Group FedWatch Tool, markets are currently pricing in roughly a 35% probability of a rate hike in September, down from 55% recorded a week ago. This shift has driven a sharper decline in short-term yields, whereas longer maturities have shown a more restrained correction as elevated energy prices keep inflation risks tilted to the upside.Correction to the Downside Could Extend Toward 4200 Zone_1

          Technical Analysis

          XAUUSD reacted aggressively to the downside after failing to break above resistance at 4434 on three separate occasions, and price now appears poised to push firmly below the 4330 support level. If this support gives way, a fresh downward push could target the 4239 area. Positioned near this zone is the 100-period moving average at 4230, while the 200-period average sits further below at 4154. Furthermore, this support region aligns closely with the 0.50 Fibonacci retracement level, raising the likelihood that a pullback could reach this target.
          Turning to the oscillators, the RSI currently sits at 38, leaving further room to extend lower and signaling that sellers have taken control. Meanwhile, the MACD presents a bearish histogram that is beginning to gain depth once again, with the signal lines trending toward a bearish crossover of the neutral line; if realized, this would add further weight to a continued downside move.
          Trading Recommendations
          Trading direction: Sell
          Entry price: 4338
          Target price: 4240
          Stop loss: 4405
          Validity: Aug 30, 2026 15:00:00
          Risk Warnings and Disclaimers
          You understand and acknowledge that there is a high degree of risk involved in trading. Following any strategies or investment methods may lead to potential losses. The content on the site is provided by our contributors and analysts for information purposes only. You are solely responsible for determining whether any trading assets, securities, strategy, or any other product is suitable for investing based on your own investment objectives and financial situation.
          Add to Favorites
          Share
          FastBull
          Copyright © 2026 FastBull Ltd

          728 RM B 7/F GEE LOK IND BLDG NO 34 HUNG TO RD KWUN TONG KLN HONG KONG

          TelegramInstagramTwitterfacebooklinkedin
          App Store Google Play Android Windows
          Products
          Charts

          Chats

          Q&A with Experts
          Screeners
          Economic Calendar
          Data
          Tools
          Membership
          Features
          Function
          Markets
          Copy Trading
          Latest Signals
          Contests
          24/7
          Analysis
          Education
          Company
          Careers
          About Us
          Contact Us
          Advertising
          Download FastBull
          Help Center
          Feedback
          User Agreement
          Privacy Policy
          Personal Information Protection Statement
          Business

          White Label

          Broker API

          Data API

          Web Plug-ins

          Poster Maker

          Affiliate Program

          Risk Disclosure

          The risk of loss in trading financial instruments such as stocks, FX, commodities, futures, bonds, ETFs and crypto can be substantial. You may sustain a total loss of the funds that you deposit with your broker. Therefore, you should carefully consider whether such trading is suitable for you in light of your circumstances and financial resources.

          No decision to invest should be made without thoroughly conducting due diligence by yourself or consulting with your financial advisors. Our web content might not suit you since we don't know your financial conditions and investment needs. Our financial information might have latency or contain inaccuracy, so you should be fully responsible for any of your trading and investment decisions. The company will not be responsible for your capital loss.

          Without getting permission from the website, you are not allowed to copy the website's graphics, texts, or trademarks. Intellectual property rights in the content or data incorporated into this website belong to its providers and exchange merchants.

          Not Logged In

          Log in to access more features

          Connect Broker
          Become a signal provider
          Help Center
          Customer Service
          Dark Mode
          Price Up/Down Colors

          Log In

          Sign Up

          Position
          Layout
          Fullscreen
          Default to Chart
          The chart page opens by default when you visit fastbull.com