• Trade
  • Markets
  • Copy
  • Contests
  • 24/7
  • Calendar
  • Q&A
  • Chats
Screeners
SYMBOL
LAST
BID
ASK
HIGH
LOW
NET CHG.
%CHG.
SPREAD
SOURCE
SPX
S&P 500 Index
7323.63
7323.63
7323.63
7367.68
7285.76
-16.90
-0.23%
--
--
DJI
Dow Jones Industrial Average
50198.17
50198.17
50198.17
50637.70
50029.35
-561.25
-1.11%
--
--
IXIC
NASDAQ Composite Index
24429.87
24429.87
24429.87
24538.78
24225.30
+101.50
+ 0.42%
--
--
USDX
US Dollar Index
103.563
103.563
103.643
103.867
103.488
-0.119
-0.11%
--
--
EURUSD
Euro / US Dollar
1.09988
1.09988
1.09996
1.10095
1.09551
+0.00262
+ 0.24%
--
--
GBPUSD
Pound Sterling / US Dollar
1.31565
1.31565
1.31578
1.31724
1.31197
+0.00092
+ 0.07%
--
--
XAUUSD
Gold / US Dollar
3707.98
3707.98
3708.39
3758.44
3693.28
-17.53
-0.47%
--
--
WTI
Light Sweet Crude Oil
83.511
83.511
83.541
83.785
81.546
+1.742
+ 2.13%
--
--

Community Accounts

Signal Accounts
--
Profit Accounts
--
Loss Accounts
--
View More

Become a signal provider

Sell trading signals to earn additional income

View More

Guide to Copy Trading

Get started with ease and confidence

View More

Signal Accounts for Members

All Signal Accounts

Best Return
  • Best Return
  • Best P/L
  • Best MDD
Past 1W
  • Past 1W
  • Past 1M
  • Past 1Y

All Contests

  • All
  • Recommend
  • Stocks
  • Cryptocurrencies
  • Central Banks
  • Trump Updates
  • Featured News
Top News Only
Share

Federal Reserve Vice Chairman Jefferson: Energy Cost Shocks Pose A Challenge To Central Banks, Forcing Them To Weigh Inflation And Employment Risks

Share

Federal Reserve Vice Chairman Jefferson Did Not Issue A Written Comment On The Interest Rate Outlook

Share

Federal Reserve Vice Chairman Jefferson Stated That Artificial Intelligence Poses A Shock To Both Supply And Demand

Share

Poland Is Close To Reaching An Agreement With Westinghouse Electric And Bechtel On A Nuclear Power Plant

Share

Halozyme Plans To File An Infringement Lawsuit Against Merck In Germany

Share

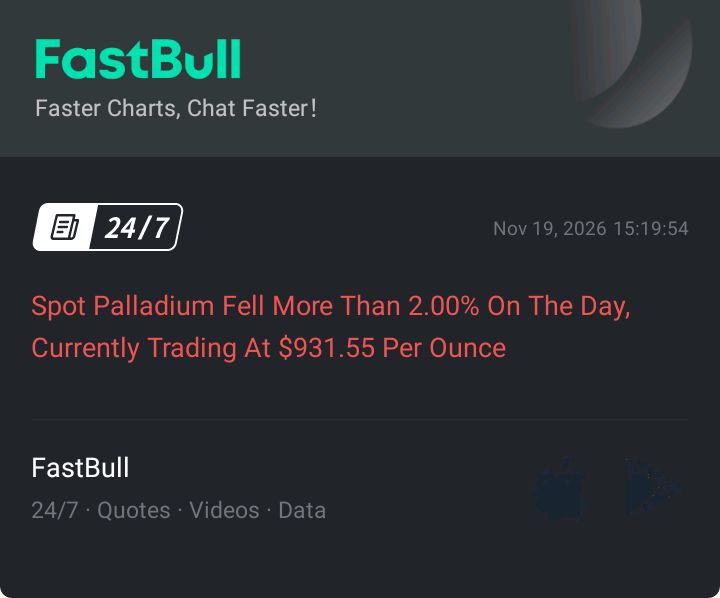
Spot Palladium Fell More Than 2.00% On The Day, Currently Trading At $931.55 Per Ounce

Share

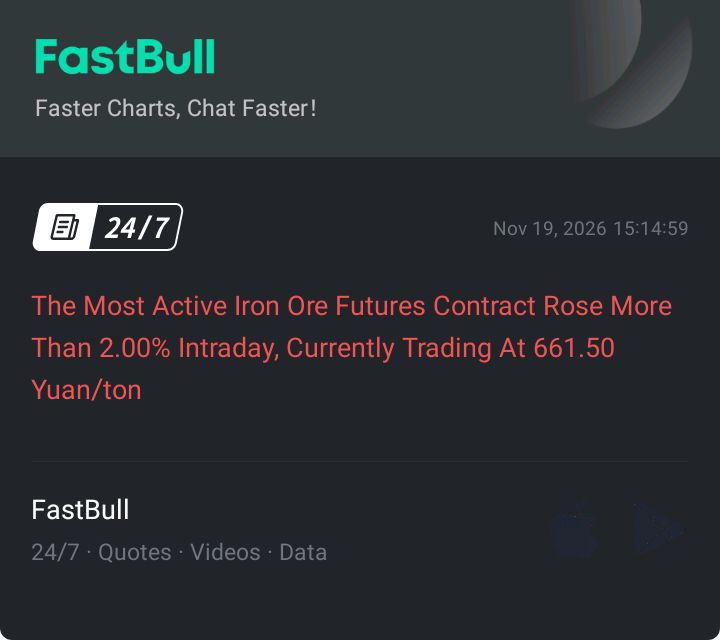
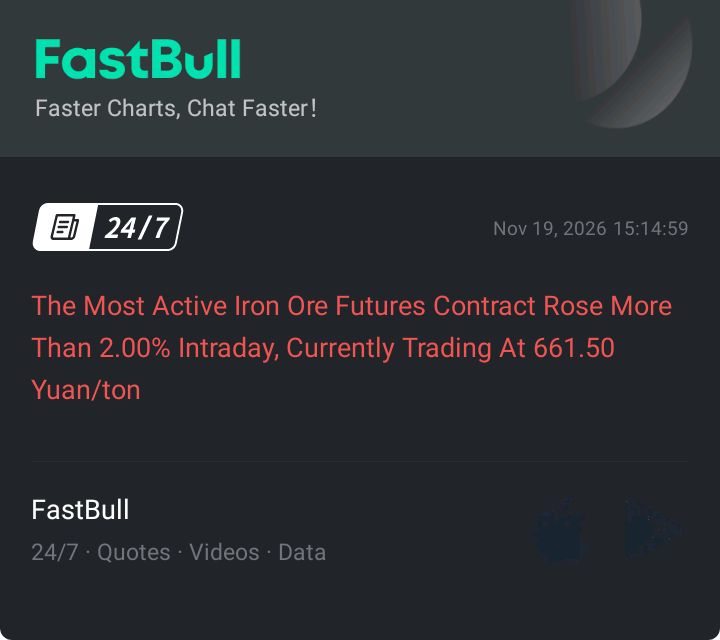
The Most Active Iron Ore Futures Contract Rose More Than 2.00% Intraday, Currently Trading At 661.50 Yuan/ton

Share

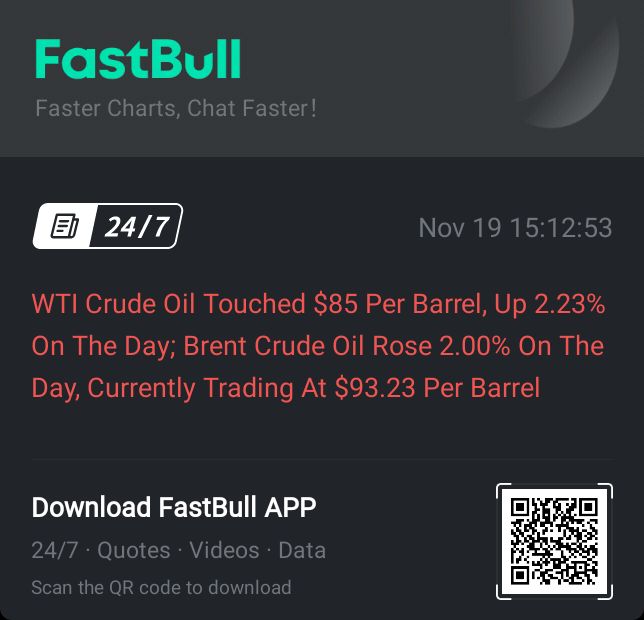
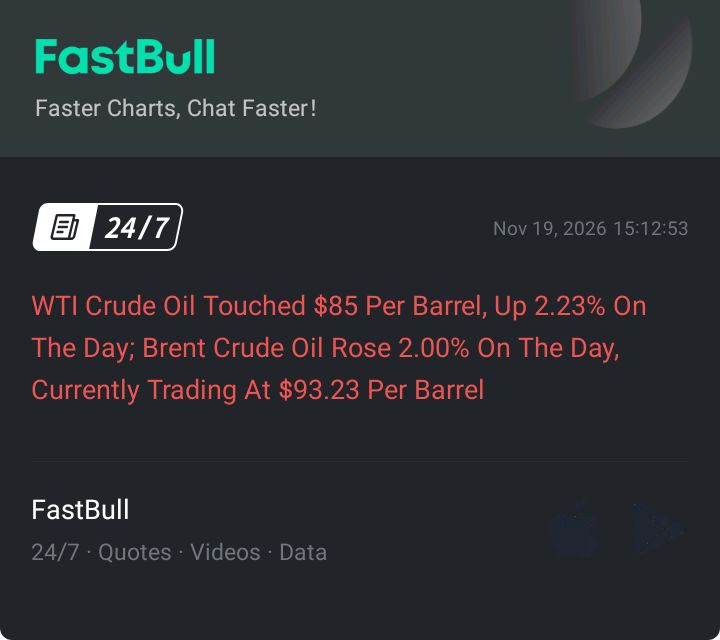
WTI Crude Oil Touched $85 Per Barrel, Up 2.23% On The Day; Brent Crude Oil Rose 2.00% On The Day, Currently Trading At $93.23 Per Barrel

Share

The Saudi Foreign Minister Held Talks With The Secretary-General Of The Mecca Union

Share

The Dutch Foreign Minister Said A Bullet Landed Behind The Dutch Embassy In Kyiv

Share

U.S. Special Envoy Jared Kushner And U.S. Middle East Special Envoy Joachim Witkoff Held “productive” Talks With German Chancellor Merz

Share

Federal Reserve Data Shows That On November 18, The Effective Federal Funds Rate In The United States Was 3.88%, With A Trading Volume Of $88 Billion; On November 17, The Rate Was 3.88%, With A Trading Volume Of $95 Billion

Share

Bank Of America Saraiva: New Fiscal Measures May Benefit Brazilian Assets

Share

US Raw Sugar Fell 2.00% On The Day, Currently Trading At 17.36 Cents Per Pound

Share

Russia And Georgia Reached A Pragmatic Agreement During Talks In Minsk

Share

Russian And Georgian Envoys Discussed Trade And Regional Security Issues

Share

South African Reserve Bank Governor: Fiscal Anchoring Helps Simplify Policy Coordination

Share

A JPMorgan Chase Spokesperson Said: "Our Services Have Not Been Affected In Any Way."

Share

A JPMorgan Chase Spokesperson Said The Company Is Aware That A Third Party Providing Services To It Has Been Targeted In A Cyberattack

Share

US President Trump Called For The Passage Of A New Agricultural Bill During The Remainder Of Congress's Term

TIME
ACT
FCST
PREV
IMPACT
U.S. EIA Weekly Cushing, Oklahoma Crude Oil Stocks Change

A:--

F: --

P: --

WTI
  • WTI
  • XAUUSD
  • XAGUSD
  • USDX
U.S. EIA Weekly Crude Demand Projected by Production

A:--

F: --

P: --

U.S. EIA Weekly Gasoline Stocks Change

A:--

F: --

P: --

WTI
  • WTI
  • XAUUSD
  • XAGUSD
  • USDX
U.S. EIA Weekly Crude Oil Imports Changes

A:--

F: --

P: --

WTI
  • WTI
  • XAUUSD
  • XAGUSD
  • USDX
U.S. EIA Weekly Heating Oil Stock Changes

A:--

F: --

P: --

WTI
  • WTI
  • XAUUSD
  • XAGUSD
  • USDX
FOMC Meeting Minutes
New York Federal Reserve President Williams delivered a speech.
Japan Core Machinery Orders MoM (Sept)

A:--

F: --

P: --

USDJPY
  • USDJPY
  • XAUUSD
  • XAGUSD
  • WTI
  • USDX
Japan Core Machinery Orders YoY (Sept)

A:--

F: --

P: --

USDJPY
  • USDJPY
  • XAUUSD
  • XAGUSD
  • WTI
  • USDX
Australia Employment (Oct)

A:--

F: --

P: --
AUDUSD
  • AUDUSD
  • XAUUSD
  • XAGUSD
  • WTI
  • USDX
Australia Labor Force Participation Rate (SA) (Oct)

A:--

F: --

P: --

AUDUSD
  • AUDUSD
  • XAUUSD
  • XAGUSD
  • WTI
  • USDX
Australia Full-time Employment (SA) (Oct)

A:--

F: --

P: --
AUDUSD
  • AUDUSD
  • XAUUSD
  • XAGUSD
  • WTI
  • USDX
Australia Unemployment Rate (SA) (Oct)

A:--

F: --

P: --

AUDUSD
  • AUDUSD
  • XAUUSD
  • XAGUSD
  • WTI
  • USDX
Euro Zone Current Account (Not SA) (Sept)

A:--

F: --

P: --

EURUSD
  • EURUSD
  • XAUUSD
  • XAGUSD
  • WTI
  • USDX
Euro Zone Current Account (SA) (Sept)

A:--

F: --

P: --

EURUSD
  • EURUSD
  • XAUUSD
  • XAGUSD
  • WTI
  • USDX
Euro Zone Labor Cost YoY (Q3)

A:--

F: --

P: --

EURUSD
  • EURUSD
  • XAUUSD
  • XAGUSD
  • WTI
  • USDX
Euro Zone Construction Output YoY (Sept)

A:--

F: --

P: --

EURUSD
  • EURUSD
  • XAUUSD
  • XAGUSD
  • WTI
  • USDX
Euro Zone Construction Output MoM (SA) (Sept)

A:--

F: --

P: --
EURUSD
  • EURUSD
  • XAUUSD
  • XAGUSD
  • WTI
  • USDX
U.K. CBI Industrial Prices Expectations (Nov)

A:--

F: --

P: --

GBPUSD
  • GBPUSD
  • XAUUSD
  • XAGUSD
  • WTI
  • USDX
U.K. CBI Industrial Trends - Orders (Nov)

A:--

F: --

P: --

GBPUSD
  • GBPUSD
  • XAUUSD
  • XAGUSD
  • WTI
  • USDX
South Africa Repo Rate

A:--

F: --

P: --

XAUUSD
  • XAUUSD
  • XAGUSD
  • WTI
  • USDX
Canada Industrial Product Price Index YoY (Oct)

A:--

F: --

P: --
USDCAD
  • USDCAD
  • XAUUSD
  • XAGUSD
  • WTI
  • USDX
U.S. Philadelphia Fed Business Activity Index (SA) (Nov)

A:--

F: --

P: --

USDX
  • USDX
  • XAUUSD
  • XAGUSD
  • WTI
Canada Industrial Product Price Index MoM (Oct)

A:--

F: --

P: --
USDCAD
  • USDCAD
  • XAUUSD
  • XAGUSD
  • WTI
  • USDX
U.S. Weekly Initial Jobless Claims (SA)

A:--

F: --

P: --
XAUUSD
  • XAUUSD
  • XAGUSD
  • WTI
  • USDX
U.S. Initial Jobless Claims 4-Week Avg. (SA)

A:--

F: --

P: --
XAUUSD
  • XAUUSD
  • XAGUSD
  • WTI
  • USDX
U.S. Weekly Continued Jobless Claims (SA)

A:--

F: --

P: --
XAUUSD
  • XAUUSD
  • XAGUSD
  • WTI
  • USDX
U.S. Philadelphia Fed Manufacturing Employment Index (Nov)

A:--

F: --

P: --

USDX
  • USDX
  • XAUUSD
  • XAGUSD
  • WTI
ECB President Lagarde Speaks
FOMC Member Hammack Speaks
U.S. Conference Board Leading Economic Index MoM (Oct)

--

F: --

P: --

U.S. Conference Board Lagging Economic Index MoM (Oct)

--

F: --

P: --

U.S. Conference Board Coincident Economic Index MoM (Oct)

--

F: --

P: --

U.S. Conference Board Leading Economic Index (Oct)

--

F: --

P: --

U.S. EIA Weekly Natural Gas Stocks Change

--

F: --

P: --

U.S. Kansas Fed Manufacturing Composite Index (Nov)

--

F: --

P: --

U.S. Kansas Fed Manufacturing Production Index (Nov)

--

F: --

P: --

U.S. 10-Year TIPS Auction Avg. Yield

--

F: --

P: --

Argentina Trade Balance (Oct)

--

F: --

P: --

Richmond Federal Reserve President Barkin delivered a speech.
South Korea PPI MoM (Oct)

--

F: --

P: --

Richmond Federal Reserve President Barkin delivered a speech.
U.S. Weekly Treasuries Held by Foreign Central Banks

--

F: --

P: --

Japan National CPI MoM (Oct)

--

F: --

P: --

Japan National CPI MoM (Not SA) (Oct)

--

F: --

P: --

Japan National Core CPI YoY (Oct)

--

F: --

P: --

Japan National CPI YoY (Oct)

--

F: --

P: --

Philadelphia Fed President Henry Paulson delivers a speech
U.K. GfK Consumer Confidence Index (Nov)

--

F: --

P: --

China, Mainland 5-Year Loan Prime Rate

--

F: --

P: --

China, Mainland 1-Year Loan Prime Rate (LPR)

--

F: --

P: --

Turkey Capacity Utilization (Nov)

--

F: --

P: --

Turkey Consumer Confidence Index (Nov)

--

F: --

P: --

Germany PPI MoM (Oct)

--

F: --

P: --

Germany PPI YoY (Oct)

--

F: --

P: --

U.K. Core Retail Sales YoY (SA) (Oct)

--

F: --

P: --

U.K. Retail Sales MoM (SA) (Oct)

--

F: --

P: --

U.K. Retail Sales YoY (SA) (Oct)

--

F: --

P: --

ECB President Lagarde Speaks
India Industrial Production Index YoY (Oct)

--

F: --

P: --

Mexico Retail Sales MoM (Sept)

--

F: --

P: --

Q&A with Experts
    • All
    • Chatrooms
    • Groups
    • Friends
    Nawhdir flag
    Skylark
    @Nawhdir 1. The Macro Trigger - Fed Turned Hawkish Again In mid-October, US inflation came in hotter than expected. CPI hit 3.7% year-on-year, and PCE later hit 3.6%, far above the Fed's 2% target. The Fed held rates at 3.75% - 4.00% on Oct 28, but the vote was 10-2, with two members voting for an immediate hike. The minutes confirmed "almost all" policymakers think further hikes would likely be appropriate. Governor Waller even talked about a 50bps hike in December. Result: Real yields rose, Dollar hit a 19-month high, and non-yielding assets like Gold and Crypto lost their appeal.
    @Skylarklet me 🙏🏻 reads patienly
    Size flag
    Nawhdir
    @Sizeya, that's why been made 1 - 2
    @NawhdirI get you, mate. Better to take a small hit and protect your capital than keep forcing trades.
    Skylark flag
    Nawhdir
    so, what catalyt start from month ago cause of falling of crypt and metal?
    @Nawhdir 2. The Oil Shock At the same time, Brent crude surged above $115-$117 on US-Iran tensions and Houthi attacks on Saudi facilities. Higher oil = higher inflation expectations = market pricing "higher-for-longer" rates. That is what directly pressured Gold and Silver, not safe-haven buying.
    Size flag
    Nawhdir
    don't worry I trading while listening zaskia gotik - bang jono remix.
    Haha, that's one way to keep the trading mood alive, mate.@Nawhdir
    SlowBear ⛅ flag
    Size flag
    Nawhdir
    don't worry I trading while listening zaskia gotik - bang jono remix.
    Just make sure the music doesn't distract you from managing those positions.@Nawhdir
    Skylark flag
    Nawhdir
    @Skylarklet me 🙏🏻 reads patienly
    @Nawhdir laugh out loud 😄 go ahead read on and understand I'll be typing more and sending them over
    Size flag
    Nawhdir
    but, but now I concerned in BTC right now. still watch
    @NawhdirFair enough, mate. BTC has been worth keeping an eye on lately..
    Skylark flag
    Skylark flag
    SlowBear ⛅ flag
    SlowBear ⛅
    are you guys seeing this, what's your take on, what do you think
    Size flag
    Nawhdir
    but, but now I concerned in BTC right now. still watch
    Are you looking for a potential reversal here or waiting for price to confirm another move in the current direction?@Nawhdir
    Skylark flag
    Nawhdir
    @Skylarklet me 🙏🏻 reads patienly
    3. The Tech / AI Correction + Forced Selling Tech sold off hard. Alphabet lost over $500B in value on AI spending concerns, Intel dropped ∼30% on weak guidance, and Nasdaq fell ∼5.3% in October. When funds get margin calls on stocks, they don't sell what they _want_ to sell, they sell what they _can_ sell fast - and that is Gold, Silver, and BTC. Gold fell ∼6.6% in October, Silver ∼18%. Goldman even cut its Gold target from $4,650 to $4,150 because of this forced selling. This is classic liquidity squeeze, same as 2008: Gold falls first during margin-call phase, before it recovers. @Nawhdir
    Nawhdir flag
    🖐 🤚 w-w-wait wait
    Nawhdir flag
    ( Nawhdir mendengus tajam! )
    Sanjeev Ku flag
    Skylark
    @Sanjeev Kusir that's true its a gift and a great knowledge given to your an hour of explanation can't give it to someone else
    @Skylark bro plz dont take it otherwise i just said its normal trading matrics which has been automated so that i dont have to keep drawing boxes and lines on chart. i trade options in indian mkt if i keep ploting manually wont be able to take a single trade in entire month as action is so fast in option prices
    SlowBear ⛅ flag
    SlowBear ⛅ flag
    Nawhdir flag
    Nawhdir
    @Skylarkthere are 3 diff place that made dynamic wahe
    #wave
    Skylark flag
    Sanjeev Ku
    @Skylark bro plz dont take it otherwise i just said its normal trading matrics which has been automated so that i dont have to keep drawing boxes and lines on chart. i trade options in indian mkt if i keep ploting manually wont be able to take a single trade in entire month as action is so fast in option prices
    @Sanjeev Kuno bro I did take it other wise I understand what you were say even I myself got some stuff which I know and people ask me to teach in an hour or 2 but I just can't summary it
    Type here...
    Add Symbol or Code

      No matching data

      All
      Recommend
      Stocks
      Cryptocurrencies
      Central Banks
      Trump Updates
      Featured News
      • All
      • Russia-Ukraine Conflict
      • Middle East Flashpoint
      • All
      • Russia-Ukraine Conflict
      • Middle East Flashpoint
      Search
      Products

      Charts Free Forever

      Chats Q&A with Experts
      Screeners Economic Calendar Data Tools
      Membership Features
      Data Warehouse Market Trends Institutional Data Policy Rates Macro

      Market Trends

      Market Sentiment Order Book Forex Correlations

      Top Indicators

      Charts Free Forever
      Markets

      News

      24/7 Analysis Education

      Latest Views

      Latest Update

      Signals

      Copy Rankings Latest Signals Become a signal provider AI Rating
      Contests
      Brokers

      Overview Brokers Assessment Rankings Regulators News Claims
      Broker listing Forex Brokers Comparison Tool Live Spread Comparison Scam
      Q&A Complaint Scam Alert Videos Tips to Detect Scam
      More

      Business
      Events
      Careers About Us Advertising Help Center

      White Label

      Broker API

      Data API

      Web Plug-ins

      Affiliate Program

      Awards Institution Evaluation IB Seminar Salon Event Exhibition
      Vietnam Thailand Singapore Dubai
      Fans Party Investment Sharing Session
      FastBull Summit BrokersView Expo
      Recent Searches
        Top Searches
          Markets
          Analysis
          User
          24/7
          Economic Calendar
          Education
          Data
          • Names
          • Latest
          • Prev

          View All

          No data

          Scan to Download

          Faster Charts, Chat Faster!

          Download
          English
          • English
          • Español
          • العربية
          • Bahasa Indonesia
          • Bahasa Melayu
          • Tiếng Việt
          • ภาษาไทย
          • Français
          • Italiano
          • Türkçe
          • Русский язык
          • 简中
          • 繁中
          Open Account
          Search
          Products
          Charts Free Forever
          Markets
          News
          Signals

          Copy Rankings Latest Signals Become a signal provider AI Rating
          Contests
          Brokers

          Overview Brokers Assessment Rankings Regulators News Claims
          Broker listing Forex Brokers Comparison Tool Live Spread Comparison Scam
          Q&A Complaint Scam Alert Videos Tips to Detect Scam
          More

          Business
          Events
          Careers About Us Advertising Help Center

          White Label

          Broker API

          Data API

          Web Plug-ins

          Affiliate Program

          Awards Institution Evaluation IB Seminar Salon Event Exhibition
          Vietnam Thailand Singapore Dubai
          Fans Party Investment Sharing Session
          FastBull Summit BrokersView Expo

          Turkey Capacity Utilization (Nov)

          Add Alert
          Alert added

          Act:--

          Fcst:--

          Prev:--

          Release Time:

          Release Schedule:Monthly

          Data Source:Turkish Statistical Institute

          Data Interpretation: Capacity utilization is the ratio of total industrial output to production capacity. The index covers eight sectors: manufacturing, mining, utilities, durable goods, non-durable goods, base metals, automobiles and gasoline. When capacity utilization exceeds 95%, it means that equipment utilization is close to full capacity, inflationary pressures will rise sharply as capacity is overwhelmed, which is a positive for the currency in the expectation that interest rates are likely to rise. On the contrary, if the capacity utilization rate is below 90% and continues to decline, it indicates that there is too much idle equipment and the economy is in recession, which is negative for the country's currency under the circumstance that the market expects that the interest rate may be lowered. Actual Data>Forecast Data, Bullish for TRY; Actual Data<Forecast Data, Bearish for TRY.
          1 Year 2 Years 5 Years All
          RELEASE TIME ACT PREV FCST

          No data

          Impact

            4 Hours After Event
            • 4 Hours After Event
            • 1 Hour After Event
            • 30 Minutes After Event
            • 15 Minutes After Event
            • 5 Minutes After Event
            Actual < Forecast
            Probability of Rise: --
            Number of Rises: --
            Probability of Fall: --
            Number of Falls: --
            Avg. Volatility: --
            Actual = Forecast
            Probability of Rise: --
            Number of Rises: --
            Probability of Fall: --
            Number of Falls: --
            Avg. Volatility: --
            Actual > Forecast
            Probability of Rise: --
            Number of Rises: --
            Probability of Fall: --
            Number of Falls: --
            Avg. Volatility: --
            Price Chart

            No data

            Impact 4 Hours After Event

            No data

            Relevant Indicators

            No data

            Create Alert
            Create
            FastBull
            Copyright © 2026 FastBull Ltd

            728 RM B 7/F GEE LOK IND BLDG NO 34 HUNG TO RD KWUN TONG KLN HONG KONG

            TelegramInstagramTwitterfacebooklinkedin
            App Store Google Play Android Windows
            Products
            Charts

            Chats

            Q&A with Experts
            Screeners
            Economic Calendar
            Data
            Tools
            Membership
            Features
            Function
            Markets
            Copy Trading
            Latest Signals
            Contests
            24/7
            Analysis
            Education
            Company
            Careers
            About Us
            Contact Us
            Advertising
            Download FastBull
            Help Center
            Feedback
            User Agreement
            Privacy Policy
            Personal Information Protection Statement
            Business

            White Label

            Broker API

            Data API

            Web Plug-ins

            Poster Maker

            Affiliate Program

            Risk Disclosure

            The risk of loss in trading financial instruments such as stocks, FX, commodities, futures, bonds, ETFs and crypto can be substantial. You may sustain a total loss of the funds that you deposit with your broker. Therefore, you should carefully consider whether such trading is suitable for you in light of your circumstances and financial resources.

            No decision to invest should be made without thoroughly conducting due diligence by yourself or consulting with your financial advisors. Our web content might not suit you since we don't know your financial conditions and investment needs. Our financial information might have latency or contain inaccuracy, so you should be fully responsible for any of your trading and investment decisions. The company will not be responsible for your capital loss.

            Without getting permission from the website, you are not allowed to copy the website's graphics, texts, or trademarks. Intellectual property rights in the content or data incorporated into this website belong to its providers and exchange merchants.

            Not Logged In

            Log in to access more features

            Connect Broker
            Become a signal provider
            Help Center
            Customer Service
            Dark Mode
            Price Up/Down Colors

            Log In

            Sign Up

            Position
            Layout
            Fullscreen
            Default to Chart
            The chart page opens by default when you visit fastbull.com