• Trade
  • Markets
  • Copy
  • Contests
  • 24/7
  • Calendar
  • Q&A
  • Chats
Screeners
SYMBOL
LAST
BID
ASK
HIGH
LOW
NET CHG.
%CHG.
SPREAD
SOURCE
SPX
S&P 500 Index
7651.34
7651.34
7651.34
7661.69
7627.87
-34.81
-0.45%
--
--
DJI
Dow Jones Industrial Average
53083.08
53083.08
53083.08
53176.60
52815.89
-102.82
-0.19%
--
--
IXIC
NASDAQ Composite Index
26176.03
26176.03
26176.03
26209.62
25995.53
-194.85
-0.74%
--
--
USDX
US Dollar Index
99.510
99.510
99.590
99.570
99.270
+0.170
+ 0.17%
--
--
EURUSD
Euro / US Dollar
1.15975
1.15975
1.15982
1.16242
1.15878
-0.00184
-0.16%
--
--
GBPUSD
Pound Sterling / US Dollar
1.35391
1.35391
1.35401
1.35590
1.35248
-0.00080
-0.06%
--
--
XAUUSD
Gold / US Dollar
4359.17
4359.17
4359.58
4461.34
4326.06
-88.82
-2.00%
--
--
WTI
Light Sweet Crude Oil
86.684
86.684
86.714
87.347
85.174
+1.301
+ 1.52%
--
--

Community Accounts

Signal Accounts
--
Profit Accounts
--
Loss Accounts
--
View More

Become a signal provider

Sell trading signals to earn additional income

View More

Guide to Copy Trading

Get started with ease and confidence

View More

Signal Accounts for Members

All Signal Accounts

Best Return
  • Best Return
  • Best P/L
  • Best MDD
Past 1W
  • Past 1W
  • Past 1M
  • Past 1Y

All Contests

  • All
  • Recommend
  • Stocks
  • Cryptocurrencies
  • Central Banks
  • Trump Updates
  • Featured News
Top News Only
Share

The U.S. Department Of Justice Continues Its Crackdown On Hamas's Terrorist Financing Schemes

Share

British Prime Minister Burnham: Fiscal Responsibility Will Be The Cornerstone Of British Policy

Share

Canadian Finance Minister François-Philippe Champagne: He Will Meet With U.S. Treasury Secretary Bessenter On Tuesday Afternoon Local Time

Share

British Prime Minister Burnham: We Will Welcome French President Macron To The UK Tomorrow

Share

Sheng Qiuping Met With Jim Farley, President And CEO Of Ford Motor, And His Delegation

Share

According To The Ukrainian Agricultural Lobby UCAB, Ukraine's Food Exports Fell 41.5% Month-on-month In August To 2.15 Million Tons

Share

U.S. Central Command: As Of September 1, The U.S. Military Has Guided 84 Merchant Ships To Change Course, Rendered 3 Ships Inoperable, And Boarded 2 Ships To Ensure They Comply With Regulations

Share

Canadian Prime Minister Carney: A Mutually Beneficial Agreement With The United States Is Still Possible

Share

Canadian Prime Minister Carney: We Never Believed That A Comprehensive Trade Agreement Was Reached With The United States While Canada Withdrew From The Negotiations

Share

Canadian Prime Minister Carney: Progress Was Made Toward A Favorable Agreement With The United States, But Disagreements Arose At The Last Minute

Share

Canadian Prime Minister Stephen Harper: U.S. Provocations Against Canada "do Not Contribute To Constructive Dialogue."

Share

Canadian Prime Minister Carney: The Terms In The U.S. Trade Negotiations Mean That Canadian Industries Will Either Become U.S. Subsidiaries Or Be Shut Down

Share

Iran: Does Not Permit U.S. Attempts To Have Ships Transit The Southern Route Of The Strait Of Hormuz

Share

Iranian Parliament Speaker Qalibaf: If The US Escalates Its Encirclement, We Will Respond Militarily Without Hesitation

Share

Canadian Prime Minister Carney: We Can Only Begin Trade Negotiations With The United States When Americans Stop Making Memes, Stop Attacking, Stop Being So Tough And Start Taking Things Seriously

Share

Canadian Prime Minister Mark Carney: (When Asked About The Insults Directed At Canada By U.S. Officials) This Is Unbecoming Of Them

Share

The Yield On U.S. 30-year Treasury Bonds Gave Back All Of Its Intraday Gains, Currently Standing At 5.236%

Share

Iran States That Its Foreign Exchange Reserves Are Sufficient

Share

The Israeli Ministry Of Agriculture Stated (regarding The Shutdown Of Desalination Plants) That The Shutdown Has Led To Water Shortages For Farmers

Share

According To RIA Novosti, The Russian Ministry Of Defense Stated That Russian Troops Struck A Cargo Ship In The Port Of Pivdenny

TIME
ACT
FCST
PREV
IMPACT
Australia Commodity Price YoY (Aug)

A:--

F: --

P: --

AUDUSD
  • AUDUSD
  • XAUUSD
  • XAGUSD
  • WTI
  • USDX
Turkey Manufacturing PMI (Aug)

A:--

F: --

P: --

XAUUSD
  • XAUUSD
  • XAGUSD
  • WTI
  • USDX
Italy Manufacturing PMI (SA) (Aug)

A:--

F: --

P: --

EURUSD
  • EURUSD
  • XAUUSD
  • XAGUSD
  • WTI
  • USDX
Euro Zone Manufacturing PMI Final (Aug)

A:--

F: --

P: --

EURUSD
  • EURUSD
  • XAUUSD
  • XAGUSD
  • WTI
  • USDX
U.K. Manufacturing PMI Prelim (Aug)

A:--

F: --

P: --

GBPUSD
  • GBPUSD
  • XAUUSD
  • XAGUSD
  • WTI
  • USDX
Italy Unemployment Rate (SA) (Jul)

A:--

F: --

P: --

EURUSD
  • EURUSD
  • XAUUSD
  • XAGUSD
  • WTI
  • USDX
U.K. M4 Money Supply YoY (Jul)

A:--

F: --

P: --

GBPUSD
  • GBPUSD
  • XAUUSD
  • XAGUSD
  • WTI
  • USDX
U.K. M4 Money Supply MoM (Jul)

A:--

F: --

P: --
GBPUSD
  • GBPUSD
  • XAUUSD
  • XAGUSD
  • WTI
  • USDX
U.K. Mortgage Approvals (Jul)

A:--

F: --

P: --
GBPUSD
  • GBPUSD
  • XAUUSD
  • XAGUSD
  • WTI
  • USDX
U.K. Mortgage Lending (Jul)

A:--

F: --

P: --
GBPUSD
  • GBPUSD
  • XAUUSD
  • XAGUSD
  • WTI
  • USDX
Italy Quarterly Unemployment Rate (SA) (Jul)

A:--

F: --

P: --
EURUSD
  • EURUSD
  • XAUUSD
  • XAGUSD
  • WTI
  • USDX
Italy HICP Prelim YoY (Aug)

A:--

F: --

P: --

EURUSD
  • EURUSD
  • XAUUSD
  • XAGUSD
  • WTI
  • USDX
Euro Zone Core CPI Prelim YoY (Aug)

A:--

F: --

P: --

EURUSD
  • EURUSD
  • XAUUSD
  • XAGUSD
  • WTI
  • USDX
Euro Zone Core CPI Prelim MoM (Aug)

A:--

F: --

P: --

EURUSD
  • EURUSD
  • XAUUSD
  • XAGUSD
  • WTI
  • USDX
South Africa Manufacturing PMI (Aug)

A:--

F: --

P: --

XAUUSD
  • XAUUSD
  • XAGUSD
  • WTI
  • USDX
Euro Zone HICP Prelim YoY (Aug)

A:--

F: --

P: --

EURUSD
  • EURUSD
  • XAUUSD
  • XAGUSD
  • WTI
  • USDX
Euro Zone Unemployment Rate (Jul)

A:--

F: --

P: --
EURUSD
  • EURUSD
  • XAUUSD
  • XAGUSD
  • WTI
  • USDX
India Trade Balance (Q2)

A:--

F: --

P: --

XAUUSD
  • XAUUSD
  • XAGUSD
  • WTI
  • USDX
Brazil GDP YoY (Q2)

A:--

F: --

P: --

XAUUSD
  • XAUUSD
  • XAGUSD
  • WTI
  • USDX
U.S. Weekly Redbook Index YoY

A:--

F: --

P: --

XAUUSD
  • XAUUSD
  • XAGUSD
  • WTI
  • USDX
Brazil IHS Markit Manufacturing PMI (Aug)

A:--

F: --

P: --

XAUUSD
  • XAUUSD
  • XAGUSD
  • WTI
  • USDX
Canada Manufacturing PMI (SA) (Aug)

A:--

F: --

P: --

USDCAD
  • USDCAD
  • XAUUSD
  • XAGUSD
  • WTI
  • USDX
U.S. IHS Markit Manufacturing PMI Final (Aug)

A:--

F: --

P: --

USDX
  • USDX
  • XAUUSD
  • XAGUSD
  • WTI
U.S. ISM Manufacturing PMI (Aug)

A:--

F: --

P: --

USDX
  • USDX
  • XAUUSD
  • XAGUSD
  • WTI
U.S. ISM Manufacturing Employment Index (Aug)

A:--

F: --

P: --

USDX
  • USDX
  • XAUUSD
  • XAGUSD
  • WTI
U.S. ISM Manufacturing New Orders Index (Aug)

A:--

F: --

P: --

USDX
  • USDX
  • XAUUSD
  • XAGUSD
  • WTI
U.S. JOLTS Job Openings (SA) (Jul)

A:--

F: --

P: --
XAUUSD
  • XAUUSD
  • XAGUSD
  • WTI
  • USDX
U.S. Construction Spending MoM (Jul)

A:--

F: --

P: --
USDX
  • USDX
  • XAUUSD
  • XAGUSD
  • WTI
U.S. ISM Output Index (Aug)

A:--

F: --

P: --

USDX
  • USDX
  • XAUUSD
  • XAGUSD
  • WTI
U.S. ISM Inventories Index (Aug)

A:--

F: --

P: --

USDX
  • USDX
  • XAUUSD
  • XAGUSD
  • WTI
Mexico Manufacturing PMI (Aug)

--

F: --

P: --

U.S. API Weekly Crude Oil Stocks

--

F: --

P: --

U.S. API Weekly Gasoline Stocks

--

F: --

P: --

U.S. API Weekly Cushing Crude Oil Stocks

--

F: --

P: --

U.S. API Weekly Refined Oil Stocks

--

F: --

P: --

South Korea CPI YoY (Aug)

--

F: --

P: --

Japan Monetary Base YoY (SA) (Aug)

--

F: --

P: --

Australia GDP YoY (SA) (Q2)

--

F: --

P: --

Australia GDP QoQ (SA) (Q2)

--

F: --

P: --

Australia Chain-Weighted GDP Price Index QoQ (Q2)

--

F: --

P: --

Italy PPI YoY (Jul)

--

F: --

P: --

U.S. MBA Mortgage Application Activity Index WoW

--

F: --

P: --

U.S. ADP Employment (Aug)

--

F: --

P: --

Canada Overnight Target Rate

--

F: --

P: --

BOC Monetary Policy Report
U.S. Factory Orders MoM (Jul)

--

F: --

P: --

U.S. Factory Orders MoM (Excl. Transport) (Jul)

--

F: --

P: --

U.S. Factory Orders MoM (Excl. Defense) (Jul)

--

F: --

P: --

U.S. EIA Weekly Crude Oil Imports Changes

--

F: --

P: --

U.S. EIA Weekly Heating Oil Stock Changes

--

F: --

P: --

U.S. EIA Weekly Gasoline Stocks Change

--

F: --

P: --

U.S. EIA Weekly Crude Stocks Change

--

F: --

P: --

U.S. EIA Weekly Crude Demand Projected by Production

--

F: --

P: --

U.S. EIA Weekly Cushing, Oklahoma Crude Oil Stocks Change

--

F: --

P: --

BOC Press Conference
Russia Retail Sales YoY (Jul)

--

F: --

P: --

Russia Unemployment Rate (Jul)

--

F: --

P: --

Australia Services PMI Prelim (Aug)

--

F: --

P: --

Japan IHS Markit Composite PMI (Aug)

--

F: --

P: --

Japan IHS Markit Services PMI (Aug)

--

F: --

P: --

Australia Trade Balance (SA) (Jul)

--

F: --

P: --

Q&A with Experts
    • All
    • Chatrooms
    • Groups
    • Friends
    Size flag
    5379814
    hi everyone
    @Visitor5379814Hey mate, welcome here.. How are you doing today?
    Nawhdir flag
    Size
    The 77,399 target gives the trade a solid risk-to-reward if sellers maintain control@Nawhdir
    @Sizeamat sangat mudah bagi pasar tuk meludahi wajahku
    Size flag
    Nawhdir
    @Size👌😂 whatever
    @NawhdirHaha, fair enough mate. Let’s see how BTC handles that level first, the reaction will tell the story.
    1KWEP5E5NR flag
    EuroTrader
    @1KWEP5E5NRokay you can wait and practice on a demo account for now til you get money to fund
    @EuroTraderyes sir, how many positions will i open at the same time, please can I have your WhatsApp number
    Nawhdir flag
    sebab pasar selama ini sudah berbuat baik sebenarnya. Tumbal kita cuma manfaatkan R : R yang agak besar kok
    Size flag
    Nawhdir
    @Sizeaku memancing amarah pasar dengan jarak SL yang segitu 😂
    @NawhdirHaha, you definitely gave the trade some room to breathe there.
    Nawhdir flag
    Size
    @NawhdirHaha, you definitely gave the trade some room to breathe there.
    @Sizeroom to breathe mate
    Size flag
    Let’s see if BTC respects the setup now, especially with price still hovering around the 78k area@Nawhdir
    Nawhdir flag
    Size
    Let’s see if BTC respects the setup now, especially with price still hovering around the 78k area@Nawhdir
    @Sizeyealh..
    Size flag
    Nawhdir
    @Sizeamat sangat mudah bagi pasar tuk meludahi wajahku
    @NawhdirHaha, that’s the nature of BTC mate. The market can humble a setup pretty quickly
    Nawhdir flag
    rekonsiliasi reklamasi celana dalam.
    5379864 flag
    can someone help me
    Size flag
    Let’s see whether the sellers actually follow through or price comes back for that SL@Nawhdir
    Nawhdir flag
    Size
    Let’s see whether the sellers actually follow through or price comes back for that SL@Nawhdir
    @Sizeya namun kudu korban secercah nyawa (saldo) sedikit tuk dibakar
    zenko flag
    5379864
    can someone help me
    @Pengunjung5379864apakah anda butuh uang atau butuh analisa.atau kucing anda melahirkan.apa yang bisa kita bantu
    Size flag
    Nawhdir
    sebab pasar selama ini sudah berbuat baik sebenarnya. Tumbal kita cuma manfaatkan R : R yang agak besar kok
    @NawhdirExactly mate, I can see your wins for today. You’re absolutely killing it.
    SlowBear ⛅ flag
    EuroTrader
    @SlowBear ⛅this is the thing with scalping, we take losses and two winners brong us back in deep profits
    @EuroTrader Oh yes, that is why scalper tends to live day by day with strong facial expression haha
    SlowBear ⛅ flag
    5379864
    can someone help me
    @5379864What do you need hwlp with mate?
    Size flag
    Nawhdir
    @Sizeroom to breathe mate
    Taking the larger R:R makes sense as long as the risk stays controlled.
    Size flag
    5379864
    can someone help me
    Sure mate, what are you looking at? Drop the pair or chart and let’s have a look...
    Type here...
    Add Symbol or Code

      No matching data

      All
      Recommend
      Stocks
      Cryptocurrencies
      Central Banks
      Trump Updates
      Featured News
      • All
      • Russia-Ukraine Conflict
      • Middle East Flashpoint
      • All
      • Russia-Ukraine Conflict
      • Middle East Flashpoint
      Search
      Products

      Charts Free Forever

      Chats Q&A with Experts
      Screeners Economic Calendar Data Tools
      Membership Features
      Data Warehouse Market Trends Institutional Data Policy Rates Macro

      Market Trends

      Market Sentiment Order Book Forex Correlations

      Top Indicators

      Charts Free Forever
      Markets

      News

      24/7 Analysis Education

      Latest Views

      Latest Update

      Signals

      Copy Rankings Latest Signals Become a signal provider AI Rating
      Contests
      Brokers

      Overview Brokers Assessment Rankings Regulators News Claims
      Broker listing Forex Brokers Comparison Tool Live Spread Comparison Scam
      Q&A Complaint Scam Alert Videos Tips to Detect Scam
      More

      Business
      Events
      Careers About Us Advertising Help Center

      White Label

      Broker API

      Data API

      Web Plug-ins

      Affiliate Program

      Awards Institution Evaluation IB Seminar Salon Event Exhibition
      Vietnam Thailand Singapore Dubai
      Fans Party Investment Sharing Session
      FastBull Summit BrokersView Expo
      Recent Searches
        Top Searches
          Markets
          Analysis
          User
          24/7
          Economic Calendar
          Education
          Data
          • Names
          • Latest
          • Prev

          View All

          No data

          Scan to Download

          Faster Charts, Chat Faster!

          Download
          English
          • English
          • Español
          • العربية
          • Bahasa Indonesia
          • Bahasa Melayu
          • Tiếng Việt
          • ภาษาไทย
          • Français
          • Italiano
          • Türkçe
          • Русский язык
          • 简中
          • 繁中
          Open Account
          Search
          Products
          Charts Free Forever
          Markets
          News
          Signals

          Copy Rankings Latest Signals Become a signal provider AI Rating
          Contests
          Brokers

          Overview Brokers Assessment Rankings Regulators News Claims
          Broker listing Forex Brokers Comparison Tool Live Spread Comparison Scam
          Q&A Complaint Scam Alert Videos Tips to Detect Scam
          More

          Business
          Events
          Careers About Us Advertising Help Center

          White Label

          Broker API

          Data API

          Web Plug-ins

          Affiliate Program

          Awards Institution Evaluation IB Seminar Salon Event Exhibition
          Vietnam Thailand Singapore Dubai
          Fans Party Investment Sharing Session
          FastBull Summit BrokersView Expo

          How to Draw Support and Resistance Zones and Spot False Breakouts

          zhan chen

          Commodity

          Stocks

          Forex

          Summary:

          Learn to draw support and resistance zones, use ATR and bar closes to confirm breakouts, assess retests, volume and open interest, and identify false breakouts.
          How to Draw Support and Resistance Zones and Spot False Breakouts_1

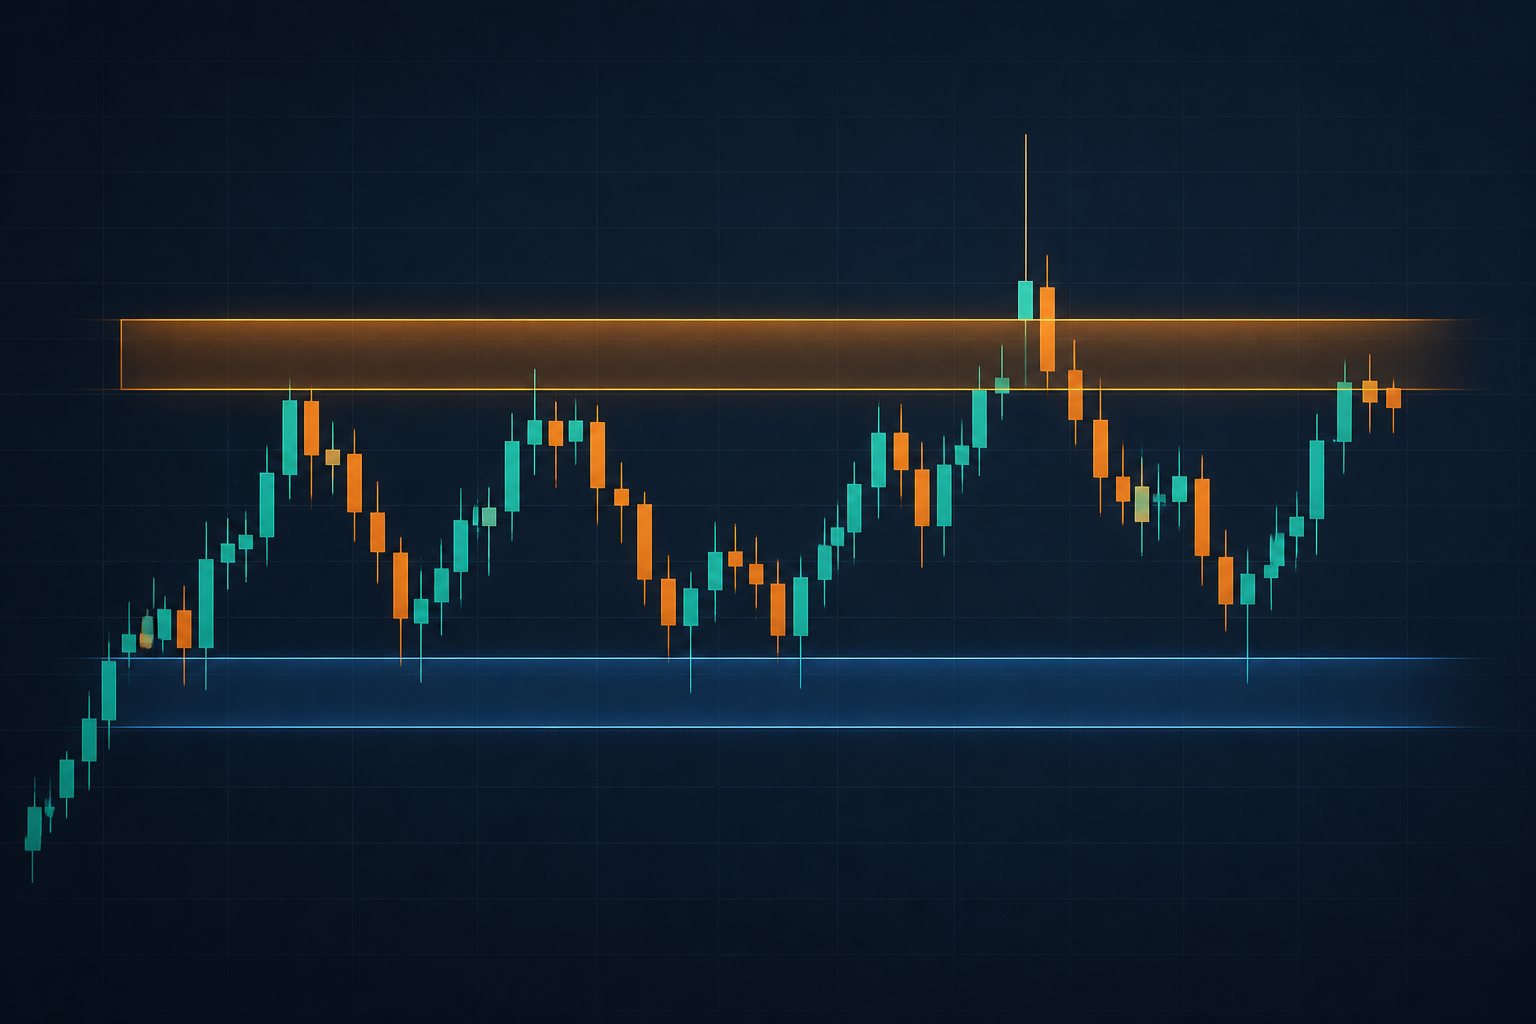
          Support and resistance create a seductive illusion of precision. Draw a horizontal line carefully enough, the story goes, and price should obey it. Markets are less tidy. Change the quote feed, trading session, equity-adjustment method or futures contract and the wick may move slightly. Even on identical data, orders do not accumulate at one perfect decimal. A brief excursion beyond a level may reflect spread expansion, thin liquidity or price discovery; it may also be the first sign that the market is relocating its accepted range.

          This is Part 3 of the Financial Chart Basics series. The previous practical guide to moving averages placed crossovers inside trend, location and volatility. This instalment tackles the structural question underneath them: how to draw support and resistance as zones, when a boundary crossing becomes acceptance outside the old range, what must happen before resistance can act as support, and how to define a false breakout before seeing the outcome.

          Support and resistance are zones, not orders waiting on a line

          Support is an area where a decline previously met enough demand, two-way trade or short covering to pause or reverse. Resistance is an area where an advance previously met enough supply, profit-taking or opposing interest to stall. These are descriptions of recorded behaviour, not proof that the same orders remain in place today. A historical high-volume area is not a live order book: the former reflects completed transactions, while the latter displays currently visible orders that can be amended or cancelled.

          A useful zone has three layers. Its core is the band containing repeated closes, opens or sustained trade. Its outer boundary is set by representative wick extremes, gap edges or points of rapid rejection. Its volatility allowance absorbs normal feed, session and timeframe noise. A centre line can help the eye, but confirmation and invalidation should refer to the whole area.

          Precision is not the same as evidence. Missing a line by one tick does not prove that support worked perfectly; trading one tick through it does not prove that the level failed. If the conclusion depends entirely on the last decimal, the analysis is measuring chart resolution rather than market structure.

          Build a zone from closes, wicks and repeated trading activity

          Start with confirmed swing highs and lows, the edges of a sustained range or a meaningful gap. Then separate three kinds of evidence. A cluster of closes suggests that the market previously spent time accepting prices there and is a sensible basis for the core. Wicks show where price travelled but failed to remain and are more useful for the outer rejection boundary. Heavy historical activity shows participation, but it may create either a future reference point or another area of two-way congestion.

          A reproducible process is more valuable than the prettiest line:

          1. Move one timeframe higher and mark only completed swings and established ranges. Do not let an unfinished bar define the zone.
          2. Use clusters of opens, closes and overlapping bodies for the core rather than allowing one exceptional wick to dominate it.
          3. Use representative wicks, gap edges and rapid rejection points for the outer boundary. Record whether a data release, earnings announcement or liquidity disruption produced them.
          4. Treat several adjacent bars probing the same area as one test. Counting every bar separately exaggerates the evidence.
          5. Merge heavily overlapping zones. If horizontal bands cover the entire chart, the selection rule no longer discriminates between useful and ordinary prices.

          Nor is “more tests mean a stronger level” a law. Reactions that repeatedly travel a meaningful distance away can strengthen the case that participants recognise an area. Rebounds that become progressively shorter while closes press against the boundary may instead show that available demand or supply is being absorbed. The number of tests matters only when read alongside reaction distance, speed, time spent at the boundary and the structure that follows.

          Scale zone width and breakout distance with ATR

          A ten-point tolerance cannot carry the same meaning in EUR/USD, gold, an individual share and an equity-index future. Average True Range provides a common volatility language. The single-period true range is:

          TR_t = max(H_t - L_t, |H_t - C_(t-1)|, |L_t - C_(t-1)|)

          Smoothing TR over the chosen window gives ATR. If P₀ is the centre of a prospective level, a volatility-adjusted research zone can be expressed as:

          Zone = [P₀ - q × ATR_n, P₀ + q × ATR_n]

          When the area already has a lower boundary D and an upper boundary U, the same principle can add an allowance to either side. The normalised strength of an upward close beyond the zone is:

          B_t(up) = (C_t - U) / ATR_t

          This distinguishes a close that barely exceeds normal quote noise from one that has travelled materially beyond the old area. It does not create a universal threshold. The choice of q, ATR window and confirmation horizon depends on the instrument, timeframe, session, gap behaviour and trading costs. Calling every move above 0.5 ATR a genuine breakout merely replaces subjective drawing with an untested parameter. Thresholds require out-of-sample and cost-sensitive validation.

          A boundary crossing is not acceptance: follow the evidence chain

          An intraday high above resistance is a breakout candidate, not a completed verdict. Evidence normally progresses through five states: approach, intrabar test, close beyond the boundary, acceptance outside the area, then continuation or retest. An upside case becomes more credible when the body closes above the zone, the close has a meaningful ATR-scaled margin, it sits near the bar high, later bars mostly remain outside, a pullback does not immediately re-enter the former range, and spreads and liquidity make the move tradable rather than theoretical.

          Close Location Value can add one narrowly defined observation:

          CLV = [(Close - Low) - (High - Close)] / (High - Low)

          CLV approaches 1 when the close is near the high, -1 when it is near the low and 0 around the middle of the range. It is undefined when H equals L. The measure describes the location of one close; it does not prove that buyers or sellers must control the next bar.

          Rejection can appear as a wick through the boundary followed by a close back inside, one close outside followed by rapid re-entry, an inability to extend the distance, or the failure of the swing created by a retest. A long upper wick is rejection evidence, not an automatic false breakout. One body close beyond the zone is stronger evidence than a wick, but it still cannot guarantee continuation.

          A false breakout therefore needs an ex-ante definition: price crosses a pre-defined boundary, returns to the old area within a specified decision horizon, and triggers a structural invalidation condition. Labelling every breakout that eventually stops trending as “false” is hindsight, not analysis.

          When does old resistance really become new support?

          Role reversal is not activated by drawing an arrow from “resistance” to “support”. At least three events are required: price first gains acceptance above the former resistance zone; a pullback then reaches or approaches that area; and completed bars reclaim the upper side before price clears the small swing high created by the response. The logic is reversed after a downside break.

          A plan can specify confirmation before the test arrives. For example: the breakout bar closes above U; the retest low enters the ATR allowance; most closes do not persist below the lower edge; and price subsequently expands away from the zone. Corresponding invalidation can be a sustained return to the old range, a close through the retest swing low, or an event-driven change in volatility and spreads that makes the original execution assumptions unusable.

          Waiting for a retest may reduce the risk of chasing, but a clean breakout may never return. The first retest is not inherently safe either. Repeated visits can make a zone more visible while simultaneously consuming resting liquidity. Choosing between following a confirmed close and waiting for a retest is a trade-off between earlier participation and a higher evidence threshold, not a cost-free way to improve the win rate.

          A lower-timeframe break can remain inside a higher-timeframe zone

          A disciplined multi-timeframe process assigns three jobs. The higher timeframe defines the principal zones and market regime. The decision timeframe evaluates tests, acceptance and rejection. The lower timeframe refines execution and locates invalidation. A 15-minute close above a thin line does not mean daily resistance has disappeared; price may simply have moved from the lower edge of a broad daily zone to its upper edge.

          Higher-timeframe areas are normally wider and slower to confirm. Lower timeframes reveal more detail but carry more spread, session and event noise. An unfinished daily bar can move in and out of “breakout” status several times. A backtest that uses the final daily close to direct trades earlier in that same day has introduced look-ahead bias. Analysis timeframe, intended holding period and invalidation horizon must refer to the same decision problem.

          On FastBull Charts, mark the high-timeframe zone first, then step down to see how price enters, pauses and leaves it. Readers who need to revisit wick information, completed closes and swing structure can use Part 1: How to Read a Candlestick Chart as the common foundation.

          Four markets, four different data problems

          Forex: a data-release wick can be a feed and spread event

          Setup. A central-bank decision, inflation release or labour report sends EUR/USD briefly through the edge of a range. Bid, ask and midpoint charts can print different extremes; providers may use different daily cut-offs; and spot FX tick volume measures feed-specific quote changes rather than total global turnover.

          Confirmation. The continuation case improves only after liquidity and spreads return to executable conditions, completed bars still close outside the zone, most subsequent closes remain there and the ATR-scaled distance does not immediately collapse. Those observations indicate acceptance, not merely one exceptional quote.

          Invalidation. If price quickly returns to the pre-release range and breaks the short-term structure created after the move, the breakout thesis has failed. The correct response is to withdraw the thesis, not automatically trade in the opposite direction.

          Gold: spot levels cannot inherit futures-volume conclusions

          Setup. XAU/USD crosses a prior high while activity changes in gold futures. Spot and futures are closely related, but their venues, sessions, prices and extremes are not identical. Centralised futures volume can inform participation; it cannot be described as the total volume of the global spot market.

          Confirmation. Evidence strengthens when completed spot bars remain beyond the zone after the initial event shock, the area still qualifies after being rescaled to the new ATR regime, and price continues to build structure outside rather than relying on one long wick.

          Invalidation. If expanded volatility carries price straight back into the old area, or the apparent break exists only on one spot or futures series, an event overshoot is more plausible than durable acceptance. The original confirmation standard must be downgraded.

          Equities: an earnings gap may offer no trade near old resistance

          Setup. An earnings announcement gaps a share above resistance. The chart appears to confirm a break at the old boundary, yet the first realistically available price may be far higher. Pre-market, after-hours and regular-session liquidity are different, and corporate actions can redraw adjusted history.

          Confirmation. The case improves when regular-session trade remains above the zone, volume is strong relative to the same time of day, the close preserves the meaningful part of the gap, and the adjustment method has been checked so that the break is not an artefact of a split, dividend or other corporate action.

          Invalidation. A gap fill followed by a close back in the old area invalidates the acceptance thesis. A test also cannot confirm the breakout at the close and simultaneously assume frictionless execution at that identical closing price.

          Futures: a contract roll can manufacture a long-term breakout

          Setup. A stitched continuous series jumps as the active month rolls, apparently clearing multi-year resistance. The individual tradable contracts may show no comparable move because their absolute prices reflect different delivery months and calendar spreads.

          Confirmation. The relevant contract must display the same completed close and structural follow-through. Settlement conventions must be consistent, while volume and open interest should be migrating normally into the new active contract rather than signalling a data anomaly.

          Invalidation. Discard the signal when it exists only in an adjusted continuous series or disappears on the tradable contract. Historical analysis must also include tick size, slippage, price limits and roll costs.

          What volume and open interest can—and cannot—confirm

          Rising volume means that participation increased; it does not by itself prove that “buyer money flowed in”, because every completed trade has both a buyer and a seller. Relative volume should compare current activity with a median for equivalent times of day, avoiding the mistake of treating naturally busy equity opens or futures sessions as exceptional. Spot-FX tick volume, exchange equity volume and contract-level futures volume are useful in different ways and should not be treated as interchangeable.

          The change in futures open interest is:

          ΔOI_t = OI_t - OI_(t-1)

          Higher open interest means that more contracts remain outstanding, not that only new longs entered. Every open contract has a long and a short side. Rising price, volume and open interest together may suggest that new positions are participating, but they cannot guarantee further gains or identify every participant's motive. During a roll, falling open interest in the old contract and rising open interest in the next often reflects position migration rather than a directional signal.

          Turn the zone into a falsifiable state machine

          The largest improvement rarely comes from adding another indicator. It comes from defining what evidence each state requires before price reaches the area. The same sequence can support pre-trade planning, bar-by-bar replay and post-trade review:

          StateEvidence to recordUpgrade conditionDowngrade or invalidation
          Zone marked in advanceOrigin, boundaries, timeframe, quote and data conventionPrice enters the volatility allowanceAdjustment or regime change removes comparability
          TestHigh and low inside the area, close location, volatility and sessionA completed bar closes with its body beyond the boundaryPrice rejects the area without changing structure
          Breakout candidateATR-scaled excess, CLV, spread and executable liquidityMost subsequent closes remain outsideRapid re-entry into the old range
          Acceptance outsideTime held, structural follow-through and relative activityA new swing forms or a valid retest completesRepeated closes return inside and structure breaks
          Role reversalRetest depth, reclaimed close and response structurePrice expands away from the zone againThe pre-defined retest swing fails

          Use the FastBull Economic Calendar to mark central-bank decisions, inflation, employment, inventories and corporate events before the test. Events do not erase every technical zone, but they alter volatility, spreads and execution. The appropriate response may be a wider research allowance, later confirmation or no decision at all during conditions in which the assumed trade could not have been executed.

          Eight backtest errors that make levels look infallible

          1. Swing-confirmation look-ahead. A swing high normally needs bars to its right before it is confirmed. The test cannot assume the level was known on the high itself.
          2. Drawing after seeing the chart. Completed history makes successful zones obvious while failed and ambiguous candidates disappear from the sample.
          3. Unknown intrabar path. OHLC proves that the high and low occurred, but not whether price broke out, hit a stop or reached a target first.
          4. Same-close execution bias. The model confirms the signal at the close and then assumes an order filled at that same close with no friction.
          5. Parameter overfitting. ATR multipliers, zone widths and confirmation counts are searched repeatedly until the most flattering combination survives.
          6. Overlapping signals. Adjacent bars testing the same zone are counted as independent observations, inflating both sample size and confidence.
          7. Data-construction bias. Equity adjustments, FX cut-off times, spot-versus-futures differences and continuous-contract rolls are ignored.
          8. Missing costs and impossible fills. Spread, commission, slippage, gaps, financing, overnight charges, roll costs and price-limit constraints are omitted.

          A useful report goes beyond “breakout win rate”. It should show median ATR-normalised returns over several horizons, maximum favourable and adverse excursion, the proportion of signals that re-entered the old area, time from break to invalidation, the observed frequency of retests, and out-of-sample results after costs. A result that collapses when neighbouring parameters change slightly has probably memorised noise.

          The 30-second conclusion: draw support and resistance as justified areas with explicit boundaries and a volatility allowance. When price arrives, observe the intrabar test, completed close, acceptance outside, retest and structural invalidation in that order. A wick beyond the zone is not automatically a false breakout; a close beyond it is not automatically genuine. The value lies in specifying confirmation, invalidation, data conventions and executable conditions before the market reveals the answer.

          Next in the series: volume, relative volume and open interest—what “high volume” can confirm, why every trade still has two sides, and why activity data cannot be compared across markets without understanding how it was constructed.

          Risk notice: this article is for financial education only and is not trading or investment advice. Support, resistance, ATR, volume and historical backtests cannot guarantee future results. Any decision must also reflect personal objectives, risk tolerance, transaction costs and market liquidity.

          Risk Warnings and Disclaimers
          You understand and acknowledge that there is a high degree of risk involved in trading. Following any strategies or investment methods may lead to potential losses. The content on the site is provided by our contributors and analysts for information purposes only. You are solely responsible for determining whether any trading assets, securities, strategy, or any other product is suitable for investing based on your own investment objectives and financial situation.
          Add to Favorites
          Share
          FastBull
          Copyright © 2026 FastBull Ltd

          728 RM B 7/F GEE LOK IND BLDG NO 34 HUNG TO RD KWUN TONG KLN HONG KONG

          TelegramInstagramTwitterfacebooklinkedin
          App Store Google Play Android Windows
          Products
          Charts

          Chats

          Q&A with Experts
          Screeners
          Economic Calendar
          Data
          Tools
          Membership
          Features
          Function
          Markets
          Copy Trading
          Latest Signals
          Contests
          24/7
          Analysis
          Education
          Company
          Careers
          About Us
          Contact Us
          Advertising
          Download FastBull
          Help Center
          Feedback
          User Agreement
          Privacy Policy
          Personal Information Protection Statement
          Business

          White Label

          Broker API

          Data API

          Web Plug-ins

          Poster Maker

          Affiliate Program

          Risk Disclosure

          The risk of loss in trading financial instruments such as stocks, FX, commodities, futures, bonds, ETFs and crypto can be substantial. You may sustain a total loss of the funds that you deposit with your broker. Therefore, you should carefully consider whether such trading is suitable for you in light of your circumstances and financial resources.

          No decision to invest should be made without thoroughly conducting due diligence by yourself or consulting with your financial advisors. Our web content might not suit you since we don't know your financial conditions and investment needs. Our financial information might have latency or contain inaccuracy, so you should be fully responsible for any of your trading and investment decisions. The company will not be responsible for your capital loss.

          Without getting permission from the website, you are not allowed to copy the website's graphics, texts, or trademarks. Intellectual property rights in the content or data incorporated into this website belong to its providers and exchange merchants.

          Not Logged In

          Log in to access more features

          Connect Broker
          Become a signal provider
          Help Center
          Customer Service
          Dark Mode
          Price Up/Down Colors

          Log In

          Sign Up

          Position
          Layout
          Fullscreen
          Default to Chart
          The chart page opens by default when you visit fastbull.com