• Trade
  • Markets
  • Copy
  • Contests
  • 24/7
  • Calendar
  • Q&A
  • Chats
Screeners
SYMBOL
LAST
BID
ASK
HIGH
LOW
NET CHG.
%CHG.
SPREAD
SOURCE
SPX
S&P 500 Index
7718.61
7718.61
7718.61
7750.19
7706.12
-29.09
-0.38%
--
--
DJI
Dow Jones Industrial Average
53414.25
53414.25
53414.25
53635.35
53289.88
-271.86
-0.51%
--
--
IXIC
NASDAQ Composite Index
26506.98
26506.98
26506.98
26628.58
26444.84
-77.07
-0.29%
--
--
USDX
US Dollar Index
99.110
99.110
99.190
99.140
99.010
+0.040
+ 0.04%
--
--
EURUSD
Euro / US Dollar
1.16102
1.16102
1.16111
1.16199
1.16047
-0.00021
-0.02%
--
--
GBPUSD
Pound Sterling / US Dollar
1.35104
1.35104
1.35116
1.35216
1.35050
-0.00051
-0.04%
--
--
XAUUSD
Gold / US Dollar
4405.35
4405.35
4405.73
4435.09
4389.55
-25.03
-0.56%
--
--
WTI
Light Sweet Crude Oil
90.361
90.361
90.396
90.532
89.664
+1.058
+ 1.18%
--
--

Community Accounts

Signal Accounts
--
Profit Accounts
--
Loss Accounts
--
View More

Become a signal provider

Sell trading signals to earn additional income

View More

Guide to Copy Trading

Get started with ease and confidence

View More

Signal Accounts for Members

All Signal Accounts

Best Return
  • Best Return
  • Best P/L
  • Best MDD
Past 1W
  • Past 1W
  • Past 1M
  • Past 1Y

All Contests

  • All
  • Recommend
  • Stocks
  • Cryptocurrencies
  • Central Banks
  • Trump Updates
  • Featured News
Top News Only
Share

Macquarie: Expects The Federal Reserve To Raise Interest Rates By 25 Basis Points In September 2026 (earlier Than The Previously Forecast Hike In December)

Share

Macquarie: We Still Expect A 25 Basis Point Rate Hike In The First Quarter Of 2027

Share

Macquarie: The Federal Reserve Is Expected To Raise Interest Rates By 25 Basis Points In September 2026

Share

Thailand's Ministry Of Commerce: Thailand's Inflation Rate Is Projected To Be 2.37% In The Third Quarter And 2.70% In The Fourth Quarter

Share

Ministry Of Commerce: Thailand's CPI Will Continue To Rise

Share

Brent Crude Oil Rose 1.00% On The Day, Currently Trading At $95.44 Per Barrel

Share

The Bank Of Korea: This Is A Significant Increase Considering The Actual Delinquency Rate Of Existing Homeowners At The End Of Last Year (2.01%)

Share

The Bank Of Korea Stated That For These Households, For Every 1 Percentage Point Increase In Interest Rates, The Probability Of Defaulting On Loans Increases By 0.81 Percentage Points

Share

The Bank Of Korea Stated That Rising Interest Rates Put Households That Have Reached Their Borrowing Limits At Risk, And That Credit Risk Is More Likely To Spread Within Households

Share

Thailand's Ministry Of Commerce: Thailand's Overall CPI Rose 2.53% Year-on-Year In August (market Expectation 2.37%), While Core CPI Rose 1.44% Year-on-Year

Share

Traders: The Reserve Bank Of India May Sell Dollars To Boost The Rupee When The Spot Market Opens

Share

The Chinese Delegation Traveled To Russia To Participate In The Live‑fire Exercise Of The ASEAN Defence Ministers' Meeting Plus Humanitarian Mine Clearance Expert Group

Share

Ferrosilicon 2611 Fell 3.81% Intraday, Last Quoted At 6314 Yuan/ton, With A Decrease Of 39,000 Lots In Open Interest, Indicating A Decline In Open Interest

Share

The Main Manganese Silicon Futures Contract Fell 4.00% Intraday, Currently Trading At 5922.00 Yuan/ton

Share

China Post Securities: The Probability Of A Federal Reserve Rate Hike In September Is High; Any Price Correction Following The Hike Presents A Clear Entry Opportunity For Precious Metals

Share

As Of The End Of August, Indonesia's Foreign Exchange Reserves Stood At US$146.5 Billion

Share

Russian Deputy Foreign Minister Dismisses EU Calls For Negotiations As "absurd And Hollow," Alleging Intent To Prolong Conflict

Share

Goldman Sachs: Oil Prices Could Rise To $120 If Attacks On Ships In The Middle East Escalate

Share

The Main Egg Futures Contract Rose More Than 2.00% Intraday, Currently Trading At 3871.00 Yuan/500 Kg, A New High Since August 24

Share

Market News: South Korea's Pension Fund Has Suspended Foreign Exchange Hedging

TIME
ACT
FCST
PREV
IMPACT
FOMC Member Hammack Speaks
U.S. Weekly Treasuries Held by Foreign Central Banks

A:--

F: --

P: --

USDX
  • USDX
  • XAUUSD
  • XAGUSD
  • WTI
Germany Construction PMI (SA) (Aug)

A:--

F: --

P: --

EURUSD
  • EURUSD
  • XAUUSD
  • XAGUSD
  • WTI
  • USDX
Italy Retail Sales MoM (SA) (Jul)

A:--

F: --

P: --
EURUSD
  • EURUSD
  • XAUUSD
  • XAGUSD
  • WTI
  • USDX
U.K. Markit/CIPS Construction PMI (Aug)

A:--

F: --

P: --

GBPUSD
  • GBPUSD
  • XAUUSD
  • XAGUSD
  • WTI
  • USDX
BOE Gov Bailey Speaks
Euro Zone Retail Sales MoM (Jul)

A:--

F: --

P: --
EURUSD
  • EURUSD
  • XAUUSD
  • XAGUSD
  • WTI
  • USDX
Euro Zone Retail Sales YoY (Jul)

A:--

F: --

P: --
EURUSD
  • EURUSD
  • XAUUSD
  • XAGUSD
  • WTI
  • USDX
ECB Chief Economist Lane Speaks
Canada Employment (SA) (Aug)

A:--

F: --

P: --

WTI
  • WTI
  • XAUUSD
  • XAGUSD
  • USDX
U.S. Government Employment (Aug)

A:--

F: --

P: --
USDX
  • USDX
  • XAUUSD
  • XAGUSD
  • WTI
U.S. Average Weekly Working Hours (SA) (Aug)

A:--

F: --

P: --

XAUUSD
  • XAUUSD
  • XAGUSD
  • WTI
  • USDX
U.S. Private Nonfarm Payrolls (SA) (Aug)

A:--

F: --

P: --
XAUUSD
  • XAUUSD
  • XAGUSD
  • WTI
  • USDX
Canada Part-Time Employment (SA) (Aug)

A:--

F: --

P: --

WTI
  • WTI
  • XAUUSD
  • XAGUSD
  • USDX
Canada Unemployment Rate (SA) (Aug)

A:--

F: --

P: --

WTI
  • WTI
  • XAUUSD
  • XAGUSD
  • USDX
Canada Labor Force Participation Rate (SA) (Aug)

A:--

F: --

P: --

WTI
  • WTI
  • XAUUSD
  • XAGUSD
  • USDX
Canada Full-time Employment (SA) (Aug)

A:--

F: --

P: --

WTI
  • WTI
  • XAUUSD
  • XAGUSD
  • USDX
U.S. Unemployment Rate (SA) (Aug)

A:--

F: --

P: --

XAUUSD
  • XAUUSD
  • XAGUSD
  • WTI
  • USDX
U.S. Nonfarm Payrolls (SA) (Aug)

A:--

F: --

P: --
XAUUSD
  • XAUUSD
  • XAGUSD
  • WTI
  • USDX
U.S. Average Hourly Wage YoY (Aug)

A:--

F: --

P: --

XAUUSD
  • XAUUSD
  • XAGUSD
  • WTI
  • USDX
U.S. Average Hourly Wage MoM (SA) (Aug)

A:--

F: --

P: --
XAUUSD
  • XAUUSD
  • XAGUSD
  • WTI
  • USDX
U.S. U6 Unemployment Rate (SA) (Aug)

A:--

F: --

P: --

XAUUSD
  • XAUUSD
  • XAGUSD
  • WTI
  • USDX
U.S. Manufacturing Employment (SA) (Aug)

A:--

F: --

P: --
USDX
  • USDX
  • XAUUSD
  • XAGUSD
  • WTI
U.S. Labor Force Participation Rate (SA) (Aug)

A:--

F: --

P: --

XAUUSD
  • XAUUSD
  • XAGUSD
  • WTI
  • USDX
Canada Ivey PMI (Not SA) (Aug)

A:--

F: --

P: --

USDCAD
  • USDCAD
  • XAUUSD
  • XAGUSD
  • WTI
  • USDX
Canada Ivey PMI (SA) (Aug)

A:--

F: --

P: --

USDCAD
  • USDCAD
  • XAUUSD
  • XAGUSD
  • WTI
  • USDX
U.S. Weekly Total Rig Count

A:--

F: --

P: --

WTI
  • WTI
  • XAUUSD
  • XAGUSD
  • USDX
U.S. Weekly Total Oil Rig Count

A:--

F: --

P: --

WTI
  • WTI
  • XAUUSD
  • XAGUSD
  • USDX
China, Mainland Foreign Exchange Reserves (Aug)

--

F: --

P: --

Japan Foreign Exchange Reserves (Aug)

A:--

F: --

P: --

USDJPY
  • USDJPY
  • XAUUSD
  • XAGUSD
  • WTI
Japan Leading Indicators Prelim (Jul)

--

F: --

P: --

U.K. Halifax House Price Index YoY (SA) (Aug)

--

F: --

P: --

U.K. Halifax House Price Index MoM (SA) (Aug)

--

F: --

P: --

Germany Industrial Output MoM (SA) (Jul)

--

F: --

P: --

Euro Zone Sentix Investor Confidence Index (Sept)

--

F: --

P: --

Euro Zone GDP Final YoY (Q2)

--

F: --

P: --

Euro Zone GDP Final QoQ (Q2)

--

F: --

P: --

Euro Zone Employment Prelim QoQ (SA) (Q2)

--

F: --

P: --

China, Mainland Imports YoY (CNH) (Aug)

--

F: --

P: --

China, Mainland Exports YoY (USD) (Aug)

--

F: --

P: --

China, Mainland Imports YoY (USD) (Aug)

--

F: --

P: --
China, Mainland Trade Balance (CNH) (Aug)

--

F: --

P: --

China, Mainland Imports (CNH) (Aug)

--

F: --

P: --

China, Mainland Trade Balance (USD) (Aug)

--

F: --

P: --

China, Mainland Exports (Aug)

--

F: --

P: --

U.K. BRC Overall Retail Sales YoY (Aug)

--

F: --

P: --

U.K. BRC Like-For-Like Retail Sales YoY (Aug)

--

F: --

P: --

Japan Wages MoM (Jul)

--

F: --

P: --

Japan Trade Balance (Jul)

--

F: --

P: --

Japan Nominal GDP Revised QoQ (Q2)

--

F: --

P: --

Germany Exports MoM (SA) (Jul)

--

F: --

P: --

France Trade Balance (SA) (Jul)

--

F: --

P: --

South Africa GDP YoY (Q2)

--

F: --

P: --

U.S. NFIB Small Business Optimism Index (SA) (Aug)

--

F: --

P: --

Canada National Economic Confidence Index

--

F: --

P: --

U.S. Conference Board Employment Trends Index (SA) (Aug)

--

F: --

P: --

China, Mainland Trade Balance (USD) (Aug)

--

F: --

P: --

U.S. 3-Year Note Auction Yield

--

F: --

P: --

U.S. Consumer Credit (SA) (Jul)

--

F: --

P: --

South Korea Unemployment Rate (SA) (Aug)

--

F: --

P: --

Q&A with Experts
    • All
    • Chatrooms
    • Groups
    • Friends
    V.Ngọc inv flag
    I also agree that gold is rising today.
    Flight Of The Falcon ! flag
    Gold buy target 4480 ✅↗️
    Flight Of The Falcon ! flag
    Btc buy target 84000 🎯↗️
    ZRVYW6YDO3 flag
    gold pls ?
    sonam flag
    sonam
    Gold Buy 4405-4400 sl 4470 target 4415.4430.4445.4460.4465.open
    @ZRVYW6YDO3check
    RPGFX flag
    sonam
    Gold Buy 4405-4400 sl 4470 target 4415.4430.4445.4460.4465.open
    @sonam The stop loss you set for this is unrealistic, how will you set buy at 4400 and stop loss is at 4470?
    Nawhdir flag
    Nawhdir flag
    Nawhdir
    likely a cancer
    john flag
    ZRVYW6YDO3
    gold pls ?
    @ZRVYW6YDO3Gold seems under pressure this morning,,,so to the downside seems like the path of least resistance
    john flag
    Flight Of The Falcon !
    Btc buy target 84000 🎯↗️
    @Flight Of The Falcon !What was your entry level on btc?
    john flag
    Nawhdir
    @NawhdirIts called an intervention move,,,,which is sometimes ugly than anticipated
    Nawhdir flag
    john
    @NawhdirIts called an intervention move,,,,which is sometimes ugly than anticipated
    @johntapi bagus bagi yang terperkirakan
    Nawhdir flag
    @SlowBear ⛅summoning. 🙏🏻
    Nawhdir flag
    @johnwhat kind of latest news you've got right now ?
    Official Support flag
    📊 Key Economic Events This Week • Germany Industrial Production and Eurozone Sentix Investor Confidence are due • China CPI will provide fresh clues on inflation trends • The ECB Monetary Policy Statement and President Lagarde’s speeches are in focus • U.S. Core PPI and Existing Home Sales will be released • U.S. CPI takes center stage on Friday 👉 Markets will focus on inflation, central bank policy and economic growth this week, with U.S. CPI, Core PPI and ECB policy signals likely to influence the dollar, gold and major assets.
    Official Support flag
    Nawhdir flag
    Official Support
    📊 Key Economic Events This Week • Germany Industrial Production and Eurozone Sentix Investor Confidence are due • China CPI will provide fresh clues on inflation trends • The ECB Monetary Policy Statement and President Lagarde’s speeches are in focus • U.S. Core PPI and Existing Home Sales will be released • U.S. CPI takes center stage on Friday 👉 Markets will focus on inflation, central bank policy and economic growth this week, with U.S. CPI, Core PPI and ECB policy signals likely to influence the dollar, gold and major assets.
    @Official SupportCPI this week friday ?
    Nawhdir flag
    Official Support
    @Official Supportok thank you.
    2169832 flag
    Good morning everyone
    sonam flag
    RPGFX
    @sonam The stop loss you set for this is unrealistic, how will you set buy at 4400 and stop loss is at 4470?
    @RPGFXmistake 4370
    Type here...
    Add Symbol or Code

      No matching data

      All
      Recommend
      Stocks
      Cryptocurrencies
      Central Banks
      Trump Updates
      Featured News
      • All
      • Russia-Ukraine Conflict
      • Middle East Flashpoint
      • All
      • Russia-Ukraine Conflict
      • Middle East Flashpoint
      Search
      Products

      Charts Free Forever

      Chats Q&A with Experts
      Screeners Economic Calendar Data Tools
      Membership Features
      Data Warehouse Market Trends Institutional Data Policy Rates Macro

      Market Trends

      Market Sentiment Order Book Forex Correlations

      Top Indicators

      Charts Free Forever
      Markets

      News

      24/7 Analysis Education

      Latest Views

      Latest Update

      Signals

      Copy Rankings Latest Signals Become a signal provider AI Rating
      Contests
      Brokers

      Overview Brokers Assessment Rankings Regulators News Claims
      Broker listing Forex Brokers Comparison Tool Live Spread Comparison Scam
      Q&A Complaint Scam Alert Videos Tips to Detect Scam
      More

      Business
      Events
      Careers About Us Advertising Help Center

      White Label

      Broker API

      Data API

      Web Plug-ins

      Affiliate Program

      Awards Institution Evaluation IB Seminar Salon Event Exhibition
      Vietnam Thailand Singapore Dubai
      Fans Party Investment Sharing Session
      FastBull Summit BrokersView Expo
      Recent Searches
        Top Searches
          Markets
          Analysis
          User
          24/7
          Economic Calendar
          Education
          Data
          • Names
          • Latest
          • Prev

          View All

          No data

          Scan to Download

          Faster Charts, Chat Faster!

          Download
          English
          • English
          • Español
          • العربية
          • Bahasa Indonesia
          • Bahasa Melayu
          • Tiếng Việt
          • ภาษาไทย
          • Français
          • Italiano
          • Türkçe
          • Русский язык
          • 简中
          • 繁中
          Open Account
          Search
          Products
          Charts Free Forever
          Markets
          News
          Signals

          Copy Rankings Latest Signals Become a signal provider AI Rating
          Contests
          Brokers

          Overview Brokers Assessment Rankings Regulators News Claims
          Broker listing Forex Brokers Comparison Tool Live Spread Comparison Scam
          Q&A Complaint Scam Alert Videos Tips to Detect Scam
          More

          Business
          Events
          Careers About Us Advertising Help Center

          White Label

          Broker API

          Data API

          Web Plug-ins

          Affiliate Program

          Awards Institution Evaluation IB Seminar Salon Event Exhibition
          Vietnam Thailand Singapore Dubai
          Fans Party Investment Sharing Session
          FastBull Summit BrokersView Expo

          How to Read RSI: Formula, Trend Ranges and Divergence

          zhan chen

          Commodity

          Stocks

          Forex

          Summary:

          A practical guide to Wilder’s RSI formula, initialization, trend-dependent thresholds, divergence confirmation and data differences across forex, stocks, gold and futures.

          An RSI reading of 72 does not mean an asset is expensive, just as a reading of 28 does not mean it is cheap. It means that upward or downward changes have dominated the indicator’s smoothed lookback. Whether that imbalance precedes continuation, consolidation or reversal depends on trend, location, the price series used and what happens after the reading. Treating 70 and 30 as automatic orders removes precisely the context that makes the Relative Strength Index useful.
          How to Read RSI: Formula, Trend Ranges and Divergence_1

          This is Part 5 of the Financial Chart Basics series. The previous guide on volume and open interest showed how to separate activity from direction. RSI asks a different question: how have recent gains compared with recent losses? This guide works from the calculation to a repeatable decision process for forex, stocks, gold and futures.

          What RSI measures—and what “relative strength” does not mean here

          RSI is a bounded momentum oscillator introduced by J. Welles Wilder. Its value runs from 0 to 100 because it converts the ratio between smoothed positive and negative price changes into a fixed scale. A rising value says recent gains are becoming more important relative to recent losses; a falling value says the opposite. It does not measure valuation, order flow, positioning or the performance of one security against a benchmark.

          That last distinction prevents a common category error. “Relative strength” can also mean that one asset is outperforming another, such as a stock divided by an equity index. Wilder’s RSI is not that ratio. It normally uses one input series—typically completed closing prices—and compares that series with its own prior values.

          The period is a number of bars, not necessarily a number of days. RSI(14) on a five-minute chart processes fourteen five-minute changes after its seed; RSI(14) on a daily chart processes daily changes. The two indicators describe different horizons and cannot be substituted for one another.

          The Wilder calculation, from the first value onward

          Let Ct be the chosen input for the current bar and Ct-1 the previous one. Split the change into a non-negative gain and a non-negative loss:

          Change = Ct − Ct-1

          Gain = max(Change, 0)

          Loss = max(−Change, 0)

          For a period of n, calculate the relative-strength ratio and transform it:

          RS = Average Gain / Average Loss

          RSI = 100 − 100 / (1 + RS)

          The standard fourteen-period version needs fourteen changes, so the first value requires fifteen prices. Its initial average gain is the arithmetic mean of the first fourteen gains; the initial average loss is the arithmetic mean of the first fourteen losses. After that seed, Wilder smoothing is recursive:

          New Average Gain = (Previous Average Gain × 13 + Current Gain) / 14

          New Average Loss = (Previous Average Loss × 13 + Current Loss) / 14

          This is equivalent to exponential smoothing with an alpha of 1/14. It is not a fresh fourteen-bar simple average on every candle. Older observations fade rather than disappearing abruptly, which is why the amount and quality of history loaded before the visible chart can matter.

          If average loss is zero while average gain is positive, RSI tends to 100; if average gain is zero while average loss is positive, it is 0. A completely flat sample produces an undefined ratio of zero divided by zero. Charting packages do not all handle that edge case in the same way, so a flat-series output should be checked rather than assumed.

          A reproducible example: why 71.43 can become 61.90

          Suppose fourteen completed price changes contain 10 points of total gains and 4 points of total absolute losses. The initial average gain is 10/14 = 0.7142857; the initial average loss is 4/14 = 0.2857143. RS is 2.5 and RSI is therefore:

          100 − 100 / (1 + 2.5) = 71.4286

          Now suppose the next completed bar falls by 2 points. The new gain is zero and the new loss is 2:

          New Average Gain = (0.7142857 × 13 + 0) / 14 = 0.6632653

          New Average Loss = (0.2857143 × 13 + 2) / 14 = 0.4081633

          New RS is 1.625, giving RSI = 61.9048. The oscillator has left the conventional overbought zone after one negative bar, but the earlier gains have not vanished. The example explains the mechanics; it says nothing about where the next price bar must go.

          Why two screens can show different RSI(14) values

          A disagreement is not automatically a calculation error. Before comparing readings, make the full specification identical:

          SettingHow it changes the resultWhat to record
          Instrument and venueTwo symbols that look similar can use different trades or quotesExact symbol, contract and source
          Bar clockTime zone, session breaks and Sunday bars change the closesTimeframe, time zone and session template
          InputClose, typical price and another indicator produce different changesThe source field, normally close
          Smoothing and seedWilder smoothing, an SMA or a conventional EMA are not interchangeableFormula, initialisation rule and warm-up length
          History treatmentMissing bars, corporate-action adjustment and futures stitching alter the pathAdjustment and missing-data rules
          Live barAn unfinished close moves with every updateWhether the reading is intrabar or completed

          Seed differences are most visible near the left edge of a dataset or after a gap in history. Because the recursive weight decays, longer clean warm-up history usually brings implementations using the same formula closer together. Rounding only at the displayed value is harmless; rounding average gains and losses at every step can compound into a meaningful difference.

          A four-hour RSI is also not the arithmetic average of four one-hour RSI readings. The four-hour chart first constructs its own closes and then applies a nonlinear ratio to those changes. Aggregation and indicator calculation do not commute.

          Fourteen, 70 and 30 are defaults, not market laws

          Wilder’s fourteen-period setting is a sensible common baseline because it balances responsiveness and smoothing. A shorter length reacts earlier but crosses zones more often; a longer length moves more slowly and may hide changes that matter to a short holding period. Choosing 7, 14 or 21 after seeing which one fitted a historical turning point best is parameter mining, not validation.

          The traditional interpretation marks readings above 70 as overbought and below 30 as oversold. Those words describe an unusually one-sided recent path, not an objectively excessive price. In a durable advance, repeated readings above 70 may be evidence of leadership. In a persistent decline, sub-30 readings may describe continuing downside momentum. Selling the first case or buying the second without independent price evidence is an attempt to pick a turning point against the active regime.

          Read the zone differently in a trend and in a range

          Thresholds become more informative after the price environment is classified. Analysts often observe an RSI regime around 40–80 or higher during an established uptrend, with pullbacks finding momentum support around 40–50. In a downtrend, the working range can shift toward roughly 20–60, with rebounds stalling around 50–60. These are descriptive hypotheses, not fixed borders; the instrument, timeframe and volatility regime must be tested.

          ContextWhat an extreme may meanEvidence that upgrades the readingWhat invalidates the idea
          Rising price structureRSI above 70 can reflect strong continuation momentumPrice holds the breakout, pullbacks remain above structure, breadth or activity supports the movePrice loses the relevant swing and momentum fails to recover
          Falling price structureRSI below 30 can reflect persistent selling pressureLower highs and lows remain intact after weak reboundsPrice reclaims a defined resistance zone and holds it
          Established range, upper boundaryAn overbought reading can flag a mean-reversion watchRejection closes back inside the range and breaks a minor swing lowMultiple closes accept price above the range
          Established range, lower boundaryAn oversold reading can flag a rebound watchPrice re-enters the range and breaks a minor swing highPrice accepts below support with renewed momentum

          The sequence matters: environment first, location second, trigger last. RSI at 28 in the middle of an accelerating downtrend is not the same observation as RSI at 28 after a failed break below a well-tested range.

          Divergence is a warning; price structure supplies the clock

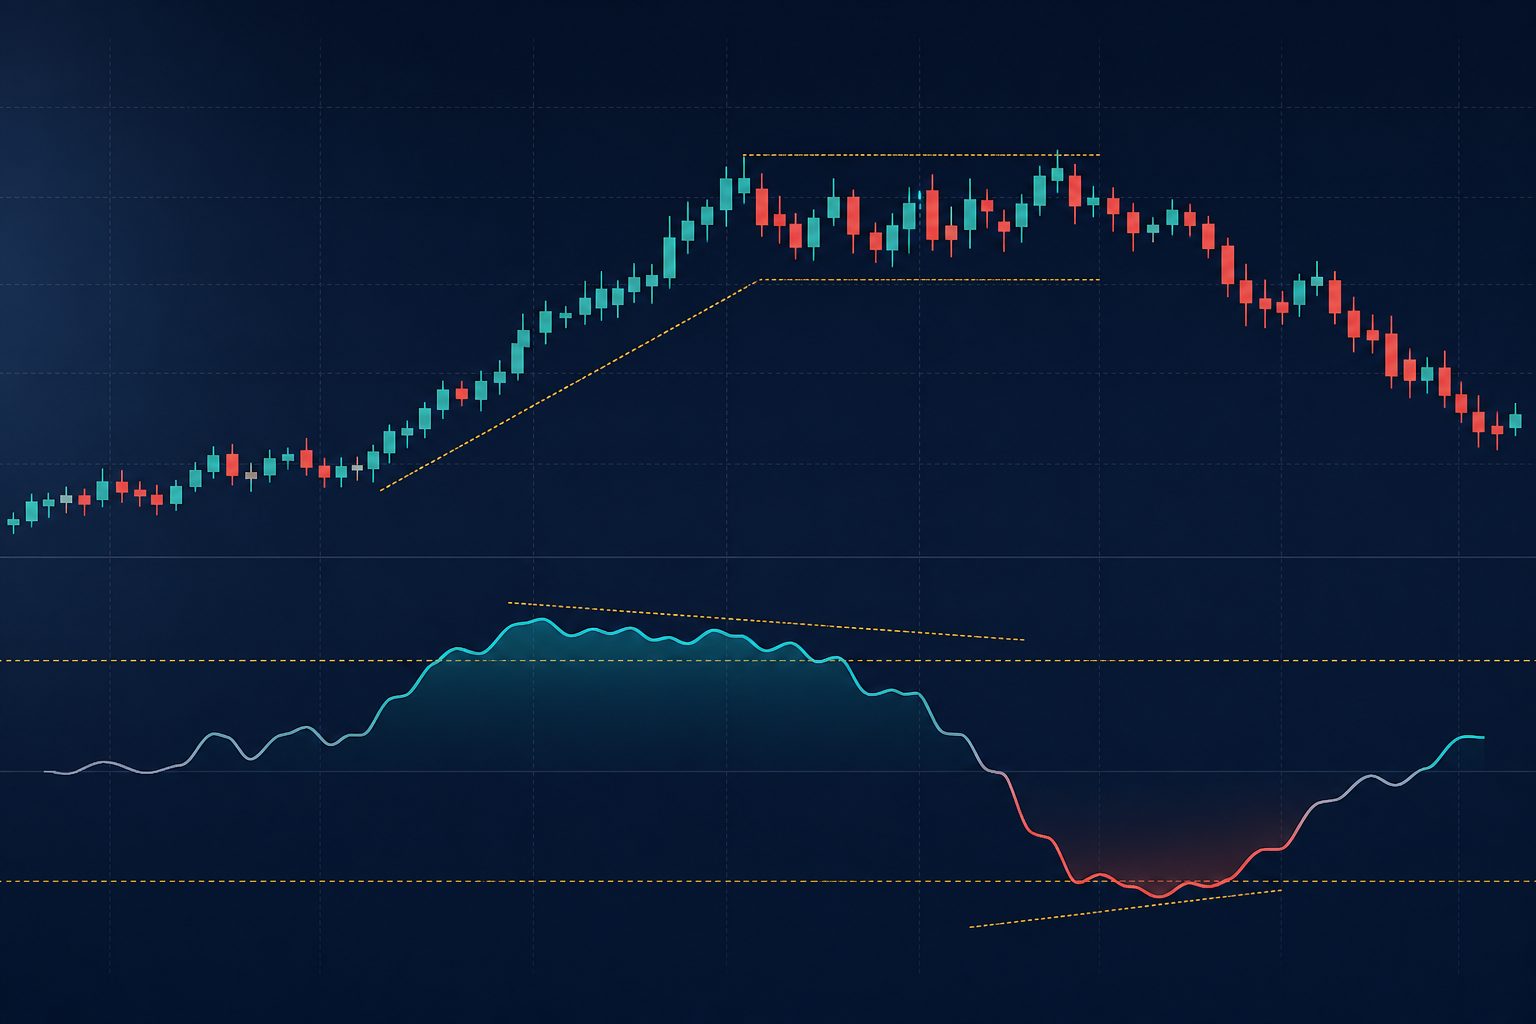
          A classical bearish divergence occurs when price makes a higher confirmed swing high while RSI makes a lower swing high. A bullish divergence reverses the relationship: price makes a lower low while RSI forms a higher low. The indicator is saying that the latest extension was achieved with a different momentum profile. It is not saying that reversal must begin on the next bar.

          Three disciplines make divergence testable. First, define the pivot rule before looking at the outcome—for example, a swing that remains an extreme for a specified number of completed bars on each side. Second, compare pivots of the same scale; a daily price high should not be paired with an arbitrary fifteen-minute RSI wiggle. Third, give the setup an expiry and a price condition.

          A bearish divergence may be upgraded after price fails to hold the new high and closes below the reaction low between the two peaks. It is degraded when price spends several completed bars above the breakout, RSI re-expands and the market continues to print higher lows. A bullish setup uses the opposite tests. This approach prevents a divergence from being redrawn indefinitely while the trend keeps moving.

          Failure swings require their final pivot break

          A failure swing is an RSI pattern rather than a direct comparison between price and indicator slopes. In a bearish version, RSI forms a high in or near its upper zone, retreats, rebounds to a lower RSI high and then breaks the intervening RSI low. In a bullish version, it forms a low in or near the lower zone, rebounds, retests at a higher RSI low and then breaks the intervening RSI high.

          The final pivot break completes the pattern. Calling the first retreat from 70 a failure swing creates hindsight bias because the necessary structure does not yet exist. Even after completion, price should confirm: a failed breakout, a close through a relevant swing or loss of a support/resistance zone has more weight than an oscillator pattern occurring in isolation.

          Divergence and a failure swing can coexist, but they are not synonyms. Divergence compares two price pivots with two indicator pivots; a failure swing can be identified within RSI alone. Record them as separate conditions so a backtest does not count the same observation twice under different names.

          The same reading has different data risks across four markets

          Stocks: gaps and corporate actions enter the calculation

          A daily earnings gap is a genuine close-to-close change and may dominate a short RSI. A share split, special distribution or badly adjusted history can produce a similar visual extreme for purely mechanical reasons. State whether the series is adjusted, whether extended-hours data are included and whether the signal existed on the actual tradable session. An RSI of 25 created by a data break is not an oversold market.

          Spot FX: there is no single global close

          Spot foreign exchange is decentralised. Different quote feeds, a small Sunday bar and different New York or UTC day boundaries can change the sequence of daily closes. A four-hour EUR/USD divergence should therefore be checked on the same provider and session used for execution, rather than confirmed by a screenshot built from another clock.

          Gold: align the instrument before comparing momentum

          XAU/USD spot and exchange-traded gold futures have different venues, trading pauses and contract mechanics. Their broad trend may agree while their intraday RSI differs. Cross-market agreement can be useful context, but one reading cannot be silently substituted for the other. Match timestamps and specify whether the thesis concerns spot exposure or a particular futures contract.

          Futures: the continuous chart may manufacture the move

          A continuous series joins delivery months. A raw roll gap can create an RSI jump that was not tradable in either contract; a back-adjusted series can remove the gap but rewrite earlier price levels. Check the active contract, rollover method and liquidity migration. A signal should exist in an executable contract before it is treated as market evidence.

          Completed bars and multiple timeframes: one hierarchy, not a vote

          The current RSI value changes while the source candle is open. A four-hour reading can touch 72 after an early rally and close at 64. If a rule was tested on completed bars, acting on the transient value silently changes the system. Intrabar use is legitimate only if the entry, data frequency and slippage assumptions were built and tested that way.

          Multiple timeframes should have assigned jobs. A weekly or daily chart defines trend and major location; a four-hour or hourly chart measures the setup; a lower chart can refine execution. Counting “two bullish and one bearish” readings as a majority vote mixes different horizons. Daily RSI above 40 during an uptrend and hourly RSI below 30 on a pullback can both be correct.

          A coherent example would require the daily uptrend and support zone to remain intact, then ask the hourly chart to reclaim its local boundary after an oversold reading. The higher-timeframe close defines thesis invalidation; the lower timeframe controls entry precision. If the intended holding period is hours, waiting for a monthly RSI turn adds impressive-looking but irrelevant information.

          Backtest the rule, not the chart annotation

          An honest RSI test fixes the symbol, venue, data source, session, input, length, smoothing, warm-up and bar-completion rule before measuring results. Divergence pivots must be detectable using information available at the time. If a swing high needs three future bars to be confirmed, the test cannot enter on the original high.

          Report more than win rate. Sample count, median result, maximum favourable and adverse excursion, holding time, failure frequency and out-of-sample performance show how the rule behaves. Include spread, commission, slippage, gaps and futures roll costs. Separate macro-release windows from ordinary sessions; an indicator that appears stable only because event bars were omitted without a rule will not survive live use.

          Sensitivity is another defence against overfitting. A thesis that works at RSI 29.7 but fails at 29 or 31, or works with length 14 but collapses at 13 and 15, may have learned historical noise. Results should also be segmented by trend and range, because averaging the two regimes can conceal opposite behaviours.

          A seven-step RSI workflow in FastBull

          1. Fix the market definition. Record the exact instrument, venue or feed, timeframe, session and whether stock or futures history is adjusted.
          2. Fix the indicator definition. Use the intended input, period, Wilder smoothing and sufficient warm-up. Do not compare it with an unspecified implementation.
          3. Classify the environment. Mark trend, range and key price zones before viewing the oscillator as a trigger.
          4. Name the observation. Distinguish an extreme, a 50-line shift, a divergence and a completed failure swing; do not merge them into one “RSI signal”.
          5. Write confirmation and invalidation. Specify the completed price close, swing break or failed breakout that upgrades the idea, plus the price action and time limit that cancel it.
          6. Check the clock and event risk. Wait for the required bar to finish and note scheduled releases, earnings, settlement and rollover that can alter execution.
          7. Review the evidence. In FastBull charts, save the exact settings and replay both successful and failed cases without revealing future bars.

          The most useful question is not “Is RSI overbought?” but “What chain of completed price evidence would make this momentum reading matter here?” RSI provides a compact description of recent directional pressure. Trend, location, data quality, confirmation and risk limits determine whether that description deserves a place in a decision.

          Risk Warnings and Disclaimers
          You understand and acknowledge that there is a high degree of risk involved in trading. Following any strategies or investment methods may lead to potential losses. The content on the site is provided by our contributors and analysts for information purposes only. You are solely responsible for determining whether any trading assets, securities, strategy, or any other product is suitable for investing based on your own investment objectives and financial situation.
          Add to Favorites
          Share
          FastBull
          Copyright © 2026 FastBull Ltd

          728 RM B 7/F GEE LOK IND BLDG NO 34 HUNG TO RD KWUN TONG KLN HONG KONG

          TelegramInstagramTwitterfacebooklinkedin
          App Store Google Play Android Windows
          Products
          Charts

          Chats

          Q&A with Experts
          Screeners
          Economic Calendar
          Data
          Tools
          Membership
          Features
          Function
          Markets
          Copy Trading
          Latest Signals
          Contests
          24/7
          Analysis
          Education
          Company
          Careers
          About Us
          Contact Us
          Advertising
          Download FastBull
          Help Center
          Feedback
          User Agreement
          Privacy Policy
          Personal Information Protection Statement
          Business

          White Label

          Broker API

          Data API

          Web Plug-ins

          Poster Maker

          Affiliate Program

          Risk Disclosure

          The risk of loss in trading financial instruments such as stocks, FX, commodities, futures, bonds, ETFs and crypto can be substantial. You may sustain a total loss of the funds that you deposit with your broker. Therefore, you should carefully consider whether such trading is suitable for you in light of your circumstances and financial resources.

          No decision to invest should be made without thoroughly conducting due diligence by yourself or consulting with your financial advisors. Our web content might not suit you since we don't know your financial conditions and investment needs. Our financial information might have latency or contain inaccuracy, so you should be fully responsible for any of your trading and investment decisions. The company will not be responsible for your capital loss.

          Without getting permission from the website, you are not allowed to copy the website's graphics, texts, or trademarks. Intellectual property rights in the content or data incorporated into this website belong to its providers and exchange merchants.

          Not Logged In

          Log in to access more features

          Connect Broker
          Become a signal provider
          Help Center
          Customer Service
          Dark Mode
          Price Up/Down Colors

          Log In

          Sign Up

          Position
          Layout
          Fullscreen
          Default to Chart
          The chart page opens by default when you visit fastbull.com