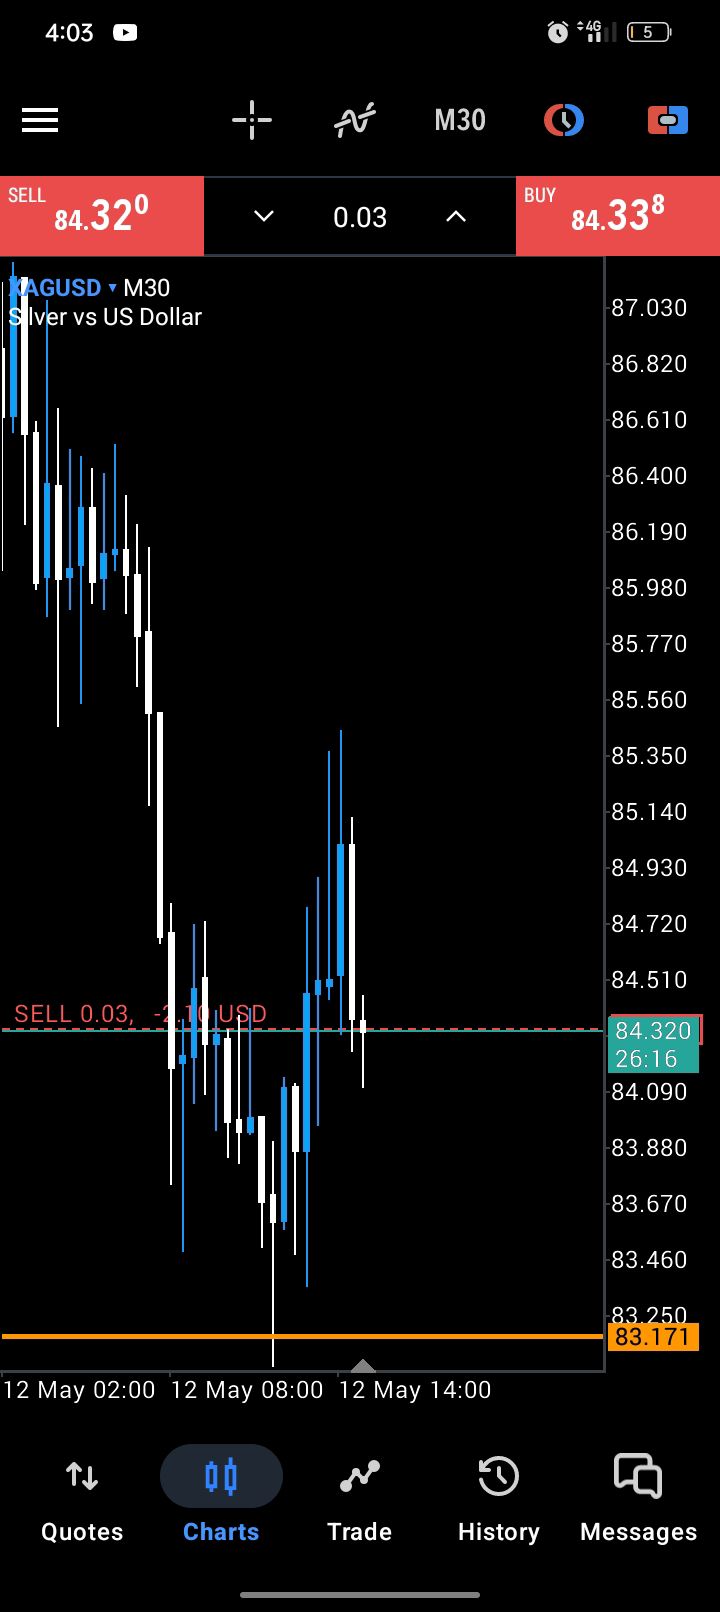
• Trade
  • Markets
  • Copy
  • Contests
  • 24/7
  • Calendar
  • Q&A
  • Chats
Screeners
SYMBOL
LAST
BID
ASK
HIGH
LOW
NET CHG.
%CHG.
SPREAD
SOURCE
SPX
S&P 500 Index
7356.59
7356.59
7356.59
7394.37
7352.79
-56.26
-0.76%
--
--
DJI
Dow Jones Industrial Average
49435.76
49435.76
49435.76
49739.62
49307.66
-268.70
-0.54%
--
--
IXIC
NASDAQ Composite Index
25935.27
25935.27
25935.27
26190.48
25913.78
-338.85
-1.29%
--
--
USDX
US Dollar Index
98.230
98.230
98.310
98.280
97.810
+0.470
+ 0.48%
--
--
EURUSD
Euro / US Dollar
1.17306
1.17306
1.17313
1.17875
1.17267
-0.00510
-0.43%
--
--
GBPUSD
Pound Sterling / US Dollar
1.35162
1.35162
1.35174
1.36133
1.35020
-0.00930
-0.68%
--
--
XAUUSD
Gold / US Dollar
4667.07
4667.07
4667.41
4773.27
4664.51
-68.57
-1.45%
--
--
WTI
Light Sweet Crude Oil
98.543
98.543
98.573
99.033
94.343
+3.105
+ 3.25%
--
--

Community Accounts

Signal Accounts
--
Profit Accounts
--
Loss Accounts
--
View More

Become a signal provider

Sell trading signals to earn additional income

View More

Guide to Copy Trading

Get started with ease and confidence

View More

Signal Accounts for Members

All Signal Accounts

Best Return
  • Best Return
  • Best P/L
  • Best MDD
Past 1W
  • Past 1W
  • Past 1M
  • Past 1Y

All Contests

  • All
  • Recommend
  • Stocks
  • Cryptocurrencies
  • Central Banks
  • Trump Updates
  • Featured News
Top News Only
Share

EU High Representative For Foreign Affairs And Security Policy Karas: We Are Considering Strengthening The EU Mandate To Lebanon

Share

The Federal Reserve Bank Of New York: Auto Loan Debt Will Reach $1.7 Trillion In The First Quarter Of 2025, An Increase Of $18 Billion From The Fourth Quarter Of 2024

Share

The New York Fed Reported That The Rate Of Student Loan Defaults Slowed In The First Quarter. The Peak Of Student Loan Defaults May Have Already Arrived

Share

As Of The 23:00 Market Close, Most Domestic Futures Contracts Rose, With Low-sulfur Fuel Oil (LU) Rising Over 3%, Liquefied Petroleum Gas (LPG) Rising Nearly 3%, Fuel Oil Rising Over 1%, And Synthetic Rubber And Asphalt Rising Nearly 1%. On The Downside, Coking Coal Fell Over 3%, And Coke Fell Over 2%

Share

New York Fed: 4.8% Of Debt Was In Some Form Of Overdue Status In The First Quarter

Share

The China Earthquake Networks Center Officially Reported That A 4.2-magnitude Earthquake Occurred At 22:55 On May 12 In Changning County, Yibin City, Sichuan Province (28.38 Degrees North Latitude, 104.86 Degrees East Longitude), With A Focal Depth Of 12 Kilometers

Share

New York Fed: Total U.S. Household Debt Rose 0.1% In The First Quarter To $18.8 Trillion

Share

According To The Wall Street Journal, The CEO Of Abu Dhabi National Oil Company Said The Company Is Prepared To Resume Exports Once The Strait Of Hormuz Is Open

Share

The China Earthquake Networks Center Automatically Determined That An Earthquake Of Approximately Magnitude 4.4 Occurred Near Changning County, Yibin City, Sichuan Province (28.39 Degrees North Latitude, 104.86 Degrees East Longitude) At 22:55 On May 12. The Final Result Is Subject To The Official Rapid Report

Share

Pakistani Prime Minister: I Spoke With Azerbaijani President Aliyev Tonight And Reaffirmed Our Shared Commitment To Further Strengthen Cooperation In Trade, Investment, Energy And People-to-people Exchanges

Share

Market News: An Oil Tanker Carrying Iraqi Crude Oil Stopped Sailing After Approaching A U.S. Military Deployment Area

Share

Belarusian President Lukashenko: We Will Continue To Mobilize Our Forces In A Targeted Manner To Prepare For War

Share

Hungarian Prime Minister Majol Reiterated That All Public Officials Appointed By Former Prime Minister Orbán Must Resign By The End Of May

Share

Ukrainian Foreign Minister: The United States Has Not Delayed Weapons Supplies Under The "Ukraine Priorities List" (PURL) Program

Share

Hungary's New Prime Minister Majol: We Need To Restore And Strengthen Our Alliance

Share

Hungary's New Prime Minister Majol: Finance Minister Needs To Rebuild Fiscal Credibility And Support Economic Growth

Share

Hungarian Prime Minister Majol Said The Ministers Of Health, Justice, Education, And Finance Face The Most Complex Tasks, As They Will Have Veto Power In The New Government. The Government Will Increase Healthcare Spending By 500 Billion Forints Annually

Share

The China Earthquake Networks Center Automatically Determined That An Earthquake Of Approximately Magnitude 3.5 Occurred Near Changning County, Yibin City, Sichuan Province (28.38°N, 104.86°E) At 22:13 On May 12. The Final Result Is Subject To The Official Rapid Report

Share

U.S. Natural Gas Futures Fell 3.00% On The Day, Currently Trading At $2.822 Per Million British Thermal Units

Share

The U.S. Department Of Justice Has Filed Criminal Charges Against A Singapore-based Shipping Company, Accusing It Of Safety Negligence In Connection With The Baltimore Bridge Collapse

TIME
ACT
FCST
PREV
IMPACT
U.S. Conference Board Employment Trends Index (SA) (Apr)

A:--

F: --

P: --
USDX
  • USDX
  • XAUUSD
  • XAGUSD
  • WTI
U.S. 3-Year Note Auction Yield

A:--

F: --

P: --

XAUUSD
  • XAUUSD
  • XAGUSD
  • WTI
  • USDX
Saudi Arabia Crude Oil Production

A:--

F: --

P: --

WTI
  • WTI
  • XAUUSD
  • XAGUSD
  • USDX
U.K. BRC Overall Retail Sales YoY (Apr)

A:--

F: --

P: --

GBPUSD
  • GBPUSD
  • XAUUSD
  • XAGUSD
  • WTI
U.K. BRC Like-For-Like Retail Sales YoY (Apr)

A:--

F: --

P: --

GBPUSD
  • GBPUSD
  • XAUUSD
  • XAGUSD
  • WTI
Japan Foreign Exchange Reserves (Apr)

A:--

F: --

P: --

USDJPY
  • USDJPY
  • XAUUSD
  • XAGUSD
  • WTI
Japan 10-Year Note Auction Yield

A:--

F: --

P: --

USDJPY
  • USDJPY
  • XAUUSD
  • XAGUSD
  • WTI
  • USDX
Indonesia Retail Sales YoY (Mar)

A:--

F: --

P: --

XAUUSD
  • XAUUSD
  • XAGUSD
  • WTI
  • USDX
Japan Leading Indicators Prelim (Mar)

A:--

F: --

P: --

USDJPY
  • USDJPY
  • XAUUSD
  • XAGUSD
  • WTI
  • USDX
Italy Industrial Output YoY (SA) (Mar)

A:--

F: --

P: --
EURUSD
  • EURUSD
  • XAUUSD
  • XAGUSD
  • WTI
  • USDX
Germany ZEW Economic Sentiment Index (May)

A:--

F: --

P: --

EURUSD
  • EURUSD
  • XAUUSD
  • XAGUSD
  • WTI
  • USDX
Germany ZEW Current Conditions Index (May)

A:--

F: --

P: --

EURUSD
  • EURUSD
  • XAUUSD
  • XAGUSD
  • WTI
  • USDX
Euro Zone ZEW Economic Sentiment Index (May)

A:--

F: --

P: --

EURUSD
  • EURUSD
  • XAUUSD
  • XAGUSD
  • WTI
  • USDX
South Africa Unemployment Rate (Q1)

A:--

F: --

P: --

XAUUSD
  • XAUUSD
  • XAGUSD
  • WTI
  • USDX
Euro Zone ZEW Current Conditions Index (May)

A:--

F: --

P: --

EURUSD
  • EURUSD
  • XAUUSD
  • XAGUSD
  • WTI
  • USDX
Italy 12-Month BOT Auction Avg. Yield

A:--

F: --

P: --

EURUSD
  • EURUSD
  • XAUUSD
  • XAGUSD
  • WTI
  • USDX
Germany 2-Year Schatz Auction Avg. Yield

A:--

F: --

P: --

EURUSD
  • EURUSD
  • XAUUSD
  • XAGUSD
  • WTI
  • USDX
U.S. NFIB Small Business Optimism Index (SA) (Apr)

A:--

F: --

P: --

USDX
  • USDX
  • XAUUSD
  • XAGUSD
  • WTI
India CPI YoY (Apr)

A:--

F: --

P: --

XAUUSD
  • XAUUSD
  • XAGUSD
  • WTI
  • USDX
Brazil CPI YoY (Apr)

A:--

F: --

P: --

XAUUSD
  • XAUUSD
  • XAGUSD
  • WTI
  • USDX
Mexico Industrial Output YoY (Mar)

A:--

F: --

P: --

XAUUSD
  • XAUUSD
  • XAGUSD
  • WTI
  • USDX
U.S. CPI MoM (Not SA) (Apr)

A:--

F: --

P: --

XAUUSD
  • XAUUSD
  • XAGUSD
  • WTI
  • USDX
U.S. Core CPI (SA) (Apr)

A:--

F: --

P: --

XAUUSD
  • XAUUSD
  • XAGUSD
  • WTI
  • USDX
U.S. Real Income MoM (SA) (Apr)

A:--

F: --

P: --

USDX
  • USDX
  • XAUUSD
  • XAGUSD
  • WTI
U.S. CPI MoM (SA) (Apr)

A:--

F: --

P: --

XAUUSD
  • XAUUSD
  • XAGUSD
  • WTI
  • USDX
U.S. Core CPI MoM (SA) (Apr)

A:--

F: --

P: --

XAUUSD
  • XAUUSD
  • XAGUSD
  • WTI
  • USDX
U.S. Core CPI YoY (Not SA) (Apr)

A:--

F: --

P: --

XAUUSD
  • XAUUSD
  • XAGUSD
  • WTI
  • USDX
U.S. CPI YoY (Not SA) (Apr)

A:--

F: --

P: --

XAUUSD
  • XAUUSD
  • XAGUSD
  • WTI
  • USDX
U.S. Weekly Redbook Index YoY

A:--

F: --

P: --

XAUUSD
  • XAUUSD
  • XAGUSD
  • WTI
  • USDX
U.S. Cleveland Fed CPI MoM (Apr)

--

F: --

P: --

U.S. EIA Natural Gas Production Forecast For The Next Year (May)

--

F: --

P: --

U.S. EIA Short-Term Crude Production Forecast For The Year (May)

--

F: --

P: --

U.S. EIA Short-Term Crude Production Forecast For The Next Year (May)

--

F: --

P: --

U.S. 10-Year Note Auction Avg. Yield

--

F: --

P: --

U.S. Budget Balance (Apr)

--

F: --

P: --

U.S. API Weekly Refined Oil Stocks

--

F: --

P: --

U.S. API Weekly Gasoline Stocks

--

F: --

P: --

U.S. API Weekly Cushing Crude Oil Stocks

--

F: --

P: --

U.S. API Weekly Crude Oil Stocks

--

F: --

P: --

South Korea Unemployment Rate (SA) (Apr)

--

F: --

P: --

Japan Trade Balance (Mar)

--

F: --

P: --

Australia House Loan Permits MoM (SA) (Q1)

--

F: --

P: --

France ILO Unemployment Rate (SA) (Q1)

--

F: --

P: --

France HICP Final MoM (Apr)

--

F: --

P: --

Euro Zone Industrial Output MoM (Mar)

--

F: --

P: --

Euro Zone Industrial Output YoY (Mar)

--

F: --

P: --

Germany Current Account (Not SA) (Mar)

--

F: --

P: --

U.S. MBA Mortgage Application Activity Index WoW

--

F: --

P: --

Brazil Retail Sales MoM (Mar)

--

F: --

P: --

U.S. Core PPI MoM (SA) (Apr)

--

F: --

P: --

U.S. PPI YoY (Apr)

--

F: --

P: --

U.S. PPI MoM (SA) (Apr)

--

F: --

P: --

U.S. Core PPI YoY (Apr)

--

F: --

P: --

U.S. EIA Weekly Crude Stocks Change

--

F: --

P: --

U.S. EIA Weekly Cushing, Oklahoma Crude Oil Stocks Change

--

F: --

P: --

U.S. EIA Weekly Crude Demand Projected by Production

--

F: --

P: --

U.S. EIA Weekly Gasoline Stocks Change

--

F: --

P: --

U.S. EIA Weekly Heating Oil Stock Changes

--

F: --

P: --

U.S. EIA Weekly Crude Oil Imports Changes

--

F: --

P: --

U.S. Refinitiv/Ipsos Primary Consumer Sentiment Index (PCSI) (May)

--

F: --

P: --

Q&A with Experts
    • All
    • Chatrooms
    • Groups
    • Friends
    努努 flag
    "努努" recalled a message
    努努 flag
    请问是买方还是卖方,让我跟在后面捡一点剩余的礼物
    努努 flag
    现在,价格跌破了4670
    Wisdom Arc flag
    努努
    请问是买方还是卖方,让我跟在后面捡一点剩余的礼物
    @努努😆😆
    Jabed Moshiar Rahman flag
    努努
    白银最近势头强劲,做空需要非常好的技术与信心
    @努努 Silver will come bact to 80.900 My analysis...
    Edys flag
    sepertinya xauusd akan terjun sampai bulan depan
    3DX cheetah flag
    努努 flag
    价格总是会留下长长的影线,这展示了战场的惨烈绞杀
    3DX cheetah flag
    see u when I come to check the money
    努努 flag
    你的止损在哪里
    木木
    黄金今天怎么看?
    努努 flag
    努努
    买方很顽强,我没有提前入场,所以我选择观望了
    这是我的看法
    Gab flag
    木木
    黄金今天怎么看?
    @木木it might go to the 1hr support
    Jabed Moshiar Rahman flag
    Gold now trying to hunting SL....... Then Boom
    Gab flag
    on 4658 level probably
    木木
    Jabed Moshiar Rahman
    Gold now trying to hunting SL....... Then Boom
    @Jabed Moshiar Rahman 你的意思是黄金会上涨?
    Jabed Moshiar Rahman flag
    木木
    @Jabed Moshiar Rahman 你的意思是黄金会上涨?
    @木木 Yes
    Nawhdir Øt flag
    begini, aku mau tanya sesuatu, siapapun boleh jawab. Wilayah support emas yang kuat dimana?
    木木
    Nawhdir Øt
    begini, aku mau tanya sesuatu, siapapun boleh jawab. Wilayah support emas yang kuat dimana?
    @Nawhdir Øt 我不知道我的看法对不对。我觉得是4630~4650
    Type here...
    Add Symbol or Code

      No matching data

      All
      Recommend
      Stocks
      Cryptocurrencies
      Central Banks
      Trump Updates
      Featured News
      • All
      • Russia-Ukraine Conflict
      • Middle East Flashpoint
      • All
      • Russia-Ukraine Conflict
      • Middle East Flashpoint
      Search
      Products

      Charts Free Forever

      Chats Q&A with Experts
      Screeners Economic Calendar Data Tools
      Membership Features
      Data Warehouse Market Trends Institutional Data Policy Rates Macro

      Market Trends

      Market Sentiment Order Book Forex Correlations

      Top Indicators

      Charts Free Forever
      Markets

      News

      24/7 Analysis Education

      Latest Views

      Latest Update

      Signals

      Copy Rankings Latest Signals Become a signal provider AI Rating
      Contests
      Brokers

      Overview Brokers Assessment Rankings Regulators News Claims
      Broker listing Forex Brokers Comparison Tool Live Spread Comparison Scam
      Q&A Complaint Scam Alert Videos Tips to Detect Scam
      More

      Business
      Events
      Careers About Us Advertising Help Center

      White Label

      Broker API

      Data API

      Web Plug-ins

      Affiliate Program

      Awards Institution Evaluation IB Seminar Salon Event Exhibition
      Vietnam Thailand Singapore Dubai
      Fans Party Investment Sharing Session
      FastBull Summit BrokersView Expo
      Recent Searches
        Top Searches
          Markets
          Analysis
          User
          24/7
          Economic Calendar
          Education
          Data
          • Names
          • Latest
          • Prev

          View All

          No data

          Scan to Download

          Faster Charts, Chat Faster!

          Download App
          English
          • English
          • Español
          • العربية
          • Bahasa Indonesia
          • Bahasa Melayu
          • Tiếng Việt
          • ภาษาไทย
          • Français
          • Italiano
          • Türkçe
          • Русский язык
          • 简中
          • 繁中
          Open Account
          Search
          Products
          Charts Free Forever
          Markets
          News
          Signals

          Copy Rankings Latest Signals Become a signal provider AI Rating
          Contests
          Brokers

          Overview Brokers Assessment Rankings Regulators News Claims
          Broker listing Forex Brokers Comparison Tool Live Spread Comparison Scam
          Q&A Complaint Scam Alert Videos Tips to Detect Scam
          More

          Business
          Events
          Careers About Us Advertising Help Center

          White Label

          Broker API

          Data API

          Web Plug-ins

          Affiliate Program

          Awards Institution Evaluation IB Seminar Salon Event Exhibition
          Vietnam Thailand Singapore Dubai
          Fans Party Investment Sharing Session
          FastBull Summit BrokersView Expo

          Bar Graph Example With Data: Types, Axes & How to Draw

          zhan chen
          Summary:

          Data precision defines leadership. Master the essential bar graph example to clearly communicate market trends and revenue in your next financial presentation.

          For financial analysts and investors, presenting data clearly is just as critical as the analysis itself. A well-constructed bar graph example can instantly highlight market trends, revenue growth, or portfolio allocation. This guide explains how to select, format, and build professional charts that deliver clear, actionable insights for your next investment presentation or financial report.

          Bar Graph Example With Data: Types, Axes & How to Draw

          What Does a Bar Graph Actually Show, and When Should You Use One?

          A bar graph represents categorical data using rectangular bars, where the length or height of the bar is proportional to the value it represents. Financial professionals use them to compare discrete figures, such as total revenue across different tech companies or quarterly earnings per share (EPS). They are highly effective for displaying comparative sizes at a glance.

          Understanding the difference between bar graph and histogram with example comparisons is essential for accurate reporting. A bar graph displays distinct, separate categories with visual gaps between the bars, such as comparing individual company revenues. A histogram, conversely, displays the continuous frequency distribution of a single variable without gaps, such as the distribution of daily stock returns over a fiscal year.

          What Do the Parts of a Bar Graph Mean?

          A proper financial chart requires specific structural elements to remain objective and accurate. Each component plays a distinct role in guiding the reader's interpretation of the underlying data.

          What Do the X-Axis and Y-Axis Represent in a Bar Graph?

          In a standard vertical layout, the X-axis (horizontal) represents the independent, discrete categories being measured. In financial analysis, this might be specific fiscal quarters, geographic regions, or company ticker symbols. The Y-axis (vertical) represents the dependent numerical values, such as revenue in billions of dollars, profit margins, or total return percentages.

          How Do Labels, Scale, and Intervals Affect What the Graph Shows?

          Labels identify exactly what each axis measures, preventing ambiguity in corporate reporting. The scale and intervals dictate the visual distance between numerical values on the Y-axis. Manipulating the scale—such as failing to start the Y-axis at zero—can drastically exaggerate minor financial discrepancies, misleading investors about a company's true market performance.

          What Are the Main Types of Bar Graphs, With Real Data Examples?

          Choosing the right visualization depends entirely on the structure of your dataset. There are four primary types of bar graph formats utilized in corporate earnings reports and equity research.

          Vertical Bar Graph Example: Comparing Categories Side by Side

          Vertical bar charts, commonly known as column charts, are best for direct chronological or categorical comparisons. For a practical bar graph interpretation example, visualizing Apple's Q1 2026 record total revenue of $143.8 billion next to Microsoft's Q3 2026 revenue of $82.9 billion instantly communicates the scale difference between the two tech giants. The vertical height allows investors to quickly gauge relative market dominance.

          Horizontal Bar Graph Example: When Longer Labels Need More Space

          A horizontal bar graph flips the orientation, placing the categories on the Y-axis and the values on the X-axis. This format is ideal when category names are too long to fit neatly under a vertical column without awkward text wrapping. For instance, comparing specific corporate divisions like Microsoft's "Productivity and Business Processes" versus its "Intelligent Cloud" segment is much more readable horizontally.

          Stacked Bar Graph Example: Breaking Down a Total Into Parts

          A stacked bar graph displays a total value divided into its constituent segments, making it perfect for revenue breakdowns. As a real-world stacked bar graph example, we can examine Apple’s Q1 2026 earnings. The total column represents the $143.8 billion revenue, built from stacked segments representing individual product lines.

          Here is the underlying financial data that would construct this chart:

          Apple Q1 2026 SegmentRevenue (Billions USD)Percentage of Total
          iPhone$85.359.3%
          Services$30.020.9%
          Wearables, Home & Accessories$11.58.0%
          iPad$8.55.9%
          Mac$8.45.8%

          Grouped Bar Graph Example: Comparing Multiple Series at Once

          A grouped bar graph places bars representing different sub-groups side by side within a main category. An analyst might use this to compare gross profit versus net income for several companies within the same sector. This allows stakeholders to analyze intra-company margin efficiency and inter-company scale simultaneously.

          How Do You Create a Bar Graph Step by Step?

          Generating a clean, professional chart requires a methodical approach. Financial visual aids should always prioritize data clarity over decorative design.

          How to Set Up Your Axes and Choose a Scale

          Always begin by establishing a baseline zero on your numerical axis to maintain graphical integrity. Choose an interval scale that logically covers your maximum data point without leaving excessive empty space at the top of the chart. Ensure gridlines are either faint or removed entirely to reduce visual clutter.

          How to Input Your Data and Generate the Bars

          Organize your spreadsheet so that categories are in one column and their corresponding financial values are in the adjacent column. Highlight this array and insert the chart using your software's graphing tool. While a line graph example is preferred for tracking continuous time-series data like daily stock volatility, bar charts require discrete, aggregated data points to generate separate columns accurately.

          How to Label and Title Your Bar Graph Correctly

          Titles must be highly specific, detailing the exact metric, companies, and time period covered. Instead of a generic title like "Company Revenue," use "Apple vs. Microsoft: Early 2026 Total Revenue by Segment." Ensure axis labels explicitly state the currency and denomination, such as "USD (Billions)," to avoid multi-million dollar misinterpretations.

          What Are the Most Common Bar Graph Mistakes and How Do You Avoid Them?

          The most egregious mistake in financial data visualization is the truncated Y-axis, which artificially inflates minor performance differences. Always start the value axis at an absolute zero. To maintain professionalism, financial editors should avoid these common design pitfalls:

          • Using 3D effects: Three-dimensional bars distort where the top of the data point actually aligns with the grid.
          • Poor color contrast: Using similar shades makes grouped or stacked segments difficult to distinguish.
          • Illogical ordering: Unless the data is explicitly chronological, sort bars by value rather than randomly.

          FAQs about bar graph example

          What are common examples of bar graphs used in financial analysis?

          Common examples include quarterly revenue comparisons, portfolio asset allocations, and year-over-year profit margin breakdowns. Analysts rely on these charts to visualize discrete financial metrics quickly and clearly.

          Which types of bar charts are best for visualizing quarterly financial performance?

          Grouped bar charts are excellent for comparing multiple metrics, such as revenue and net income, across consecutive fiscal quarters. Standard vertical column charts also work perfectly for displaying total quarterly earnings chronologically.

          How to create a professional bar graph for financial reporting in Excel?

          Highlight your dataset, navigate to the Insert tab, and select the appropriate 2D column or bar chart icon. Remove distracting gridlines, add a specific title, and verify the Y-axis starts at zero for a professional finish.

          Why are bar graphs preferred for displaying comparative market trends?

          Bar graphs provide a clear, objective visual contrast between discrete categories, making it easy to identify outperforming assets. Their linear, block-based structure allows viewers to instantly process size differences without complex mental math.

          Conclusion

          Mastering data visualization ensures your financial analysis is both accurate and persuasive. Whether you use a horizontal layout for complex metrics or a standard vertical bar graph example for quarterly earnings, clarity should always remain your priority. Avoiding common design pitfalls empowers investors to confidently make informed, data-driven decisions.

          Risk Warnings and Disclaimers
          You understand and acknowledge that there is a high degree of risk involved in trading. Following any strategies or investment methods may lead to potential losses. The content on the site is provided by our contributors and analysts for information purposes only. You are solely responsible for determining whether any trading assets, securities, strategy, or any other product is suitable for investing based on your own investment objectives and financial situation.
          Add to Favorites
          Share
          FastBull
          Copyright © 2026 FastBull Ltd

          728 RM B 7/F GEE LOK IND BLDG NO 34 HUNG TO RD KWUN TONG KLN HONG KONG

          TelegramInstagramTwitterfacebooklinkedin
          App Store Google Play Google Play
          Products
          Charts

          Chats

          Q&A with Experts
          Screeners
          Economic Calendar
          Data
          Tools
          Membership
          Features
          Function
          Markets
          Copy Trading
          Latest Signals
          Contests
          24/7
          Analysis
          Education
          Company
          Careers
          About Us
          Contact Us
          Advertising
          Help Center
          Feedback
          User Agreement
          Privacy Policy
          Personal Information Protection Statement
          Business

          White Label

          Broker API

          Data API

          Web Plug-ins

          Poster Maker

          Affiliate Program

          Risk Disclosure

          The risk of loss in trading financial instruments such as stocks, FX, commodities, futures, bonds, ETFs and crypto can be substantial. You may sustain a total loss of the funds that you deposit with your broker. Therefore, you should carefully consider whether such trading is suitable for you in light of your circumstances and financial resources.

          No decision to invest should be made without thoroughly conducting due diligence by yourself or consulting with your financial advisors. Our web content might not suit you since we don't know your financial conditions and investment needs. Our financial information might have latency or contain inaccuracy, so you should be fully responsible for any of your trading and investment decisions. The company will not be responsible for your capital loss.

          Without getting permission from the website, you are not allowed to copy the website's graphics, texts, or trademarks. Intellectual property rights in the content or data incorporated into this website belong to its providers and exchange merchants.

          Not Logged In

          Log in to access more features

          Connect Broker
          Become a signal provider
          Help Center
          Customer Service
          Dark Mode
          Price Up/Down Colors

          Log In

          Sign Up

          Position
          Layout
          Fullscreen
          Default to Chart
          The chart page opens by default when you visit fastbull.com