• Trade
  • Markets
  • Copy
  • Contests
  • News
  • 24/7
  • Calendar
  • Q&A
  • Chats
Trending
Screeners
SYMBOL
LAST
BID
ASK
HIGH
LOW
NET CHG.
%CHG.
SPREAD
SPX
S&P 500 Index
6870.39
6870.39
6870.39
6895.79
6858.28
+13.27
+ 0.19%
--
DJI
Dow Jones Industrial Average
47954.98
47954.98
47954.98
48133.54
47871.51
+104.05
+ 0.22%
--
IXIC
NASDAQ Composite Index
23578.12
23578.12
23578.12
23680.03
23506.00
+72.99
+ 0.31%
--
USDX
US Dollar Index
98.950
99.030
98.950
99.060
98.740
-0.030
-0.03%
--
EURUSD
Euro / US Dollar
1.16426
1.16443
1.16426
1.16715
1.16277
-0.00019
-0.02%
--
GBPUSD
Pound Sterling / US Dollar
1.33312
1.33342
1.33312
1.33622
1.33159
+0.00041
+ 0.03%
--
XAUUSD
Gold / US Dollar
4197.91
4197.91
4197.91
4259.16
4191.87
-9.26
-0.22%
--
WTI
Light Sweet Crude Oil
59.809
60.061
59.809
60.236
59.187
+0.426
+ 0.72%
--

Community Accounts

Signal Accounts
--
Profit Accounts
--
Loss Accounts
--
View More

Become a signal provider

Sell trading signals to earn additional income

View More

Guide to Copy Trading

Get started with ease and confidence

View More

Signal Accounts for Members

All Signal Accounts

Best Return
  • Best Return
  • Best P/L
  • Best MDD
Past 1W
  • Past 1W
  • Past 1M
  • Past 1Y

All Contests

  • All
  • Trump Updates
  • Recommend
  • Stocks
  • Cryptocurrencies
  • Central Banks
  • Featured News
Top News Only
Share

India Clean Energy Ministry: No Advisory Issued To Pause Or Halt New Clean Enegry Financing

Share

[Win Surges Over 90% In 24 Hours, Market Cap Reaches $57.5 Million] December 7Th, According To Htx Market Data, Win Surged Over 90% In The Past 24 Hours, Currently Trading At $0.0000575, With A Market Cap Of $57.5 Million

Share

Kuwait August CPI +0.07% Month-On-Month

Share

Kuwait August CPI +2.39% Year-On-Year

Share

Chinese Navy: Japan's Related Claims Are Completely Inconsistent With The Facts

Share

Chinese Navy: Japanese Self-Defense Force Aircraft Repeatedly Approached And Disrupted The Chinese Navy's Training Areas

Share

[Lilly's Mufonta® (Telborpeptide) Included In National Medical Insurance For The First Time] On December 7th, The 2025 National Basic Medical Insurance, Maternity Insurance And Work Injury Insurance Drug Catalog Was Released, And Lilly's Gip/Glp-1 Ra Mufonta® (Telborpeptide Injection) Was Successfully Included. The Medical Insurance Coverage For Telborpeptide Applies To Glycemic Control In Adult Patients With Type 2 Diabetes: Adult Patients With Type 2 Diabetes Whose Glycemic Control Remains Inadequate Despite Treatment With Metformin And/or Sulfonylureas, In Addition To Diet And Exercise. The New Catalog Will Officially Take Effect On January 1, 2026

Share

Russia's Defence Ministry: Russia's Air Defence Units Destroy 77 Ukrainian Drones Overnight

Share

Australia Defence Minister Marles: We Want Most Productive Relationship We Can Achieve With China

Share

Japan Defence Minister Koizumi: Discussed With Marles Our Common Serious Concerns About Situation In South China Sea, East China Sea

Share

Australia Defence Minister Marles: Australia Will Work To Uphold Free And Open Indo-Pacific

Share

Kremlin Welcomes The Removal Of Russia From The List Of USA Direct Threats In New National Security Strategy, Tass Reports

Share

China Forex Reserves $3.346 Trillion At End-Nov Versus$3.343 Trillion At End-Oct

Share

Mayor: Russian Strike Hits Ukrainian City Of Kremenchuk, Cutting Utilities

Share

White House: To Establish Food Supply Chain Security Task Forces To Protect Competition

Share

Senior US Diplomat Calls EU Policies Bad For Trans-Atlantic Partnership

Share

US Defense Secretary Hegseth: He Would Have Ordered Second Strike On Caribbean Vessel

Share

USGS Estimates Greece Earthquake At Magnitude 4.8

Share

GFZ: Earthquake Of Magnitude 6.36 Strikes Greece

Share

USGS - Magnitude 7 Earthquake Strikes Yakutat, Alaska Region

TIME
ACT
FCST
PREV
Euro Zone Employment YoY (SA) (Q3)

A:--

F: --

P: --

Euro Zone GDP Final YoY (Q3)

A:--

F: --

P: --

Euro Zone GDP Final QoQ (Q3)

A:--

F: --

P: --

Euro Zone Employment Final QoQ (SA) (Q3)

A:--

F: --

P: --

Euro Zone Employment Final (SA) (Q3)

A:--

F: --

P: --
Brazil PPI MoM (Oct)

A:--

F: --

P: --

Mexico Consumer Confidence Index (Nov)

A:--

F: --

P: --

Canada Unemployment Rate (SA) (Nov)

A:--

F: --

P: --

Canada Labor Force Participation Rate (SA) (Nov)

A:--

F: --

P: --

Canada Employment (SA) (Nov)

A:--

F: --

P: --

Canada Part-Time Employment (SA) (Nov)

A:--

F: --

P: --

Canada Full-time Employment (SA) (Nov)

A:--

F: --

P: --

U.S. Personal Income MoM (Sept)

A:--

F: --

P: --

U.S. PCE Price Index YoY (SA) (Sept)

A:--

F: --

P: --

U.S. PCE Price Index MoM (Sept)

A:--

F: --

P: --

U.S. Personal Outlays MoM (SA) (Sept)

A:--

F: --

P: --

U.S. Core PCE Price Index MoM (Sept)

A:--

F: --

P: --

U.S. Core PCE Price Index YoY (Sept)

A:--

F: --

P: --

U.S. UMich 5-Year-Ahead Inflation Expectations Prelim YoY (Dec)

A:--

F: --

P: --

U.S. Real Personal Consumption Expenditures MoM (Sept)

A:--

F: --

P: --

U.S. 5-10 Year-Ahead Inflation Expectations (Dec)

A:--

F: --

P: --

U.S. UMich Current Economic Conditions Index Prelim (Dec)

A:--

F: --

P: --

U.S. UMich Consumer Sentiment Index Prelim (Dec)

A:--

F: --

P: --

U.S. UMich 1-Year-Ahead Inflation Expectations Prelim (Dec)

A:--

F: --

P: --

U.S. UMich Consumer Expectations Index Prelim (Dec)

A:--

F: --

P: --

U.S. Weekly Total Rig Count

A:--

F: --

P: --

U.S. Weekly Total Oil Rig Count

A:--

F: --

P: --

U.S. Unit Labor Cost Prelim (SA) (Q3)

--

F: --

P: --

U.S. Consumer Credit (SA) (Oct)

A:--

F: --

P: --

China, Mainland Foreign Exchange Reserves (Nov)

A:--

F: --

P: --

China, Mainland Exports YoY (USD) (Nov)

--

F: --

P: --

China, Mainland Imports YoY (CNH) (Nov)

--

F: --

P: --

China, Mainland Imports YoY (USD) (Nov)

--

F: --

P: --

China, Mainland Imports (CNH) (Nov)

--

F: --

P: --

China, Mainland Trade Balance (CNH) (Nov)

--

F: --

P: --

China, Mainland Exports (Nov)

--

F: --

P: --

Japan Wages MoM (Oct)

--

F: --

P: --

Japan Trade Balance (Oct)

--

F: --

P: --

Japan Nominal GDP Revised QoQ (Q3)

--

F: --

P: --

Japan Trade Balance (Customs Data) (SA) (Oct)

--

F: --

P: --

Japan GDP Annualized QoQ Revised (Q3)

--

F: --

P: --
China, Mainland Exports YoY (CNH) (Nov)

--

F: --

P: --

China, Mainland Trade Balance (USD) (Nov)

--

F: --

P: --

Germany Industrial Output MoM (SA) (Oct)

--

F: --

P: --

Euro Zone Sentix Investor Confidence Index (Dec)

--

F: --

P: --

Canada Leading Index MoM (Nov)

--

F: --

P: --

Canada National Economic Confidence Index

--

F: --

P: --

U.S. Dallas Fed PCE Price Index YoY (Sept)

--

F: --

P: --

U.S. 3-Year Note Auction Yield

--

F: --

P: --

U.K. BRC Overall Retail Sales YoY (Nov)

--

F: --

P: --

U.K. BRC Like-For-Like Retail Sales YoY (Nov)

--

F: --

P: --

Australia Overnight (Borrowing) Key Rate

--

F: --

P: --

RBA Rate Statement
RBA Press Conference
Germany Exports MoM (SA) (Oct)

--

F: --

P: --

U.S. NFIB Small Business Optimism Index (SA) (Nov)

--

F: --

P: --

Mexico Core CPI YoY (Nov)

--

F: --

P: --

Mexico 12-Month Inflation (CPI) (Nov)

--

F: --

P: --

Mexico PPI YoY (Nov)

--

F: --

P: --

Mexico CPI YoY (Nov)

--

F: --

P: --

Q&A with Experts
    • All
    • Chatrooms
    • Groups
    • Friends
    Connecting
    .
    .
    .
    Type here...
    Add Symbol or Code

      No matching data

      All
      Trump Updates
      Recommend
      Stocks
      Cryptocurrencies
      Central Banks
      Featured News
      • All
      • Russia-Ukraine Conflict
      • Middle East Flashpoint
      • All
      • Russia-Ukraine Conflict
      • Middle East Flashpoint
      Search
      Products

      Charts Free Forever

      Chats Q&A with Experts
      Screeners Economic Calendar Data Tools
      Membership Features
      Data Warehouse Market Trends Institutional Data Policy Rates Macro

      Market Trends

      Market Sentiment Order Book Forex Correlations

      Top Indicators

      Charts Free Forever
      Markets

      News

      News Analysis 24/7 Columns Education
      From Institutions From Analysts
      Topics Columnists

      Latest Views

      Latest Views

      Trending Topics

      Top Columnists

      Latest Update

      Signals

      Copy Rankings Latest Signals Become a signal provider AI Rating
      Contests
      Brokers

      Overview Brokers Assessment Rankings Regulators News Claims
      Broker listing Forex Brokers Comparison Tool Live Spread Comparison Scam
      Q&A Complaint Scam Alert Videos Tips to Detect Scam
      More

      Business
      Events
      Careers About Us Advertising Help Center

      White Label

      Data API

      Web Plug-ins

      Affiliate Program

      Awards Institution Evaluation IB Seminar Salon Event Exhibition
      Vietnam Thailand Singapore Dubai
      Fans Party Investment Sharing Session
      FastBull Summit BrokersView Expo
      Recent Searches
        Top Searches
          Markets
          News
          Analysis
          User
          24/7
          Economic Calendar
          Education
          Data
          • Names
          • Latest
          • Prev

          View All

          No data

          Scan to Download

          Faster Charts, Chat Faster!

          Download App
          English
          • English
          • Español
          • العربية
          • Bahasa Indonesia
          • Bahasa Melayu
          • Tiếng Việt
          • ภาษาไทย
          • Français
          • Italiano
          • Türkçe
          • Русский язык
          • 简中
          • 繁中
          Open Account
          Search
          Products
          Charts Free Forever
          Markets
          News
          Signals

          Copy Rankings Latest Signals Become a signal provider AI Rating
          Contests
          Brokers

          Overview Brokers Assessment Rankings Regulators News Claims
          Broker listing Forex Brokers Comparison Tool Live Spread Comparison Scam
          Q&A Complaint Scam Alert Videos Tips to Detect Scam
          More

          Business
          Events
          Careers About Us Advertising Help Center

          White Label

          Data API

          Web Plug-ins

          Affiliate Program

          Awards Institution Evaluation IB Seminar Salon Event Exhibition
          Vietnam Thailand Singapore Dubai
          Fans Party Investment Sharing Session
          FastBull Summit BrokersView Expo

          US Dollar Index (DXY) And The NFP Jobs Report: What To Expect

          Owen Li

          Economic

          Forex

          Summary:

          Consensus forecasts predict an increase of 169,000 jobs, with the unemployment rate expected to remain at 4.1%. Strong numbers (over 190,000 jobs) could strengthen the dollar, while weak numbers (less than 135,000 jobs) could weaken it.  (DXY) currently has support levels around 107.00, 106.13, and 105.76, and resistance levels at 108.00, 108.49, and 109.52.

          Consensus forecasts predict an increase of 169,000 jobs, with the unemployment rate expected to remain at 4.1%.

          Strong numbers (over 190,000 jobs) could strengthen the dollar, while weak numbers (less than 135,000 jobs) could weaken it.

          (DXY) currently has support levels around 107.00, 106.13, and 105.76, and resistance levels at 108.00, 108.49, and 109.52.

          The US Bureau of Labor Statistics is set to release the non-farm payroll and jobs data for January 2025 on Friday, February 7th, 2025.

          NFP Report Expectations

          The consensus forecast for January’s non-farm payroll is an increase of 169,000 jobs, following a robust gain of 256,000 jobs in December 2024. Recent jobs data has been strong, with the US economy adding an average of 186,000 jobs per month in 2024. This suggests that the labor market remains healthy heading into 2025.

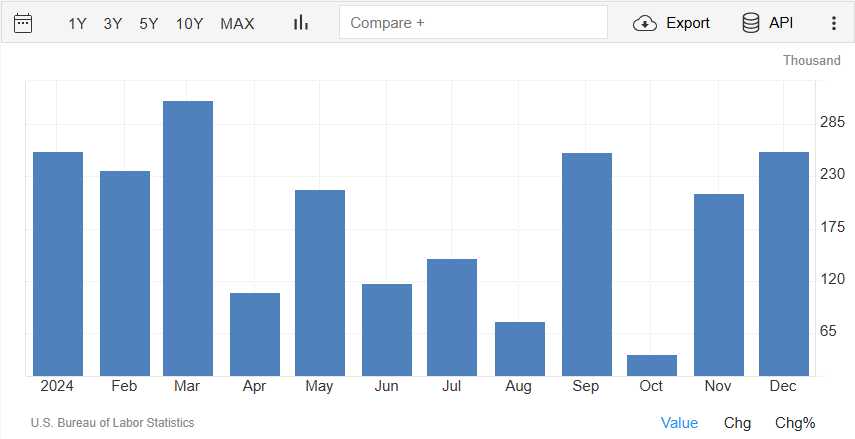
          Source: TradingEconomics

          The unemployment rate is expected to stay at 4.1%, and wages are predicted to grow by 0.3% this month (3.8% over the past year). However, job growth could be higher than expected, with estimates ranging from 175,000 to 225,000 new jobs.

          As always the average hourly earnings measure will play a key role. Any significant deviation away from the 3.8-4% range here could see an uptick in inflation expectations. This would then have a knock on effect on Fed policy regarding rate cuts which could see the US Dollar experience some volatility.

          There are challenges ahead with concerns that tariff uncertainty and growth worries may lead to a cautious approach toward hiring in the first part of 2025. It will be interesting to see if these concerns come to fruition and we see any cooling of the labor market and a drop in hiring.

          The Current State of the US Labor Market

          The US labor market is slowing down gradually. A December report showed over 500,000 fewer job openings, bringing the total to 7.6 million. Professional services and healthcare saw the biggest drops, while leisure and hospitality stayed strong.

          Hiring has been slower, and layoffs are balancing out new hires in some industries. However, wages have stayed steady, with average pay growth at 3.9-4.0% over the past five months, showing that demand for workers is still solid.

          There have been some mixed signs in recent data releases however, with metrics like the manufacturing and services PMI employment components, pointing to sustained hiring momentum. The ISM Manufacturing Employment Index recently climbed to 50.3, signaling expansion, while the ADP private payrolls report showed 183,000 jobs added in January.

          Given the above and with the geopolitical and trade developments one may understand why tomorrow’s report is so crucial.

          Potential Impact and Scenarios

          The NFP report plays a big role in shaping the US Dollar Index (DXY) and overall market mood. If the report shows strong numbers, especially over 190,000 new jobs, the US dollar could strengthen, especially since it’s close to support levels around 107.50. But if the report is weak, with less than 135,000 jobs added or wage growth under 0.2%, markets may expect the Fed to cut rates more aggressively, which could weaken the dollar.

          For stocks, strong job numbers might raise concerns about stubborn inflation moving forward, which could slow down market gains. On the other hand, weak job data could signal easier monetary policies ahead and more rate cuts thus stoking market optimism. .

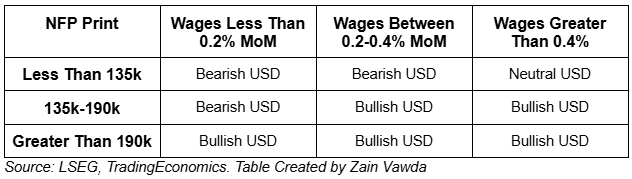
          Potential Impact on the US Dollar Based on the Data Released

          Technical Analysis – US Dollar Index (DXY)

          Looking at the US Dollar Index and bulls have failed to kick on this week as price action has now printed a lower high but no lower low has materialized yet. Will the jobs data help the DXY continue its recent malaise or will it give bulls renewed impetus to push on?

          Immediate support rests at 107.00 before the 106.13 and 105.76 handles come into focus.

          A move higher from here will need to break above the 108.00 handle before resistance at 108.49 and 109.52 come into focus.

          US Dollar Index (DXY) Daily Chart, February 6, 2025

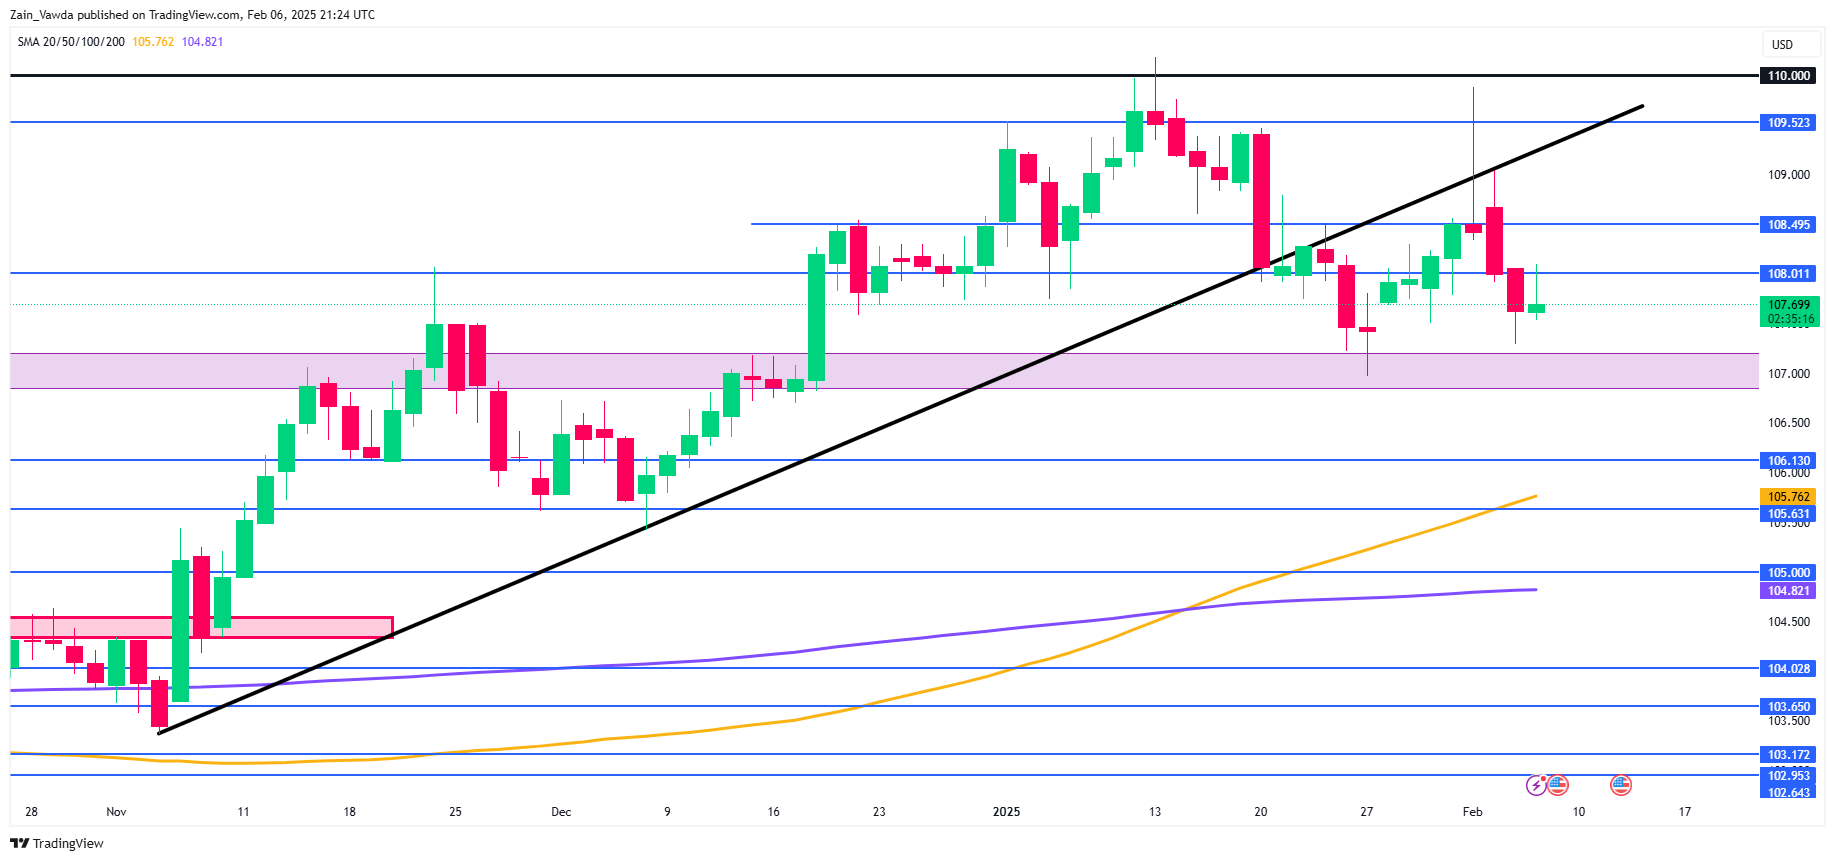
          Source: TradingView (click to enlarge)

          Support

          107.00

          106.13

          105.76 (100-day MA)

          Resistance

          108.00

          108.49

          109.52

          Source: ACTIONFOREX

          To stay updated on all economic events of today, please check out our Economic calendar
          Risk Warnings and Disclaimers
          You understand and acknowledge that there is a high degree of risk involved in trading. Following any strategies or investment methods may lead to potential losses. The content on the site is provided by our contributors and analysts for information purposes only. You are solely responsible for determining whether any trading assets, securities, strategy, or any other product is suitable for investing based on your own investment objectives and financial situation.
          Add to Favorites
          Share

          USD/JPY Extends Decline as Markets Brace for US NFP Data

          Alex

          Economic

          Forex

          Key Highlights

          USD/JPY started a fresh decline below the 155.50 support zone.

          A connecting bearish trend line is forming with resistance at 154.80 on the 4-hour chart.

          EUR/USD recovered above 1.0400 before the bears appeared again.

          The US nonfarm payrolls could change by 170K in Jan 2025, down from 256K.

          USD/JPY Technical Analysis

          The US Dollar started a fresh decline below 156.20 against the Japanese Yen. USD/JPY declined below 155.50 and 155.00 to enter a short-term bearish zone.

          Looking at the 4-hour chart, the pair settled below the 154.20 level, the 100 simple moving average (red, 4-hour), and the 200 simple moving average (green, 4-hour). The bears seem to be in control and might aim for more losses.

          On the downside, immediate support sits near the 151.80 level. The next key support sits near the 151.20 level. Any more losses could send the pair toward the 150.50 level.

          On the upside, the pair seems to be facing hurdles near the 152.80 level. The next major resistance is near the 153.80 level. The main resistance is now forming near the 154.00 zone.

          There is also a connecting bearish trend line forming with resistance at 154.80 and the 100 simple moving average (red, 4-hour). A close above the 154.80 level could set the tone for another increase. In the stated case, the pair could even clear the 155.50 resistance.

          Looking at EUR/USD, the pair was able to recover above the 1.0400 resistance, but the bears are still active below 1.0450.

          Upcoming Economic Events:

          US nonfarm payrolls for Jan 2025 – Forecast 170K, versus 256K previous.

          US Unemployment Rate for Jan 2025 – Forecast 4.1%, versus 4.1% previous.

          Source: ACTIONFOREX

          To stay updated on all economic events of today, please check out our Economic calendar
          Risk Warnings and Disclaimers
          You understand and acknowledge that there is a high degree of risk involved in trading. Following any strategies or investment methods may lead to potential losses. The content on the site is provided by our contributors and analysts for information purposes only. You are solely responsible for determining whether any trading assets, securities, strategy, or any other product is suitable for investing based on your own investment objectives and financial situation.
          Add to Favorites
          Share

          Cliff Notes: Some Promising Signs for the Consumer

          Alex

          Economic

          Key insights from the week that was.

          In Australia, updates on the consumer were constructive overall. Nominal retail sales lifted 1.4% during Q4 and prices were up 0.4%. Retail sales volumes therefore managed a gain of 1.0% in Q4, building on Q3’s 0.5% increase to be up 1.1% over 2024. That all states and retail categories gathered momentum into year-end not only highlights the breadth of the current upturn but also points to a delayed tax cut response beginning to come through. These findings were corroborated by the ABS’ new experimental measure of household spending (covering two-thirds of total household consumption compared to one-third for retail) which lifted 0.4% (4.3%yr) in December on strength in discretionary spending, particularly goods.

          While these developments point to upside risks to our current Q4 household consumption forecast of 0.7%qtr, we are mindful that the uncertainty surrounding our forecast are two-sided. Evidence from card activity data and our Westpac Consumer Panel suggests the overall response to Stage 3 tax cuts has been underwhelming, with consumers seeking to rebuild savings buffers eroded over 2023 and 2024. Looking forward, the durability of the upturn is yet to be tested beyond the year-end sales period, which reportedly saw aggressive discounting. The latest edition of the Westpac Red Book discusses these themes in depth.

          On housing, the latest CoreLogic data pointed to a broadening slowdown in price growth across the major capitals. Sydney and Melbourne continued to record declines in January with buyers constrained by affordability and supply. Perth, Adelaide and Brisbane meanwhile are gradually seeing annual price growth decelerate to low double-digit rates as demand and supply come into better balance. On new construction, the modest increase in dwelling approvals – driven by a bounce in high-rise units – masked a third consecutive monthly decline in private detached house approvals, raising questions over the pipeline’s persistence and breadth.

          Before moving offshore, it is worth highlighting the downside surprise in December’s goods trade data, the surplus narrowing from $6.8bn to $5.1bn. Greater-than-usual monthly volatility looks to be at play, trade flows shifting, at least in part, in anticipation of tariffs being imposed by the US. Australia is not immune from global trade tensions, but an assessment of our direct and indirect trade with the US makes clear we are well positioned to minimise the net cost. In this week’s essay, Chief Economist Luci Ellis reflects on global developments in trade policy and the implications for markets.

          Offshore, the pulse of key data was favourable overall, though policy makers continued to emphasise greater-than-usual uncertainty over the outlook.

          In the US, the manufacturing PMI increased by 1.7 points to 50.9 points in January, its first expansionary read since October 2022. The gain was supported by strength in new orders, prices, production and, most notably, employment, up 4.9 points. President Trump’s promise to support US manufacturing investment and production is likely a factor here despite any windfall being a future prospect not a present reality. Notably, the average reading through President Trump’s first term exceeded that of both the Obama and Biden administrations by around 2 points.

          The non-manufacturing index meanwhile declined 1.2 points, although at 52.8 still points to expansion. Activity, new orders, inventories and prices saw a substantial decline while other measures saw tepid increases, including a 1 point increase in employment. All components except prices remain below their 5-year pre-COVID average, indicative of modest growth in the sector. Still to come tonight is the January employment report and 2024 annual revision for nonfarm payrolls. Available labour market detail continues to broadly point to balance between demand and supply, limiting risks to demand and inflation over the period ahead.

          Across the Atlantic, the Bank of England cut rates by 25bps to 4.5% in a 7 to 2 vote, the dissenters preferring a 50bp cut. Growth forecasts were marked down out to Q1 2026, the economy now expected to grow 1.2%yr through 2025, down from 1.7%yr in the November projections. Mild upward revisions were made to the out years, though with the passage of time comes risk. Projections for headline inflation were lifted, particularly for 2025. This was attributed to higher energy prices and the government policies announced in the Autumn Budget 2024, with underlying inflation still anticipated to ease.

          The Monetary Policy Report also highlighted tariff uncertainty, with analysis showing downside risks to growth, due to the UK’s close relationship with the EU and a potential rotation in production from the UK to the US, and uncertainty for inflation. Looking back, the Bank also reviewed its estimates of neutral, the primary findings being that neutral is higher post pandemic but that uncertainty around estimates is high. A rate cut per quarter this year seems most probable, but if growth continues to disappoint, the pace of easing could be accelerated.

          Source: ACTIONFOREX

          To stay updated on all economic events of today, please check out our Economic calendar
          Risk Warnings and Disclaimers
          You understand and acknowledge that there is a high degree of risk involved in trading. Following any strategies or investment methods may lead to potential losses. The content on the site is provided by our contributors and analysts for information purposes only. You are solely responsible for determining whether any trading assets, securities, strategy, or any other product is suitable for investing based on your own investment objectives and financial situation.
          Add to Favorites
          Share

          How to Calculate Free Cash Flow: A Comprehensive Guide for Investors and Analysts

          Glendon

          Economic

          Free cash flow (FCF) is one of the most important financial metrics for investors, analysts, and business owners. It measures the cash a company generates after accounting for capital expenditures, such as buildings, equipment, and other long-term investments. FCF provides insight into a company's financial health, its ability to pay dividends, reduce debt, or reinvest in growth opportunities. In this article, we’ll break down how to calculate free cash flow, its significance, and practical examples to help you master this essential financial tool.

          What is Free Cash Flow?

          Free cash flow represents the cash a company has left over after covering its operating expenses and capital expenditures. It’s a measure of financial flexibility and efficiency, showing how well a company can generate cash from its core operations. Positive free cash flow indicates that a company has surplus cash to invest in growth, pay dividends, or reduce debt. Conversely, negative free cash flow may signal financial strain or heavy investment in future growth.

          Why is Free Cash Flow Important?

          Evaluating Financial Health: FCF helps investors assess whether a company can sustain its operations without relying on external financing.
          Valuation: Analysts use FCF to estimate a company’s intrinsic value through discounted cash flow (DCF) analysis.
          Dividend Payments: Companies with strong FCF are more likely to pay consistent dividends.
          Debt Management: FCF can be used to pay down debt, reducing financial risk.
          Growth Opportunities: Excess FCF can fund acquisitions, research and development, or other strategic initiatives.

          How to Calculate Free Cash Flow

          There are two primary formulas to calculate free cash flow:

          Formula 1: Using Operating Cash Flow

          The most common method to calculate FCF is by using operating cash flow (OCF) and subtracting capital expenditures (CapEx).
          Free Cash Flow (FCF) = Operating Cash Flow (OCF) - Capital Expenditures (CapEx)
          Operating Cash Flow (OCF): This is the cash generated from a company’s core business operations. It can be found on the cash flow statement.
          Capital Expenditures (CapEx): These are investments in long-term assets like property, plant, and equipment (PP&E). CapEx is also listed on the cash flow statement.

          Formula 2: Using Net Income

          Alternatively, you can calculate FCF using net income, adjusting for non-cash expenses and changes in working capital.
          Free Cash Flow (FCF) = Net Income + Depreciation/Amortization - Changes in Working Capital - Capital Expenditures (CapEx)
          Net Income: Found on the income statement.
          Depreciation/Amortization: Non-cash expenses added back to net income.
          Changes in Working Capital: Reflects changes in current assets and liabilities.

          Step-by-Step Example

          Let’s walk through an example to illustrate how to calculate free cash flow.
          Company XYZ Financials (in millions):
          Operating Cash Flow (OCF): $500
          Capital Expenditures (CapEx): $200
          Net Income: $400
          Depreciation/Amortization: $50
          Changes in Working Capital: $30
          Using Formula 1:FCF = OCF - CapExFCF = 500−500−200 = $300 million
          Using Formula 2:FCF = Net Income + Depreciation/Amortization - Changes in Working Capital - CapExFCF = 400+400+50 - 30−30−200 = $220 million
          Note: The two formulas may yield slightly different results due to variations in accounting practices.

          Tips for Accurate Free Cash Flow Analysis

          Use Consistent Data: Ensure all figures are from the same reporting period.
          Adjust for One-Time Items: Exclude non-recurring expenses or income to get a clearer picture of ongoing operations.
          Compare Across Peers: Benchmark a company’s FCF against industry peers for context.
          Monitor Trends: Analyze FCF over multiple periods to identify growth or decline patterns.
          Consider Quality of Earnings: High FCF with low earnings quality may indicate aggressive accounting practices.

          Limitations of Free Cash Flow

          While FCF is a powerful metric, it has limitations:
          It doesn’t account for future obligations like debt repayments.
          It may not reflect short-term liquidity challenges.
          Companies in growth phases may have negative FCF due to heavy investments.

          Conclusion

          Free cash flow is a vital metric for assessing a company’s financial performance and flexibility. By understanding how to calculate FCF and interpret its implications, investors and analysts can make more informed decisions. Whether you’re evaluating a potential investment or managing a business, mastering free cash flow analysis is a valuable skill.
          Remember, FCF is just one piece of the puzzle. Combine it with other financial metrics and qualitative factors for a comprehensive evaluation of a company’s prospects.
          To stay updated on all economic events of today, please check out our Economic calendar
          Risk Warnings and Disclaimers
          You understand and acknowledge that there is a high degree of risk involved in trading. Following any strategies or investment methods may lead to potential losses. The content on the site is provided by our contributors and analysts for information purposes only. You are solely responsible for determining whether any trading assets, securities, strategy, or any other product is suitable for investing based on your own investment objectives and financial situation.
          Add to Favorites
          Share

          Charles Schwab vs. Fidelity: Which Brokerage is Right for You?

          Glendon

          Economic

          Choosing the right brokerage is a critical decision for investors. Two of the most popular options are Charles Schwab and Fidelity. Both are industry giants, offering a wide range of services, tools, and investment options. But which one is the better choice for you? In this article, we’ll compare Charles Schwab and Fidelity across key categories, including fees, investment options, tools, customer service, and more, to help you make an informed decision.

          Overview of Charles Schwab and Fidelity

          Charles Schwab

          Founded in 1971, Charles Schwab is known for its low-cost investment options, robust trading platforms, and excellent customer service. It offers a wide range of products, including stocks, ETFs, mutual funds, options, and retirement accounts. Schwab is also a pioneer in commission-free trading and provides extensive educational resources for investors.

          Fidelity

          Established in 1946, Fidelity is one of the largest and most trusted brokerages in the world. It offers a comprehensive suite of investment products, including stocks, ETFs, mutual funds, bonds, and retirement accounts. Fidelity is renowned for its research tools, low fees, and strong customer support.

          Key Comparison Categories

          1. Fees and Commissions

          Both Charles Schwab and Fidelity have eliminated commissions for online stock, ETF, and options trades, making them highly competitive in terms of fees.
          Charles Schwab:
          $0 commissions for online stock, ETF, and options trades.
          No account fees or minimums for most accounts.
          Low expense ratios for Schwab ETFs and mutual funds.
          Fidelity:
          $0 commissions for online stock, ETF, and options trades.
          No account fees or minimums for most accounts.
          Offers zero-expense-ratio index funds (e.g., Fidelity ZERO funds).
          Winner: Tie. Both brokerages offer commission-free trading and low fees.

          2. Investment Options

          Both platforms provide a wide range of investment options, but there are some differences.
          Charles Schwab:
          Stocks, ETFs, mutual funds, options, futures, and bonds.
          Access to international markets and forex trading.
          Schwab ETFs and mutual funds are highly rated for low costs.
          Fidelity:
          Stocks, ETFs, mutual funds, options, bonds, and CDs.
          Extensive mutual fund selection, including actively managed funds.
          Offers fractional shares for stocks and ETFs.
          Winner: Fidelity, for its fractional shares and broader mutual fund selection.

          3. Trading Platforms and Tools

          Both brokerages offer advanced trading platforms and tools, but they cater to different types of investors.
          Charles Schwab:
          StreetSmart Edge: A powerful desktop platform for active traders.
          Mobile app with intuitive design and robust features.
          Extensive research and educational resources.
          Fidelity:
          Active Trader Pro: A comprehensive platform for advanced traders.
          Mobile app with excellent usability and features like fractional trading.
          Strong research tools, including stock screeners and analyst reports.
          Winner: Tie. Both platforms are excellent, but the choice depends on your trading style.

          4. Customer Service

          Customer service is a critical factor when choosing a brokerage.
          Charles Schwab:
          24/7 customer support via phone, chat, and email.
          In-person support at Schwab branches.
          Highly rated for responsiveness and expertise.
          Fidelity:
          24/7 customer support via phone, chat, and email.
          In-person support at Fidelity investor centers.
          Known for its knowledgeable and friendly representatives.
          Winner: Tie. Both brokerages offer exceptional customer service.

          5. Educational Resources

          Education is essential for both new and experienced investors.
          Charles Schwab:
          Schwab Learning Center: Offers articles, videos, and webinars.
          Personalized coaching and financial planning services.
          Fidelity:
          Fidelity Learning Center: Provides articles, videos, and courses.
          Extensive research and market insights.
          Winner: Tie. Both platforms offer high-quality educational resources.

          6. Retirement Accounts

          Both brokerages are excellent choices for retirement planning.
          Charles Schwab:
          Offers IRAs, Roth IRAs, and rollover IRAs.
          No account fees or minimums for retirement accounts.
          Fidelity:
          Offers IRAs, Roth IRAs, rollover IRAs, and SEP IRAs.
          No account fees or minimums for retirement accounts.
          Winner: Tie. Both are strong contenders for retirement planning.

          Who Should Choose Charles Schwab?

          Investors who prefer low-cost ETFs and mutual funds.
          Active traders who need a powerful desktop platform.
          Those who value in-person support at Schwab branches.

          Who Should Choose Fidelity?

          Investors interested in fractional shares and a broader mutual fund selection.
          Beginners who want access to zero-expense-ratio index funds.
          Those who prioritize advanced research tools and market insights.

          Final Verdict

          Both Charles Schwab and Fidelity are top-tier brokerages with low fees, robust tools, and excellent customer service. Your choice ultimately depends on your specific needs and preferences.

          Choose Charles Schwab

          if you’re focused on low-cost ETFs, active trading, and in-person support.

          Choose Fidelity

          if you want fractional shares, zero-expense-ratio funds, and advanced research tools.
          Regardless of your choice, both platforms provide the tools and resources you need to succeed as an investor.
          To stay updated on all economic events of today, please check out our Economic calendar
          Risk Warnings and Disclaimers
          You understand and acknowledge that there is a high degree of risk involved in trading. Following any strategies or investment methods may lead to potential losses. The content on the site is provided by our contributors and analysts for information purposes only. You are solely responsible for determining whether any trading assets, securities, strategy, or any other product is suitable for investing based on your own investment objectives and financial situation.
          Add to Favorites
          Share

          Real GDP vs. GDP: When and Why Economists Make the Switch

          Glendon

          Economic

          Gross Domestic Product (GDP) is one of the most widely used indicators of a country’s economic performance. It measures the total value of goods and services produced within a nation’s borders over a specific period. However, economists often switch between GDP and Real GDP when analyzing economic trends. But what’s the difference between the two, and why does it matter? In this article, we’ll explore the distinctions between Real GDP and GDP, when to use each, and why economists make the switch.

          What is GDP?

          GDP, or nominal GDP, represents the total monetary value of all goods and services produced in a country during a specific period, typically a quarter or a year. It is calculated using current market prices, which means it includes the effects of inflation or deflation.
          Formula for GDP:GDP = Consumption + Investment + Government Spending + (Exports - Imports)
          While GDP provides a snapshot of economic activity, it has a significant limitation: it doesn’t account for changes in price levels. This is where Real GDP comes into play.

          What is Real GDP?

          Real GDP adjusts nominal GDP for inflation or deflation, providing a more accurate measure of economic growth over time. By using constant prices from a base year, Real GDP removes the distortion caused by price changes, allowing economists to compare economic output across different periods more effectively.
          Formula for Real GDP:Real GDP = (Nominal GDP / GDP Deflator) x 100
          The GDP deflator is a measure of price inflation or deflation relative to the base year.

          Key Differences Between GDP and Real GDP

          AspectGDP (Nominal GDP)Real GDP
          Price AdjustmentUses current market pricesUses constant base-year prices
          Inflation ImpactIncludes inflation/deflationExcludes inflation/deflation
          PurposeMeasures current economic outputMeasures economic growth over time
          AccuracyLess accurate for long-term analysisMore accurate for long-term analysis

          Why Do Economists Switch Between GDP and Real GDP?

          Economists use both GDP and Real GDP depending on the context and the type of analysis they are conducting. Here’s why:

          1. Assessing Economic Growth

          Real GDP is the preferred metric for measuring economic growth because it eliminates the effects of inflation. For example, if nominal GDP increases by 5% but inflation is 3%, the real economic growth is only 2%. Real GDP provides a clearer picture of whether an economy is genuinely expanding or if the growth is just a result of rising prices.

          2. Comparing Economies Over Time

          When comparing economic performance across different years, Real GDP is essential. Nominal GDP can be misleading because it doesn’t account for changes in purchasing power. For instance, a country with high inflation might show rising nominal GDP, but its citizens might not actually be better off.

          3. Policy Making and Planning

          Governments and central banks rely on Real GDP to design economic policies. For example, if Real GDP growth is slowing, policymakers might implement stimulus measures to boost the economy. Nominal GDP, on the other hand, is more useful for understanding the current size of the economy and tax revenues.

          4. International Comparisons

          When comparing the economic performance of different countries, Real GDP is often used because it accounts for differences in price levels and inflation rates. This ensures a fair comparison of living standards and productivity.

          When to Use GDP vs. Real GDP

          Use GDP (Nominal GDP):
          To measure the current size of an economy.
          To calculate per capita income in current dollars.
          To analyze short-term economic trends without adjusting for inflation.
          Use Real GDP:
          To measure long-term economic growth.
          To compare economic performance across different time periods.
          To assess the impact of inflation on economic output.

          Practical Example

          Let’s consider an example to illustrate the difference between GDP and Real GDP.
          Country A’s Economic Data:
          Nominal GDP in 2022: $1,000 billion
          Nominal GDP in 2023: $1,100 billion
          Inflation Rate: 4%
          Calculating Real GDP for 2023:Real GDP = (Nominal GDP / (1 + Inflation Rate))Real GDP = 1,100/1.04=1,100billion/1.04=1,057.7 billion
          While nominal GDP suggests a 10% growth (1,000 billion to 1,100 billion), Real GDP reveals that the actual economic growth, after adjusting for inflation, is only 5.77%.

          Limitations of GDP and Real GDP

          While both metrics are valuable, they have limitations:
          GDP: Doesn’t account for income inequality, environmental degradation, or non-market activities like unpaid work.
          Real GDP: Relies on accurate inflation data, which can be challenging to measure.

          Conclusion

          Understanding the difference between GDP and Real GDP is crucial for accurate economic analysis. While GDP provides a snapshot of current economic activity, Real GDP offers a clearer picture of long-term growth by adjusting for inflation. Economists switch between the two depending on the context, ensuring they have the right tool for the job.
          Whether you’re a policymaker, investor, or student of economics, mastering these concepts will help you make better-informed decisions and gain deeper insights into the health and trajectory of an economy.
          To stay updated on all economic events of today, please check out our Economic calendar
          Risk Warnings and Disclaimers
          You understand and acknowledge that there is a high degree of risk involved in trading. Following any strategies or investment methods may lead to potential losses. The content on the site is provided by our contributors and analysts for information purposes only. You are solely responsible for determining whether any trading assets, securities, strategy, or any other product is suitable for investing based on your own investment objectives and financial situation.
          Add to Favorites
          Share

          Canadian Dollar Strength Draws Doubters

          Warren Takunda

          Economic

          "We still harbour doubts about a continuation of the recent CAD rally," says John Velis, Americas Macro Strategist at Bank of New York (BNY).
          The observation follows a spike in the Dollar-Canadian Dollar exchange rate (USDCAD) on Monday to 1.4793 and associated spikes in non-USD/CAD exchange rates.
          BNY thinks Canada is caught in tariff limbo, negatively impacting investor sentiment.
          "Currency volatility is extraordinary and CAD's carry-to-volatility return since the beginning of the year is among the worst of the 30 or so currencies we characterise as the set of 'expanded majors,' ranking fifth worst. Not that the Canadian dollar is a strong carry currency, but the risk-reward of trying to trade Canada since January 1 is highly unattractive presently," explains Vallis.
          The Canadian Dollar has recovered from the worst excesses of Monday's selloff to USD/CAD 1.4346, with GBP/CAD paring to 1.79 and EUR/CAD to 1.49.
          The relief buying follows the last-minute avoidance of U.S.-Canada trade tariffs that were due to come into effect this week, sparking the start of a North American trade war.
          Trump and Trudeau agreed to suspect the tariffs to allow negotiators to work towards a new trade deal, with feedback expected at the beginning of March.
          "From a fundamental perspective, it still seems too early for long-term investors to aggressively buy the CAD as trade tensions might get worse before they get better. However, given depressed sentiment and stretched positioning, starting to build small long positions offers an attractive reward-to-risk ratio," says Chester Ntonifor, Foreign Exchange Strategist at BCA Research.
          However, BNY thinks the Canadian Dollar is also at risk of dislocation in its relationship with two-year bond yields.
          The bank's research shows a "remarkable" correlation between USD/CAD and the differential between U.S. and Canadian two-year yields.
          "We think this correlation will reassert itself soon, considering the 2y yields reflect relative monetary policy expectations. The Bank of Canada is still quite likely to be more aggressive on rates owing to differing local macroeconomic fundamentals," warns Vallis.
          Canadian Dollar Strength Draws Doubters_1

          Image courtesy of BNY.

          The implication is that CAD weakness will extend even as trade relations normalise.
          Analysts at Goldman Sachs previously estimated that the Canadian Dollar could weaken by around 13% to a permanent 25% across-the-board tariff if the currency followed the typical response to a change in the Terms of Trade.
          A lower initial tariff on energy products, which account for around a quarter of Canada’s exports to the US, lowers that estimate slightly, but given the uncertainties at play Goldman still thinks that is theright ballpark as a theoretical final resting place.
          Analysts at the Wall Street bank are also watching yield differentials, noting that in the first trade war, USD/CAD would regularly trade at a 4-5% premium to rate differentials, but lately that has hovered around 1-2%.
          "Taken together, we think USD/CAD will likely move about 3-5% higher from Friday’s close in the comingdays, assuming no significant progress in the ongoing negotiations," says Goldman Sachs.

          Source: Poundsterlinglive

          To stay updated on all economic events of today, please check out our Economic calendar
          Risk Warnings and Disclaimers
          You understand and acknowledge that there is a high degree of risk involved in trading. Following any strategies or investment methods may lead to potential losses. The content on the site is provided by our contributors and analysts for information purposes only. You are solely responsible for determining whether any trading assets, securities, strategy, or any other product is suitable for investing based on your own investment objectives and financial situation.
          Add to Favorites
          Share
          FastBull
          Copyright © 2025 FastBull Ltd

          728 RM B 7/F GEE LOK IND BLDG NO 34 HUNG TO RD KWUN TONG KLN HONG KONG

          TelegramInstagramTwitterfacebooklinkedin
          App Store Google Play Google Play
          Products
          Charts

          Chats

          Q&A with Experts
          Screeners
          Economic Calendar
          Data
          Tools
          Membership
          Features
          Function
          Markets
          Copy Trading
          Latest Signals
          Contests
          News
          Analysis
          24/7
          Columns
          Education
          Company
          Careers
          About Us
          Contact Us
          Advertising
          Help Center
          Feedback
          User Agreement
          Privacy Policy
          Business

          White Label

          Data API

          Web Plug-ins

          Poster Maker

          Affiliate Program

          Risk Disclosure

          The risk of loss in trading financial instruments such as stocks, FX, commodities, futures, bonds, ETFs and crypto can be substantial. You may sustain a total loss of the funds that you deposit with your broker. Therefore, you should carefully consider whether such trading is suitable for you in light of your circumstances and financial resources.

          No decision to invest should be made without thoroughly conducting due diligence by yourself or consulting with your financial advisors. Our web content might not suit you since we don't know your financial conditions and investment needs. Our financial information might have latency or contain inaccuracy, so you should be fully responsible for any of your trading and investment decisions. The company will not be responsible for your capital loss.

          Without getting permission from the website, you are not allowed to copy the website's graphics, texts, or trademarks. Intellectual property rights in the content or data incorporated into this website belong to its providers and exchange merchants.

          Not Logged In

          Log in to access more features

          FastBull Membership

          Not yet

          Purchase

          Become a signal provider
          Help Center
          Customer Service
          Dark Mode
          Price Up/Down Colors

          Log In

          Sign Up

          Position
          Layout
          Fullscreen
          Default to Chart
          The chart page opens by default when you visit fastbull.com