


- EURUSD
- XAUUSD
- XAGUSD
- WTI
- USDX


Markets
Analysis
User
24/7
Economic Calendar
Education
Data
- Names
- Latest
- Prev


There were plenty of good details to report in today's jobs report: the unexpected surge in monthly jobs (which came almost above the top of the forecast range), the drop in unemployment, the moderation in hourly earnings, the continued loss of federal workers, the jump in full-time jobs and the drop in part-time jobs.
There were plenty of good details to report in today's jobs report: the unexpected surge in monthly jobs (which came almost above the top of the forecast range), the drop in unemployment, the moderation in hourly earnings, the continued loss of federal workers, the jump in full-time jobs and the drop in part-time jobs.
There were also several not so good aspects: first and foremost, the narrow breadth in hiring, with most job growth in June the result of Education and Health services (+51K), and Government (+73), which are government, or government-linked, sectors.
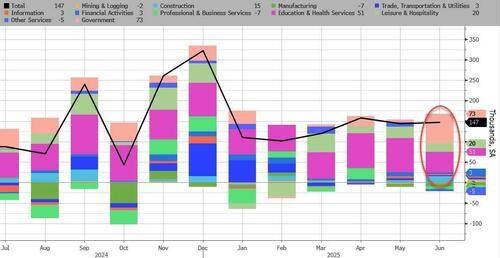
As Soutbay Research put it, the June Payrolls were derived from two sources: Healthcare (+59K) and Public Schools (+64K).
On the other end, private sector payrolls were soft: excluding healthcare, Southbay says to expect the Private Sector to be flat or possibly negative.
Meanwhile, even though it was not yet captured by the jobs report, there has been plenty of firing, with the best examples being Intel and Microsoft just announcing a combined 18K in layoffs.
As SouthBay concludes, "only another Hail Mary Seasonal Adjustment can prevent a negative print."
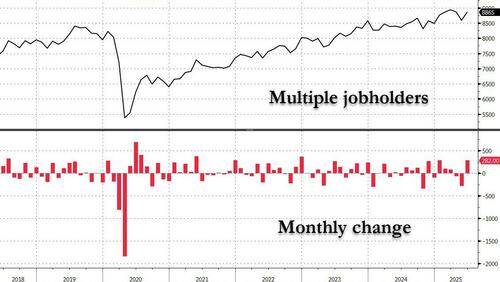
Another less then stellar aspect of today's report is that the number of multiple job holders actually soared by 282K, one of the biggest monthly increases on record, and one which pushed the total just shy of a new all time high.
But while no jobs report is without blemishes, the positives far outweighed the negatives, maybe not so much quantitatively then certainly qualitatively, because as we noted earlier, the most important metric of today's jobs report is arguably what got Trump elected in the first place.
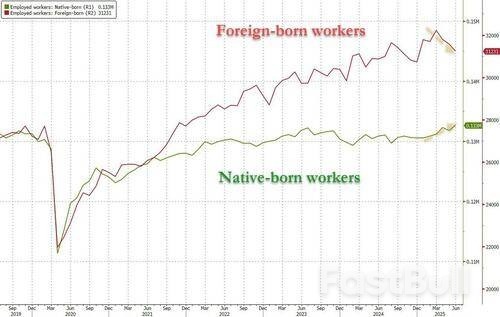
Recall back in January 2024 we first asked how is it not the biggest political talking point that since 2019, the US had only added foreign-born workers (which as we subsequently showed were primarily illegal aliens) while native workers remained flat or declined.
Less than a year later, illegal immigration in general, and its impact on the labor market indeed had become the biggest political talking point and one which one can argue got Trump elected.
So in retrospect, we can report today that Trump has certainly been working hard to resolve the situation and according to today's job report, the number of native-born workers has taken a decisive step higher, rising to a new all time high while foreign-born workers have been plunging ever since the election.
Here are the details:
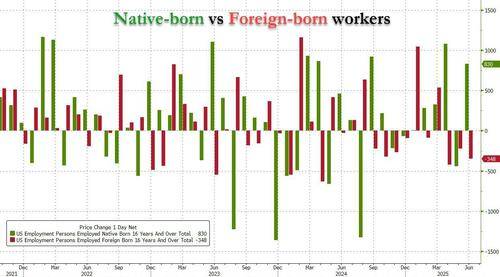
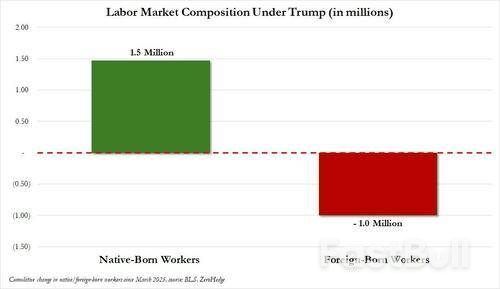
Extending the observation window since the start of Trump's admin (i.e., since March which covers the end of the first full month of the Trump admin), we find an even more impressive result: the number of native born workers has surged by 1.5 million while foreign-born (primarily illegals) have tumbled by 1 million.
So while one can certainly find warts in the broader jobs report - and with the economy 5 years into its post-covid expansion there better be weaknesses - the one thing that matters more than anything to most Americans, not having to compete with illegal aliens for jobs which not only pushes demand higher but also wages, is one where Trump can certainly say mission accomplished, for now.
728 RM B 7/F GEE LOK IND BLDG NO 34 HUNG TO RD KWUN TONG KLN HONG KONG


The risk of loss in trading financial instruments such as stocks, FX, commodities, futures, bonds, ETFs and crypto can be substantial. You may sustain a total loss of the funds that you deposit with your broker. Therefore, you should carefully consider whether such trading is suitable for you in light of your circumstances and financial resources.
No decision to invest should be made without thoroughly conducting due diligence by yourself or consulting with your financial advisors. Our web content might not suit you since we don't know your financial conditions and investment needs. Our financial information might have latency or contain inaccuracy, so you should be fully responsible for any of your trading and investment decisions. The company will not be responsible for your capital loss.
Without getting permission from the website, you are not allowed to copy the website's graphics, texts, or trademarks. Intellectual property rights in the content or data incorporated into this website belong to its providers and exchange merchants.
Not Logged In
Log in to access more features


Log In
Sign Up


