• Trade
  • Markets
  • Copy
  • Contests
  • News
  • 24/7
  • Calendar
  • Q&A
  • Chats
Screeners
SYMBOL
LAST
ASK
BID
HIGH
LOW
NET CHG.
%CHG.
SPREAD
SPX
S&P 500 Index
6917.82
6917.82
6917.82
6993.09
6862.05
-58.62
-0.84%
--
DJI
Dow Jones Industrial Average
49240.98
49240.98
49240.98
49653.13
48832.78
-166.67
-0.34%
--
IXIC
NASDAQ Composite Index
23255.18
23255.18
23255.18
23691.60
23027.21
-336.92
-1.43%
--
USDX
US Dollar Index
97.170
97.250
97.170
97.300
97.140
-0.030
-0.03%
--
EURUSD
Euro / US Dollar
1.18331
1.18339
1.18331
1.18360
1.18075
+0.00156
+ 0.13%
--
GBPUSD
Pound Sterling / US Dollar
1.37151
1.37162
1.37151
1.37194
1.36821
+0.00187
+ 0.14%
--
XAUUSD
Gold / US Dollar
5077.67
5078.08
5077.67
5090.35
4910.07
+131.42
+ 2.66%
--
WTI
Light Sweet Crude Oil
63.486
63.516
63.486
63.865
63.180
-0.148
-0.23%
--

Community Accounts

Signal Accounts
--
Profit Accounts
--
Loss Accounts
--
View More

Become a signal provider

Sell trading signals to earn additional income

View More

Guide to Copy Trading

Get started with ease and confidence

View More

Signal Accounts for Members

All Signal Accounts

Best Return
  • Best Return
  • Best P/L
  • Best MDD
Past 1W
  • Past 1W
  • Past 1M
  • Past 1Y

All Contests

  • All
  • Trump Updates
  • Recommend
  • Stocks
  • Cryptocurrencies
  • Central Banks
  • Featured News
Top News Only
Share

Azeri Central Bank Sets Key Refinancing Rate At 6.50% (Previously 6.75%)

Share

Eni Sees 2026 LNG Market 'Finely Balanced' On Thin Supply, Asian Demand

Share

Malaysia's Ringgit Continues To Strengthen On Hefty Capital Inflows - Minister Amir

Share

Equinor - Q4 Equity Production At 2198 Mboe/Day (Equinor Poll 2170 Mboe/Day)

Share

UBS CEO: As We Approach End Of Integration, Confident In Ability To Capture Remaining Synergies By Year-End, Which We Increased By $500 Million To $13.5 Billion

Share

UBS: Remain On Track To Complete Integration By Year-End, With Greater Proportion Of Net Saves Weighted To H2 2026

Share

UBS: Net New Asset Inflows In Global Wealth Management For The Year Reached $101 Billion

Share

UBS: Continued Wind-Down Of Non-Core And Legacy Risk-Weighted Asset, Reducing Rwa To $28.8 Billion

Share

UBS: Q4 Full-Time Equivalent Personnel At 103177 Versus 104427 As Of September 30, 2025

Share

Kazakhstan's Kaztransoil: Supplies Of 1.017 Million Tons Of Oil, Including 863000 Tons Of Russian Oil, To China In January Via Kazakhstan

Share

Bank Of Japan Won't Come To The Rescue Of A Takaichi-Driven Bond Rout

Share

New York Gold Futures Broke Through $5,100 Per Ounce, Up 3.34% On The Day

Share

Spot Gold Broke Through $5,080 Per Ounce, Up 2.71% On The Day

Share

Petronas Sets January Malaysian Crude Oil Price At $74.35

Share

Hsi Closes Midday At 26724, Down 109 Pts, Hsti Closes Midday At 5347, Down 119 Pts, Tencent Down Over 3%, Xinyi Glass, Techtronic Ind, Wharf Reic, Yankuang Energy, China East Air Hit New Highs

Share

India's Nifty 50 Index Turns Positive, Last Up 0.2%

Share

India's NIFTY IT Index Extends Losses, Last Down 6%

Share

《Hibor》1-Month Hibor Down To 2.49%, Sinking For 9 Days Logging 1-Month Low

Share

India's Nifty Bank Index Futures Down 0.05% In Pre-Open Trade

Share

Spot Gold Broke Through $5,070 Per Ounce, Up 2.49% On The Day

TIME
ACT
FCST
PREV
US President Trump delivered a speech
South Korea CPI YoY (Jan)

A:--

F: --

P: --

Japan Monetary Base YoY (SA) (Jan)

A:--

F: --

P: --

Australia Building Approval Total YoY (Dec)

A:--

F: --

P: --
Australia Building Permits MoM (SA) (Dec)

A:--

F: --

P: --
Australia Building Permits YoY (SA) (Dec)

A:--

F: --

P: --

Australia Private Building Permits MoM (SA) (Dec)

A:--

F: --

P: --
Australia Overnight (Borrowing) Key Rate

A:--

F: --

P: --

RBA Rate Statement
Japan 10-Year Note Auction Yield

A:--

F: --

P: --

The U.S. House of Representatives voted on a short-term spending bill to end the partial government shutdown.
Saudi Arabia IHS Markit Composite PMI (Jan)

A:--

F: --

P: --

RBA Press Conference
Turkey PPI YoY (Jan)

A:--

F: --

P: --

Turkey CPI YoY (Jan)

A:--

F: --

P: --

Turkey CPI YoY (Excl. Energy, Food, Beverage, Tobacco & Gold) (Jan)

A:--

F: --

P: --

U.K. 10-Year Note Auction Yield

A:--

F: --

P: --

Richmond Federal Reserve President Barkin delivered a speech.
U.S. Weekly Redbook Index YoY

A:--

F: --

P: --

Mexico Manufacturing PMI (Jan)

A:--

F: --

P: --

U.S. API Weekly Refined Oil Stocks

A:--

F: --

P: --

U.S. API Weekly Gasoline Stocks

A:--

F: --

P: --

U.S. API Weekly Cushing Crude Oil Stocks

A:--

F: --

P: --

U.S. API Weekly Crude Oil Stocks

A:--

F: --

P: --

Japan IHS Markit Services PMI (Jan)

A:--

F: --

P: --

Japan IHS Markit Composite PMI (Jan)

A:--

F: --

P: --

China, Mainland Caixin Services PMI (Jan)

A:--

F: --

P: --

China, Mainland Caixin Composite PMI (Jan)

A:--

F: --

P: --

India HSBC Services PMI Final (Jan)

A:--

F: --

P: --

India IHS Markit Composite PMI (Jan)

A:--

F: --

P: --

Russia IHS Markit Services PMI (Jan)

A:--

F: --

P: --

South Africa IHS Markit Composite PMI (SA) (Jan)

--

F: --

P: --

Italy Services PMI (SA) (Jan)

--

F: --

P: --

Italy Composite PMI (Jan)

--

F: --

P: --

Germany Composite PMI Final (SA) (Jan)

--

F: --

P: --

Euro Zone Composite PMI Final (Jan)

--

F: --

P: --

Euro Zone Services PMI Final (Jan)

--

F: --

P: --

U.K. Composite PMI Final (Jan)

--

F: --

P: --

U.K. Total Reserve Assets (Jan)

--

F: --

P: --

U.K. Services PMI Final (Jan)

--

F: --

P: --

U.K. Official Reserves Changes (Jan)

--

F: --

P: --

Euro Zone Core CPI Prelim YoY (Jan)

--

F: --

P: --

Euro Zone Core HICP Prelim YoY (Jan)

--

F: --

P: --

Euro Zone PPI MoM (Dec)

--

F: --

P: --

Euro Zone HICP Prelim YoY (Jan)

--

F: --

P: --

Euro Zone Core HICP Prelim MoM (Jan)

--

F: --

P: --

Italy HICP Prelim YoY (Jan)

--

F: --

P: --

Euro Zone Core CPI Prelim MoM (Jan)

--

F: --

P: --

Euro Zone PPI YoY (Dec)

--

F: --

P: --

U.S. MBA Mortgage Application Activity Index WoW

--

F: --

P: --

Brazil IHS Markit Composite PMI (Jan)

--

F: --

P: --

Brazil IHS Markit Services PMI (Jan)

--

F: --

P: --

U.S. ADP Employment (Jan)

--

F: --

P: --

The U.S. Treasury Department released its quarterly refinancing statement.
U.S. IHS Markit Composite PMI Final (Jan)

--

F: --

P: --

U.S. IHS Markit Services PMI Final (Jan)

--

F: --

P: --

U.S. ISM Non-Manufacturing Price Index (Jan)

--

F: --

P: --

U.S. ISM Non-Manufacturing Employment Index (Jan)

--

F: --

P: --

U.S. ISM Non-Manufacturing New Orders Index (Jan)

--

F: --

P: --

U.S. ISM Non-Manufacturing PMI (Jan)

--

F: --

P: --

U.S. ISM Non-Manufacturing Inventories Index (Jan)

--

F: --

P: --

Q&A with Experts
    • All
    • Chatrooms
    • Groups
    • Friends
    SlowBear ⛅ flag
    marsgents
    @marsgents yup slow and steady - but i still want to see another leg lower on Gold so its a slipery slope
    SlowBear ⛅ flag
    marsgents
    @marsgents Silver is calling for that early drop while somerhing is driving Gold mad
    marsgents flag
    SlowBear ⛅
    @SlowBear ⛅lol,me too,4h like bear flag on both,thats why i short every time i see weakness🤣
    SlowBear ⛅ flag
    marsgents
    @marsgentsI mean that is just pretty smart, we should be able to see 4500 in the future, but i have had my fun with gold now, i approcah it very carefully
    marsgents flag
    SlowBear ⛅
    @SlowBear ⛅yesterday i short at 4984 yo 4884,and buy below my tp 4882,long still running,silver i short 89 to 82.9
    Brendon Urie flag
    Brendon Urie
    gold sell now 5088/5090 target 5085/ target 5082/ target 5070/5060 stop loss 5102
    xauusd Sell tp1 5085 Hit 🎯 running Profits +30 Pips ❤️‍🔥 pro Entry Clean Execution 💥💥
    Brendon Urie flag
    Brendon Urie flag
    who want accurate trades daily 7/10
    SlowBear ⛅ flag
    marsgents
    @marsgents Oh that is clean bro, you milk front back and centre, i was not in the mood to tade Gold that way yesterday i just took one and slept on it
    Issy Nakam flag
    USDJPY has reached its 61.8 fib retrasement , verry exited to see what will happen , looking at a drop to 155.030 before continuation of the intended bulish direction .
    Issy Nakam flag
    Brendon Urie flag
    Brendon Urie
    gold sell now 4988/4990 target 4985/ target 4982/ target 4970/4960 stop loss 5002
    xauusd Sell. Tp2 5081 Hit Successfully running Profits +70 Pip's ❤️‍🔥 pro Entry Clean Execution ❤️‍🔥 let's Close All
    Brendon Urie flag
    Brendon Urie flag
    who want accurate trades daily 7/10
    marsgents flag
    SlowBear ⛅
    @SlowBear ⛅it need retest low,but keep refusing boss🤣
    SlowBear ⛅ flag
    Issy Nakam
    USDJPY has reached its 61.8 fib retrasement , verry exited to see what will happen , looking at a drop to 155.030 before continuation of the intended bulish direction .
    @Issy Nakam i am looking for a drop on UJ towards 149 before i run a buy back on it
    SlowBear ⛅ flag
    Issy Nakam
    @Issy NakamThis is decent though, if we are focusing on that trend and the trendline, but i am sleeping on the daily trend! Ans that needs a 3wave corrective move!
    SlowBear ⛅ flag
    marsgents
    @marsgents Yes we know what happen when Gold refuse to retest low, it runs up, ten crash down!
    marsgents flag
    SlowBear ⛅
    @SlowBear ⛅we need careful on her,she wipe 2 weeks gain in 2 days when her period came😂
    marsgents flag
    SlowBear ⛅
    @SlowBear ⛅4h base on recent rally look weak boss
    Type here...
    Add Symbol or Code

      No matching data

      All
      Trump Updates
      Recommend
      Stocks
      Cryptocurrencies
      Central Banks
      Featured News
      • All
      • Russia-Ukraine Conflict
      • Middle East Flashpoint
      • All
      • Russia-Ukraine Conflict
      • Middle East Flashpoint
      Search
      Products

      Charts Free Forever

      Chats Q&A with Experts
      Screeners Economic Calendar Data Tools
      Membership Features
      Data Warehouse Market Trends Institutional Data Policy Rates Macro

      Market Trends

      Market Sentiment Order Book Forex Correlations

      Top Indicators

      Charts Free Forever
      Markets

      News

      News Analysis 24/7 Columns Education
      From Institutions From Analysts
      Topics Columnists

      Latest Views

      Latest Views

      Trending Topics

      Top Columnists

      Latest Update

      Signals

      Copy Rankings Latest Signals Become a signal provider AI Rating
      Contests
      Brokers

      Overview Brokers Assessment Rankings Regulators News Claims
      Broker listing Forex Brokers Comparison Tool Live Spread Comparison Scam
      Q&A Complaint Scam Alert Videos Tips to Detect Scam
      More

      Business
      Events
      Careers About Us Advertising Help Center

      White Label

      Broker API

      Data API

      Web Plug-ins

      Affiliate Program

      Awards Institution Evaluation IB Seminar Salon Event Exhibition
      Vietnam Thailand Singapore Dubai
      Fans Party Investment Sharing Session
      FastBull Summit BrokersView Expo
      Recent Searches
        Top Searches
          Markets
          News
          Analysis
          User
          24/7
          Economic Calendar
          Education
          Data
          • Names
          • Latest
          • Prev

          View All

          No data

          Scan to Download

          Faster Charts, Chat Faster!

          Download App
          English
          • English
          • Español
          • العربية
          • Bahasa Indonesia
          • Bahasa Melayu
          • Tiếng Việt
          • ภาษาไทย
          • Français
          • Italiano
          • Türkçe
          • Русский язык
          • 简中
          • 繁中
          Open Account
          Search
          Products
          Charts Free Forever
          Markets
          News
          Signals

          Copy Rankings Latest Signals Become a signal provider AI Rating
          Contests
          Brokers

          Overview Brokers Assessment Rankings Regulators News Claims
          Broker listing Forex Brokers Comparison Tool Live Spread Comparison Scam
          Q&A Complaint Scam Alert Videos Tips to Detect Scam
          More

          Business
          Events
          Careers About Us Advertising Help Center

          White Label

          Broker API

          Data API

          Web Plug-ins

          Affiliate Program

          Awards Institution Evaluation IB Seminar Salon Event Exhibition
          Vietnam Thailand Singapore Dubai
          Fans Party Investment Sharing Session
          FastBull Summit BrokersView Expo

          SPDR S&P Software & Services ETF (XSW) Price Forecast: Breakdown Targets Key Support Zone

          Samantha Luan

          Stocks

          Summary:

          Software stocks sold off sharply, pushing XSW into a confirmed bearish breakdown as price approaches a major technical support zone that could determine near-term direction.

          Key Points:

          · XSW confirms head-and-shoulders breakdown below $172 neckline
          · Bearish momentum remains strong, sellers firmly in control
          · Measured move suggests deeper downside toward $142–$144 if next support fails

          AI-Driven Selloff Pressures Software Sector

          Software related stocks got pummeled on Tuesday, as sentiment grew more bearish due to concerns about the impact of artificial intelligence (AI) on the industry. Fears were triggered following a disappointing earnings release from PayPal (PYPL) pre-market. Also, Anthropic released productivity tools for attorneys, which increased selling pressure on related legal publishing and software firms. Risks to the sector have been rising in recent months in anticipation that further advances in AI will cause a greater threat to software business models. Given the sharp declines across the sector, once support is found, buyers may return.

          XSW weekly chart shows approach towards long-term uptrend line and 200-day average support (Source: TradingView)

          XSW Confirms Head and Shoulders Breakdown

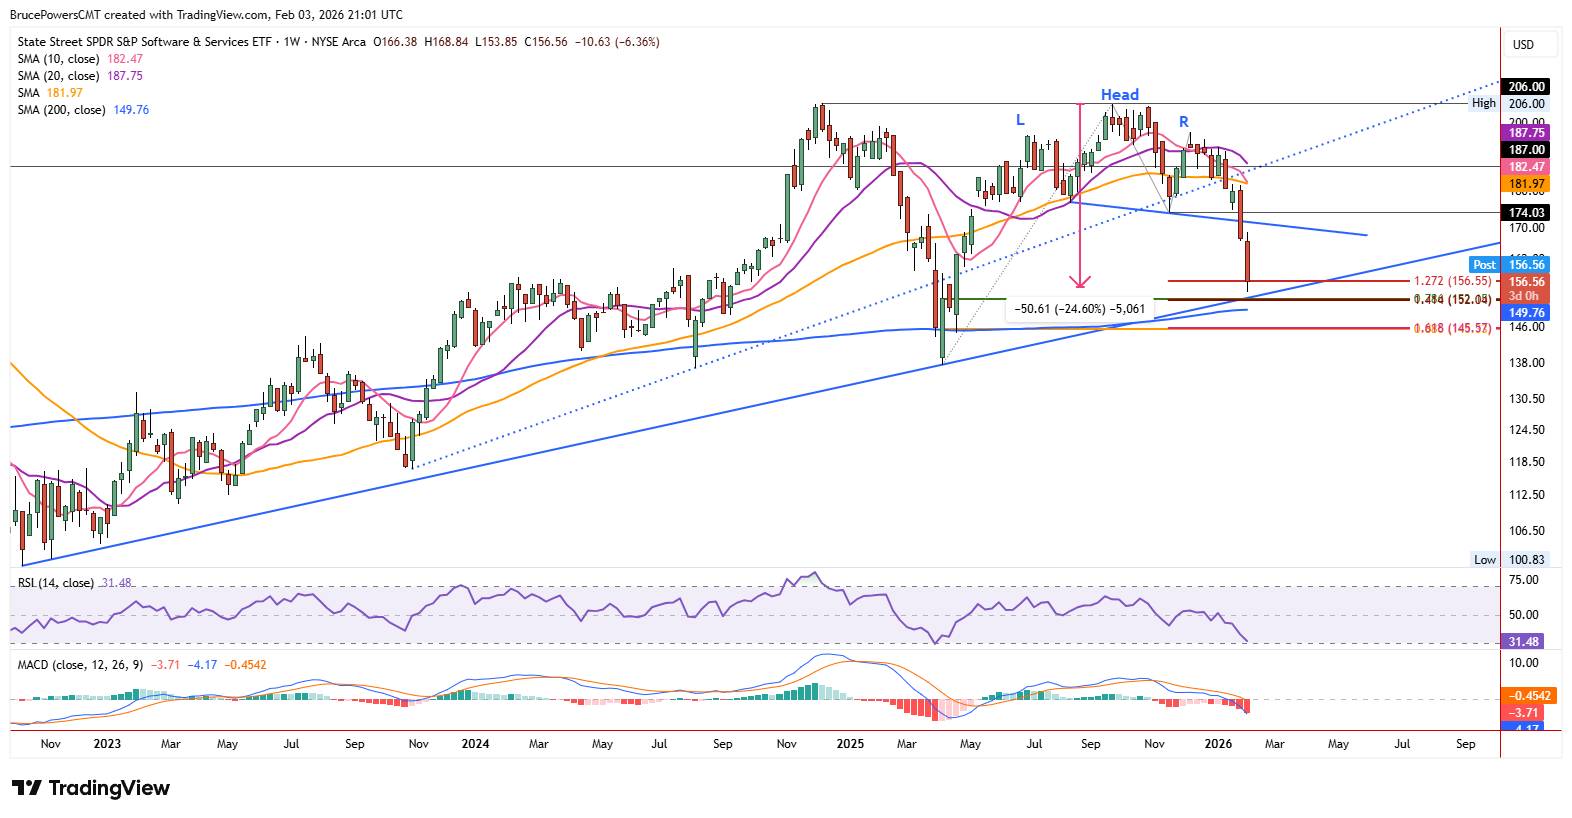
          The SPDR S&P Software & Services ETF (XSW) is a proxy for the sector. It broke down from a head and shoulders top reversal pattern last week, on a drop through a swing low at $174.03 and then the neckline of the pattern around $172. Bearish follow-through has been sharp and decisive, leaving little doubt that the sellers are in charge. XSW reached a low of $153.85 on Tuesday. Nonetheless, XSW is rapidly approaching a potentially significant support zone at the convergence of several indicators near $152.

          XSW daily chart shows head and shoulders bearish reversal and decline towards support zone. (Source: TradingView)

          Support zone converges near $152

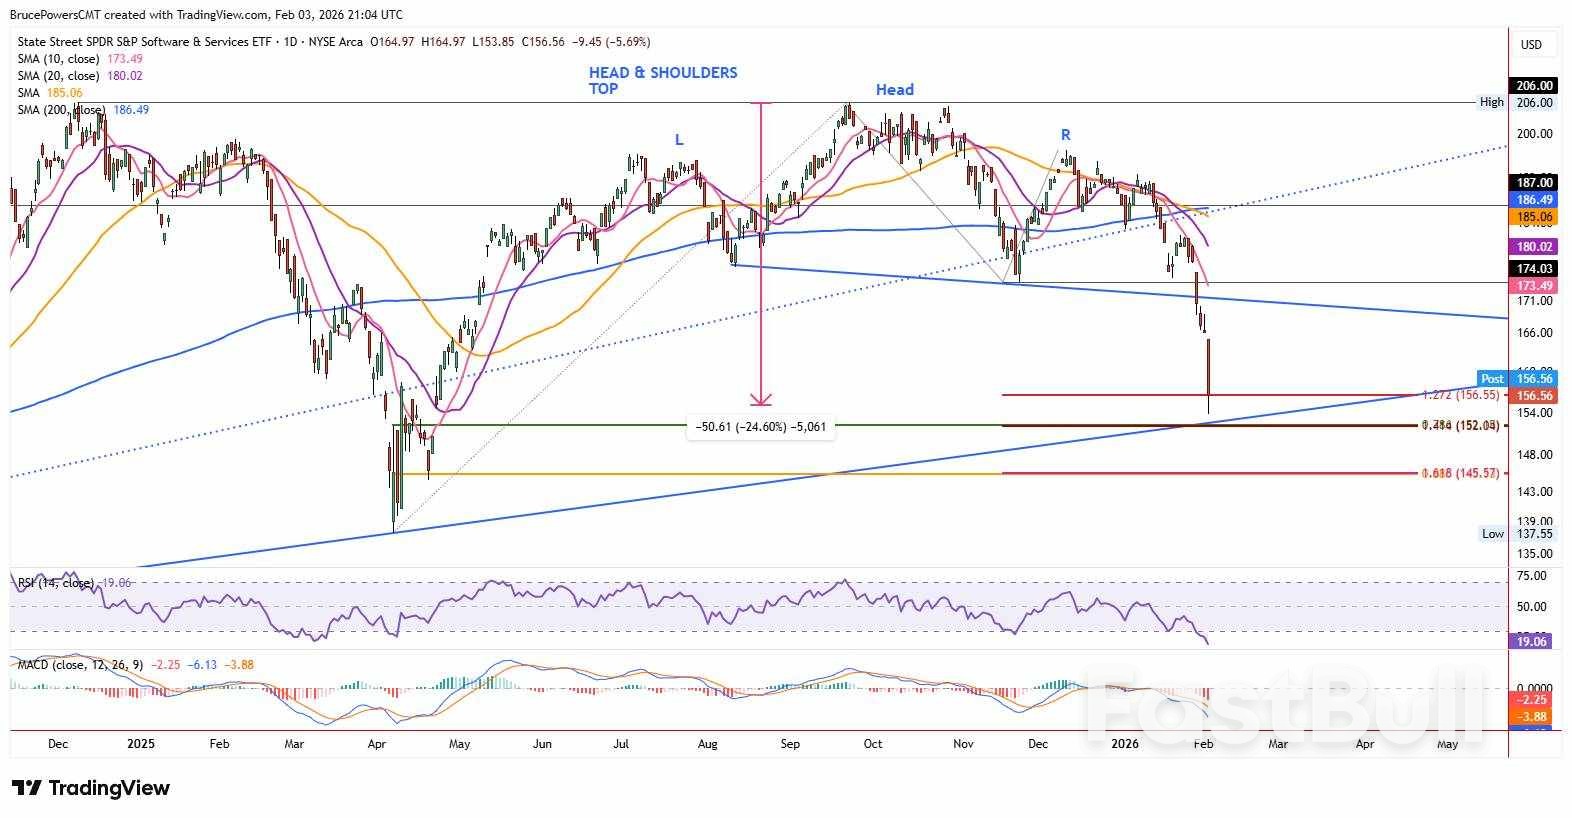
          When multiple indicators point to a similar price zone, that area can act both as a magnet, pulling price to it, and a strong support zone in the case of XSW. A 78.6% Fibonacci retracement of the previous upswing is at $152.15, and a 141.4% (√2) projection of a bearish measured move points to $152.04. Further, a long-term uptrend line is currently rising through that price zone. If there is an overshoot to the downside, then the 200-day average is at $149.75, providing a lower potential target zone. Since XSW has fallen hard and is very close to that long-term average, it wouldn't be surprising for it to be hit before the current retracement bottoms.

          Pattern targets $142–$144 if support fails

          The head and shoulders pattern suggests a lower target could be reached. Measuring the pattern provides an initial downside target around $141.79. Of course, that level would be preceded by a failure of support at the uptrend line and 200-day average. That target is derived when using the neckline as the bear trigger. However, if the swing low at $174.03 is used, a target at $144.12 is indicated.

          Source: FX Empire

          Risk Warnings and Disclaimers
          You understand and acknowledge that there is a high degree of risk involved in trading. Following any strategies or investment methods may lead to potential losses. The content on the site is provided by our contributors and analysts for information purposes only. You are solely responsible for determining whether any trading assets, securities, strategy, or any other product is suitable for investing based on your own investment objectives and financial situation.
          Add to Favorites
          Share

          USDCHF Moves Higher As Expected And Hits Targets

          Justin

          Forex

          Economic

          On January 30 2026 our clients was expecting for USDCHF to push higher to terminate red wave c, red wave y, blue wave (iv).

          The first chart below was published in our private members area and clearly shows the Elliott Wave count was calling for the red wave c push higher.

          The second chart is my buy entry. When the USDCHF pair tagged the bullish FVG zone (Gray Box) I entered the buy trade at 0.7667 with a 29 pip stop loss at 0.7638 and a take profit target at the 2R 0.7725.

          Added confirmation for the buy entry was the bullish divergence market pattern (Pink) which formed at the red wave x termination.

          USDCHF 1 Hour Chart January 30 2026

          USDCHF moves higher and hits 2R target at 0.7725 where I closed buy position for +58 pips and a +2% profit gain. (Risking 1% on every trade)

          A trader should always have multiple strategies all lined up before entering a trade. Never trade off one simple strategy. When multiple strategies all line up it allows a trader to see a clearer trade setup.

          We at EWF never say we are always right. No market service provider can forecast markets with 100% accuracy. Only thing we at EWF 100%, is that we are RIGHT more than we are WRONG.

          Of course, like any strategy/technique, there will be times when the strategy/technique fails so proper money/risk management should always be used on every trade.

          Source: Elliott Wave Forecast

          To stay updated on all economic events of today, please check out our Economic calendar
          Risk Warnings and Disclaimers
          You understand and acknowledge that there is a high degree of risk involved in trading. Following any strategies or investment methods may lead to potential losses. The content on the site is provided by our contributors and analysts for information purposes only. You are solely responsible for determining whether any trading assets, securities, strategy, or any other product is suitable for investing based on your own investment objectives and financial situation.
          Add to Favorites
          Share

          NZ Labour Market Statistics, December Quarter 2025

          Westpac

          Political

          Economic

          The unemployment rate ticked up to 5.4% in the December quarter. The details were positive though, with growth in jobs and hours being outstripped by an even larger rise in participation.

          · Unemployment rate: 5.4% (prev: 5.3%, Westpac: 5.3%, RBNZ: 5.3%, mkt: 5.3%)
          · Employment change: +0.5% (prev: 0.0%, Westpac: +0.3%, RBNZ: +0.2%, mkt: +0.3%)
          · Participation rate: 70.5% (prev: 70.3%, Westpac: 70.3%, RBNZ: 70.3%, mkt: 70.3%)
          · Labour costs (private sector): +0.5% (prev: +0.4%, Westpac: +0.5%, RBNZ: +0.5%, mkt: +0.5%)

          The December quarter labour market surveys showed some early signs of improvement in the jobs market, despite a further small rise in the headline unemployment rate. Wage growth measures remained unsurprisingly subdued at this stage of the cycle.

          Overall, we think the results were broadly in line with the Reserve Bank's forecasts and won't give them much new to mull over ahead of their 18 February policy review. What that means is there is little here to hurry the RBNZ quickly towards reversing those last 75bp of OCR cuts made after August 2025. Still muted wage pressures should imply there is time to assess the strength and durability of the recovery before raising rates. We remain comfortable with our forecast of a December 2026 first rate hike.

          The number of people employed rose by 0.5% for the quarter – actually more than what was suggested by the Monthly Employment Indicator, and ahead of the 0.3% rise in the working-age population. However, there was an even more significant rise in labour force participation from 70.3% to 70.5%, with the net result being an uptick in the unemployment rate. In any case, both of these 'surprises' are well with the margin of error for this survey, and we don't regard them as being meaningfully different from our expectations.

          Another positive indicator from the household survey was a 1% rise in hours worked for the quarter, on top of a 1.1% rise in the September quarter. We certainly wouldn't dismiss this lightly, given that this measure has been an unusually good guide to the swings in quarterly GDP in recent times. However, there was a contrasting 0.5% fall in total hours paid in the business-oriented Quarterly Employment Survey (which had also seen a strong 1.1% rise last quarter).

          Given the existing degree of slack in the labour market, wage trends unsurprisingly remained subdued. The Labour Cost Index rose by 0.4% overall for the quarter, with a 0.5% rise in the private sector and a more modest 0.3% rise in the public sector. On an annual basis the LCI rose by 2.0%, its slowest pace since March 2021.

          The unadjusted analytical LCI, which includes pay increases that are related to higher productivity, rose by 0.8% for the quarter, slightly more than the 0.7% rise in the September quarter. The annual growth rate slowed from 3.4% to 3.3%, also the lowest reading since March 2021. The distribution of pay rates continues to drift towards annual increases in the 2-3% range, and away from the larger increases that were more common in previous years.

          Source: Westpac Banking Corporation

          To stay updated on all economic events of today, please check out our Economic calendar
          Risk Warnings and Disclaimers
          You understand and acknowledge that there is a high degree of risk involved in trading. Following any strategies or investment methods may lead to potential losses. The content on the site is provided by our contributors and analysts for information purposes only. You are solely responsible for determining whether any trading assets, securities, strategy, or any other product is suitable for investing based on your own investment objectives and financial situation.
          Add to Favorites
          Share

          US & Israel Launch Naval Drills as Iran Tensions Simmer

          Isaac Bennett

          Middle East Situation

          Remarks of Officials

          Political

          The United States and Israel have kicked off joint naval military exercises in the Red Sea, a clear show of force as diplomatic tensions with Iran continue to build. The war games began on Monday, signaling a coordinated military posture between the two allies amid fears of a potential conflict.

          The Israel Defense Forces (IDF) confirmed the exercise on X, stating, "A joint exercise was conducted yesterday between a U.S. Navy destroyer and Israeli Navy vessels." The statement noted that the drill is part of the ongoing cooperation between the Israeli Navy and the US Fifth Fleet. The IDF added that the American destroyer's port visit was a pre-planned, routine part of the "strategic and close cooperation between the two navies."

          Figure 1: Joint US-Israel naval exercises in the Red Sea feature advanced warships, signaling a united front amid regional tensions with Iran.

          This move comes as the US continues to bolster its military presence in the Gulf region with cargo planes, fighter jets, and advanced air defense systems in preparation for any potential escalation with Iran.

          A Backdrop of Regional Military Posturing

          The joint drills follow a series of military maneuvers by Iran. In recent days, Iran conducted limited live-fire exercises in the strategic Strait of Hormuz and previously held joint naval operations with China and Russia.

          Despite this activity, a fragile de-escalation appears to be in effect. The USS Lincoln carrier group has reportedly moved away from the potential flashpoint and into waters off Yemen, seemingly to lower the temperature ahead of anticipated nuclear negotiations between the US and Iran, which are set to be hosted by Turkey.

          The Core Dispute: Nuclear Ambitions and Ballistic Missiles

          While Iran has shown willingness to discuss its nuclear program, negotiations are complicated by Washington's maximalist demands. A key sticking point is the US insistence that Tehran curtails or abandons its ballistic missile program—a non-starter for Iranian leaders.

          Iran views its missile capability as a critical defensive tool, particularly after being attacked without warning during the June war. Giving up this deterrent would leave the country vulnerable in any future conflict with Israel. This deep-seated distrust is compounded by the Trump administration's unilateral withdrawal from the Obama-era JCPOA nuclear deal, leaving Iran suspicious of US motives.

          Complex Alliance Dynamics

          Simultaneously, Israeli defense officials have been meeting with top US military leaders, with the Netanyahu government reportedly lobbying the Pentagon for a more robust stance against Iran.

          However, an underlying strategic gap may exist between the US and Israeli leadership. One Middle East observer noted a "persistent and unresolved gap between Trump and Prime Minister Netanyahu," which was not closed even during the recent 12-day war.

          According to the same analyst, even when President Trump authorized potential strikes in June, his goal was to use military pressure to force Iran into a better deal, not to achieve regime change. Until recently, the overthrow of the Iranian government was not a frequently stated objective from Trump. This nuance highlights the complex and sometimes conflicting strategies at play as all sides navigate the delicate balance between diplomacy and military deterrence.

          Risk Warnings and Disclaimers
          You understand and acknowledge that there is a high degree of risk involved in trading. Following any strategies or investment methods may lead to potential losses. The content on the site is provided by our contributors and analysts for information purposes only. You are solely responsible for determining whether any trading assets, securities, strategy, or any other product is suitable for investing based on your own investment objectives and financial situation.
          Add to Favorites
          Share

          UK Unemployment to Hit 9-Year High on Rising Labor Costs

          Frederick Miles

          Traders' Opinions

          Remarks of Officials

          Data Interpretation

          Economic

          Central Bank

          Political

          The UK unemployment rate is on track to hit its highest level since 2015 this year, driven by a sharp increase in labor costs, according to a new forecast from the National Institute of Economic and Social Research (NIESR).

          The think tank predicts the jobless rate will average 5.4% in the current year, a notable increase from 4.8% in 2025 and higher than most other economic projections.

          Rising Minimum Wage and Taxes Fuel Jobless Rate Spike

          A key factor behind the forecast is the mounting cost of hiring workers. "Part of this unemployment story in the UK is rising labour costs," explained NIESR economist Ben Caswell.

          According to the institute's analysis, the cost of employing an entry-level worker surged by 10.6% last year. This was fueled by two main drivers:

          • A rising minimum wage: Recent government policy has pushed the minimum wage to two-thirds of median earnings.

          • Higher employer taxes: An increase in social security contributions last year added to the financial burden on companies.

          NIESR found a direct correlation between these costs and job figures. "Industries which have a larger share of their workforce on the minimum wage have also experienced larger increases in their respective unemployment rates," Caswell noted.

          The pressure on employers is set to continue, with Britain's minimum wage scheduled to rise by another 4% in April. Prime Minister Keir Starmer's government also plans to continue phasing out the lower minimum wage rates for 18-20 year-old workers, further standardizing labor costs.

          Tech Sector Headwinds and Shifting Labor Force Dynamics

          NIESR's analysis also identified emerging weakness in the IT sector, where a rise in unemployment may be linked to the adoption of artificial intelligence reducing the demand for certain entry-level positions.

          However, the think tank clarified that the rising unemployment rate isn't solely due to a lack of job vacancies. The labor pool itself is expanding. More people who were previously considered economically inactive—neither working nor looking for a job—are now seeking employment. This trend, which follows a post-pandemic rise in inactivity rates, is increasing the number of people officially counted as unemployed.

          Long-Term Outlook and Bank of England Rate Cut Predictions

          Looking ahead, NIESR projects the unemployment rate will likely fall to 5% by 2028 or 2029, which it considers a sustainable long-term level outside of an economic boom. This comes after the official unemployment rate hit a nearly 50-year low of 3.8% in 2022 and 2019, though the survey used for that data is currently being overhauled due to quality concerns.

          Alongside its unemployment forecast, NIESR also revised its economic growth projections for 2026 and 2027 upward to 1.4% and 1.3%, respectively. The institute anticipates two interest rate cuts from the Bank of England this year, which would lower the benchmark rate from 3.75% to 3.25%.

          This prediction is more aggressive than the market consensus. Economists surveyed by Reuters do not expect the first rate cut to occur before March at the earliest. The Bank of England is scheduled to release its own updated economic forecasts on Thursday.

          To stay updated on all economic events of today, please check out our Economic calendar
          Risk Warnings and Disclaimers
          You understand and acknowledge that there is a high degree of risk involved in trading. Following any strategies or investment methods may lead to potential losses. The content on the site is provided by our contributors and analysts for information purposes only. You are solely responsible for determining whether any trading assets, securities, strategy, or any other product is suitable for investing based on your own investment objectives and financial situation.
          Add to Favorites
          Share

          India-U.S. Trade Deal Unlocks Key Sector Opportunities

          Thomas

          Traders' Opinions

          Energy

          Remarks of Officials

          Stocks

          Economic

          Daily News

          Political

          India and the United States have forged a significant trade pact that lowers tariffs on Indian exports from 25% to 18%. The agreement, announced by Trump, also includes a commitment from India to halt purchases of Russian crude oil and instead buy from the U.S. and potentially Venezuela.

          According to the announcement, India has pledged to purchase $500 billion worth of American agriculture, technology, energy, and other products. This development comes less than a week after India finalized a major free trade agreement with the European Union, signaling a rapid realignment of its global trade relationships.

          While many specifics of the U.S. deal are still being finalized, investors are already identifying key sectors poised to benefit.

          Manufacturing and Exports Set for a Major Boost

          India's labor-intensive export sector is seen as a primary winner. According to James Thom, senior investment director at Aberdeen Investments, industries like textiles, clothing, leather, jewelry, toys, and furniture now have a clear opportunity to reclaim market share from regional manufacturing rivals.

          The new 18% tariff rate positions India more competitively against:

          • Pakistan: 19% tariff

          • Vietnam: 20% tariff

          • Bangladesh: 20% tariff

          Thom noted that small and medium-sized companies are particularly well-positioned to gain from the tariff reduction. He added that the agreement should also provide a lift to banks, non-banking financial companies, and export-focused manufacturers, boosting overall retail sentiment in small and mid-cap stocks.

          A Strategic Win with Geopolitical Implications

          Analysts at Bernstein suggest that last week's India-EU treaty likely prompted the U.S. to accelerate its own deal with India. The agreement brings India more in line with its peers in the Association of Southeast Asian Nations (ASEAN), which analysts called "incrementally a big positive." It also enhances India's competitive standing relative to China.

          While certain industries like autos and metals might still face sector-specific tariffs, the improved diplomatic climate is expected to create broad-based advantages.

          IT and Pharma Emerge as Key Beneficiaries

          Bernstein analysts Venugopal Garre and Nikhil Arela highlighted that India's information technology sector stands to gain significantly. Although the trade pact primarily covers manufactured goods, the improved U.S.-India relations are expected to reduce regulatory scrutiny on I.T. services and lower the risk of future punitive actions, such as additional taxes.

          Based on this, the analysts outlined a tactical "buy" recommendation for Indian equities, with a short-term rebound expected in financials, I.T., and telecoms.

          Meanwhile, the recent EU trade deal has put a spotlight on India's pharmaceutical industry. According to BMI, Fitch Ratings' research unit, the elimination of 11% tariffs on EU drug imports—covering cancer therapies, biologics, and GLP-1s—is a game-changer. These imports amounted to $1.2 billion in 2024.

          BMI forecasts that lower import costs and more efficient supply chains will drive India's pharmaceutical market from $31.2 billion in 2025 to $45.7 billion by 2035, representing a compound annual growth rate of 5.2%. The EU agreement is also expected to help Indian firms diversify their export markets and reverse recent stagnation by streamlining regulatory compliance and reducing administrative costs.

          Market Reaction and Investor Outlook

          The trade announcement immediately lifted market sentiment. Russ Mould, investment director at A.J. Bell, pointed to the Sensex's 2.5% rise as evidence of renewed investor confidence. The Sensex index tracks 30 of the largest and most actively traded companies on the Bombay Stock Exchange.

          The positive momentum extended to UK-listed investment trusts with Indian exposure. Ashoka India, for instance, saw its shares climb 5.6% on the FTSE 250.

          "India has been a rich source of returns for investors over the past few decades, but Trump's tariff regime stalled momentum in the Sensex index," Mould said. "Investors will now be wondering if the trade deal effectively removes the shackles on the market and breathes new life into it, rather than simply resulting in a short-term relief rally."

          To stay updated on all economic events of today, please check out our Economic calendar
          Risk Warnings and Disclaimers
          You understand and acknowledge that there is a high degree of risk involved in trading. Following any strategies or investment methods may lead to potential losses. The content on the site is provided by our contributors and analysts for information purposes only. You are solely responsible for determining whether any trading assets, securities, strategy, or any other product is suitable for investing based on your own investment objectives and financial situation.
          Add to Favorites
          Share

          China's Yuan Surges on Exports: Can Beijing Stop the Rally?

          Alex

          Traders' Opinions

          Remarks of Officials

          Data Interpretation

          Economic

          Central Bank

          Forex

          China's booming export sector is fueling a powerful rally in its currency, the yuan, creating a critical challenge for policymakers. While most analysts believe officials will step in to halt further gains, mounting market pressure suggests the yuan could test levels that strain the country's economic model.

          The currency's strength is being driven by record-breaking foreign exchange inflows. In December, a staggering $452 billion in foreign currency flowed into Chinese banks, with a record $311 billion of that converted into yuan, according to data from the State Administration of Foreign Exchange. This wave of demand pushed the yuan to 6.9378 per dollar, its strongest point since 2023.

          The Consensus: A Managed Exchange Rate

          Most bank analysts believe the People's Bank of China (PBOC) will draw a line in the sand to prevent the yuan from appreciating much further. The consensus forecast from 13 global investment banks sees the currency ending the year at 6.92 per dollar, while derivatives markets are pricing it closer to 6.8.

          To maintain control, authorities have a well-established toolkit:

          • Official Guidance: Setting the yuan's daily midpoint trading fix at a level that signals disapproval of rapid gains.

          • State Bank Intervention: Directing state-owned banks to buy U.S. dollars in the open market to absorb upward pressure on the yuan.

          • Reserve Ratio Adjustments: Tweaking the foreign exchange reserve requirements for banks, which can compel them to hold more dollars.

          "Given that China's economic growth is still highly dependent on exports, the People's Bank of China may not yet be willing to risk a more significant appreciation of the currency," explained Wei He, an economist at Gavekal Dragonomics.

          Traders have already noted that the PBOC's midpoint has been consistently weaker than market estimates since November, a clear sign of official resistance. Janice Xue, a strategist at Bank of America Global Research, also anticipates policy tweaks, stating, "We see a high chance for the 20% risk reserve on banks' forward FX sale to be removed and expect FX reserve requirement ratio to be raised."

          Upside Risks and the Exporter Dilemma

          Despite the central bank's influence, some analysts see risks skewed toward a stronger yuan. Goldman Sachs recently upgraded its 12-month forecast to 6.7 per dollar, which would represent a 3.5% appreciation from current levels.

          "The pace of appreciation has exceeded our expectations," Goldman analysts noted, citing the record currency flows and what they perceive as a shift in tone from the central bank.

          A key risk is the creation of a positive feedback loop. As the yuan strengthens, exporters are incentivized to convert their dollar earnings into yuan more quickly to avoid future losses. This increased demand for yuan then pushes the currency even higher.

          This dynamic is already playing out. An electrical industry exporter based in Shanghai, who gave his surname as Ding, confirmed his firm was converting dollars to yuan faster in response to the recent exchange rate moves. While the 68.8% of export receipts converted to yuan in December was not a record, it signals a growing trend.

          Balancing Growth with Currency Stability

          The yuan's trajectory presents a fundamental dilemma for Beijing. China's 5% GDP growth last year was heavily reliant on a record $1.2 trillion trade surplus, an increase of about 20% from the previous year. A runaway currency rally would erode the competitive advantage of Chinese exporters and could put this growth engine at risk.

          "Our base scenario remains a strong export performance, which could support the yuan," said Chaoping Zhu, global market strategist at J.P. Morgan Asset Management. "However, as foreign governments become more cautious about the impacts on their economies, uncertainties are rising for Chinese export growth."

          This suggests a future of "higher two-way volatility," with the exchange rate likely fluctuating around the 7-per-dollar mark.

          For now, the PBOC appears focused on ensuring any appreciation is "on a gradual, measured pace," according to Kelvin Lam, senior China+ economist at Pantheon Macroeconomics. By managing a slow and stable nine-month rally that has lifted the yuan nearly 6% against the dollar, policymakers aim to boost the currency's appeal for international trade and investment without derailing the export machine that powers the economy.

          To stay updated on all economic events of today, please check out our Economic calendar
          Risk Warnings and Disclaimers
          You understand and acknowledge that there is a high degree of risk involved in trading. Following any strategies or investment methods may lead to potential losses. The content on the site is provided by our contributors and analysts for information purposes only. You are solely responsible for determining whether any trading assets, securities, strategy, or any other product is suitable for investing based on your own investment objectives and financial situation.
          Add to Favorites
          Share
          FastBull
          Copyright © 2026 FastBull Ltd

          728 RM B 7/F GEE LOK IND BLDG NO 34 HUNG TO RD KWUN TONG KLN HONG KONG

          TelegramInstagramTwitterfacebooklinkedin
          App Store Google Play Google Play
          Products
          Charts

          Chats

          Q&A with Experts
          Screeners
          Economic Calendar
          Data
          Tools
          Membership
          Features
          Function
          Markets
          Copy Trading
          Latest Signals
          Contests
          News
          Analysis
          24/7
          Columns
          Education
          Company
          Careers
          About Us
          Contact Us
          Advertising
          Help Center
          Feedback
          User Agreement
          Privacy Policy
          Personal Information Protection Statement
          Business

          White Label

          Broker API

          Data API

          Web Plug-ins

          Poster Maker

          Affiliate Program

          Risk Disclosure

          The risk of loss in trading financial instruments such as stocks, FX, commodities, futures, bonds, ETFs and crypto can be substantial. You may sustain a total loss of the funds that you deposit with your broker. Therefore, you should carefully consider whether such trading is suitable for you in light of your circumstances and financial resources.

          No decision to invest should be made without thoroughly conducting due diligence by yourself or consulting with your financial advisors. Our web content might not suit you since we don't know your financial conditions and investment needs. Our financial information might have latency or contain inaccuracy, so you should be fully responsible for any of your trading and investment decisions. The company will not be responsible for your capital loss.

          Without getting permission from the website, you are not allowed to copy the website's graphics, texts, or trademarks. Intellectual property rights in the content or data incorporated into this website belong to its providers and exchange merchants.

          Not Logged In

          Log in to access more features

          Connect Broker
          Become a signal provider
          Help Center
          Customer Service
          Dark Mode
          Price Up/Down Colors

          Log In

          Sign Up

          Position
          Layout
          Fullscreen
          Default to Chart
          The chart page opens by default when you visit fastbull.com