Markets
Analysis
User
24/7
Economic Calendar
Education
Data
- Names
- Latest
- Prev


Signal Accounts for Members
All Signal Accounts
All Contests


"The Big Short" Michael Burry Buys Put Options On A Semiconductor ETF: "I Know The Philadelphia Semiconductor Index Will Decline"
The Three Major U.S. Stock Indexes Closed Mixed, With The Dow Jones Industrial Average Down 0.16%, The Nasdaq Composite Up 1.63%, And The S&P 500 Up 0.80%. Large-cap Tech Stocks Rose Across The Board, With Intel Up Over 23%, AMD Up Over 13%, SanDisk Up Over 6%, NVIDIA Up Over 4%, Amazon Up Over 3%, Meta And Microsoft Up Over 2%, And Google Up Over 1%
The Dow Jones Industrial Average Closed Down 79.61 Points, Or 0.16%, At 49,230.71 On Friday, April 24; The S&P 500 Rose 56.68 Points, Or 0.80%, To 7,165.08 On Friday, April 24; And The Nasdaq Composite Rose 398.09 Points, Or 1.63%, To 24,836.60 On Friday, April 24
According To The U.S. Commodity Futures Trading Commission (CFTC), As Of The Week Ending April 21, Speculative Net Long Positions In COMEX Copper Futures Increased By 6,995 Contracts To 59,132 Contracts
According To The U.S. Commodity Futures Trading Commission (CFTC), As Of The Week Ending April 21, Speculative Net Long Positions In COMEX Silver Futures Decreased By 2,184 Contracts To 8,863 Contracts
According To The U.S. Commodity Futures Trading Commission (CFTC), As Of The Week Ending April 21, Speculative Net Long Positions In COMEX Gold Futures Decreased By 3,354 Contracts To 95,498 Contracts
According To The U.S. Commodity Futures Trading Commission (CFTC), As Of The Week Ending April 21, Net Short Positions In Natural Gas Futures On The NYMEX And ICE Markets Increased By 9,557 Contracts To 22,734 Contracts
According To The U.S. Commodity Futures Trading Commission (CFTC), As Of The Week Ending April 21, Speculative Net Long Positions In WTI Crude Oil Futures Increased By 5,332 Contracts To 111,915 Contracts
According To Saudi Arabia's Al-Hadath TV: Pakistan Will Work With Iranian Foreign Minister Araghchi In The Next Few Hours To Prioritize Resolving The Hormuz Crisis
According To A Reporter From Iranian State Television, Iranian Foreign Minister Arazi Arazi Has Not Scheduled A Meeting With The United States In Islamabad, But Pakistan Can Convey Iran's Concern About Ending The Conflict
United Nations Welcomes Three-Week Extension Of Lebanon-Israel Ceasefire, Urges All Sides To Fully Adhere To Ceasefire Arrangements

U.S. Chicago Fed National Activity Index (Mar)A:--
F: --
U.S. Initial Jobless Claims 4-Week Avg. (SA)A:--
F: --
U.S. Weekly Continued Jobless Claims (SA)A:--
F: --
Canada Industrial Product Price Index YoY (Mar)A:--
F: --
U.S. EIA Weekly Natural Gas Stocks ChangeA:--
F: --
P: --
U.S. Kansas Fed Manufacturing Production Index (Apr)A:--
F: --
P: --
U.S. Kansas Fed Manufacturing Composite Index (Apr)A:--
F: --
P: --
Argentina Retail Sales YoY (Feb)A:--
F: --
P: --
U.S. Weekly Treasuries Held by Foreign Central BanksA:--
F: --
P: --
Japan National CPI MoM (Mar)A:--
F: --
P: --
Japan National Core CPI YoY (Mar)A:--
F: --
P: --
Japan National CPI MoM (Not SA) (Mar)A:--
F: --
P: --
Japan CPI MoM (Mar)A:--
F: --
P: --
Japan National CPI YoY (Mar)A:--
F: --
P: --
U.K. Retail Sales MoM (SA) (Mar)A:--
F: --
P: --
U.K. Retail Sales YoY (SA) (Mar)A:--
F: --
U.K. Core Retail Sales YoY (SA) (Mar)A:--
F: --
Germany Ifo Business Expectations Index (SA) (Apr)A:--
F: --
Germany IFO Business Climate Index (SA) (Apr)A:--
F: --
Germany Ifo Current Business Situation Index (SA) (Apr)A:--
F: --
P: --
Russia Key RateA:--
F: --
P: --
Brazil Current Account (Mar)A:--
F: --
P: --
India Deposit Gowth YoYA:--
F: --
P: --
Mexico Economic Activity Index YoY (Feb)A:--
F: --
P: --
Mexico Unemployment Rate (Not SA) (Mar)A:--
F: --
P: --
Canada Retail Sales MoM (SA) (Feb)A:--
F: --
Canada Core Retail Sales MoM (SA) (Feb)A:--
F: --
Canada Federal Government Budget Balance (Feb)A:--
F: --
P: --
U.S. Weekly Total Rig CountA:--
F: --
P: --
U.S. Weekly Total Oil Rig CountA:--
F: --
P: --
China, Mainland Industrial Profit YoY (YTD) (Mar)--
F: --
P: --
Germany GfK Consumer Confidence Index (SA) (May)--
F: --
P: --
U.K. CBI Distributive Trades (Apr)--
F: --
P: --
U.K. CBI Retail Sales Expectations Index (Apr)--
F: --
P: --
Mexico Trade Balance (Mar)--
F: --
P: --
Canada National Economic Confidence Index--
F: --
P: --
U.S. Dallas Fed General Business Activity Index (Apr)--
F: --
P: --
U.S. Dallas Fed New Orders Index (Apr)--
F: --
P: --
U.S. 5-Year Note Auction Avg. Yield--
F: --
P: --
U.S. 2-Year Note Auction Avg. Yield--
F: --
P: --
U.K. BRC Shop Price Index YoY (Apr)--
F: --
P: --
Japan Unemployment Rate (Mar)--
F: --
P: --
Japan Jobs to Applicants Ratio (Mar)--
F: --
P: --
Japan Benchmark Interest Rate--
F: --
P: --
BOJ Monetary Policy Statement
BOJ Press Conference
Italy PPI YoY (Mar)--
F: --
P: --
France Unemployment Class-A (Mar)--
F: --
P: --
India Industrial Production Index YoY (Mar)--
F: --
P: --
India Manufacturing Output MoM (Mar)--
F: --
P: --
U.S. Weekly Redbook Index YoY--
F: --
P: --
U.S. S&P/CS 20-City Home Price Index MoM (Not SA) (Feb)--
F: --
P: --
U.S. S&P/CS 20-City Home Price Index (Not SA) (Feb)--
F: --
P: --
U.S. S&P/CS 20-City Home Price Index YoY (Not SA) (Feb)--
F: --
P: --
U.S. S&P/CS 20-City Home Price Index MoM (SA) (Feb)--
F: --
P: --
U.S. FHFA House Price Index MoM (Feb)--
F: --
P: --
U.S. FHFA House Price Index YoY (Feb)--
F: --
P: --
U.S. S&P/CS 10-City Home Price Index MoM (Not SA) (Feb)--
F: --
P: --
U.S. S&P/CS 10-City Home Price Index YoY (Feb)--
F: --
P: --


No matching data
Dip buyers support WTI near $63 as inventories fall and trend support holds, with traders watching whether oil can regain momentum toward $66.

Oil prices fell by about 2% after new diplomatic efforts helped ease supply concerns linked to tensions in a major energy-producing area. This drop came after a 3% jump the previous day, when uncertainty over upcoming talks had pushed prices higher.
Analysts say that although recent talks have lowered the risk of immediate disruptions, ongoing disagreements could quickly bring back price swings. About 20% of the world's oil travels through key shipping routes, so markets remain sensitive to any rise in tensions.
Recent inventory data showed that US crude stocks dropped last week, which tightened supply even as overall risk concerns in energy markets eased.
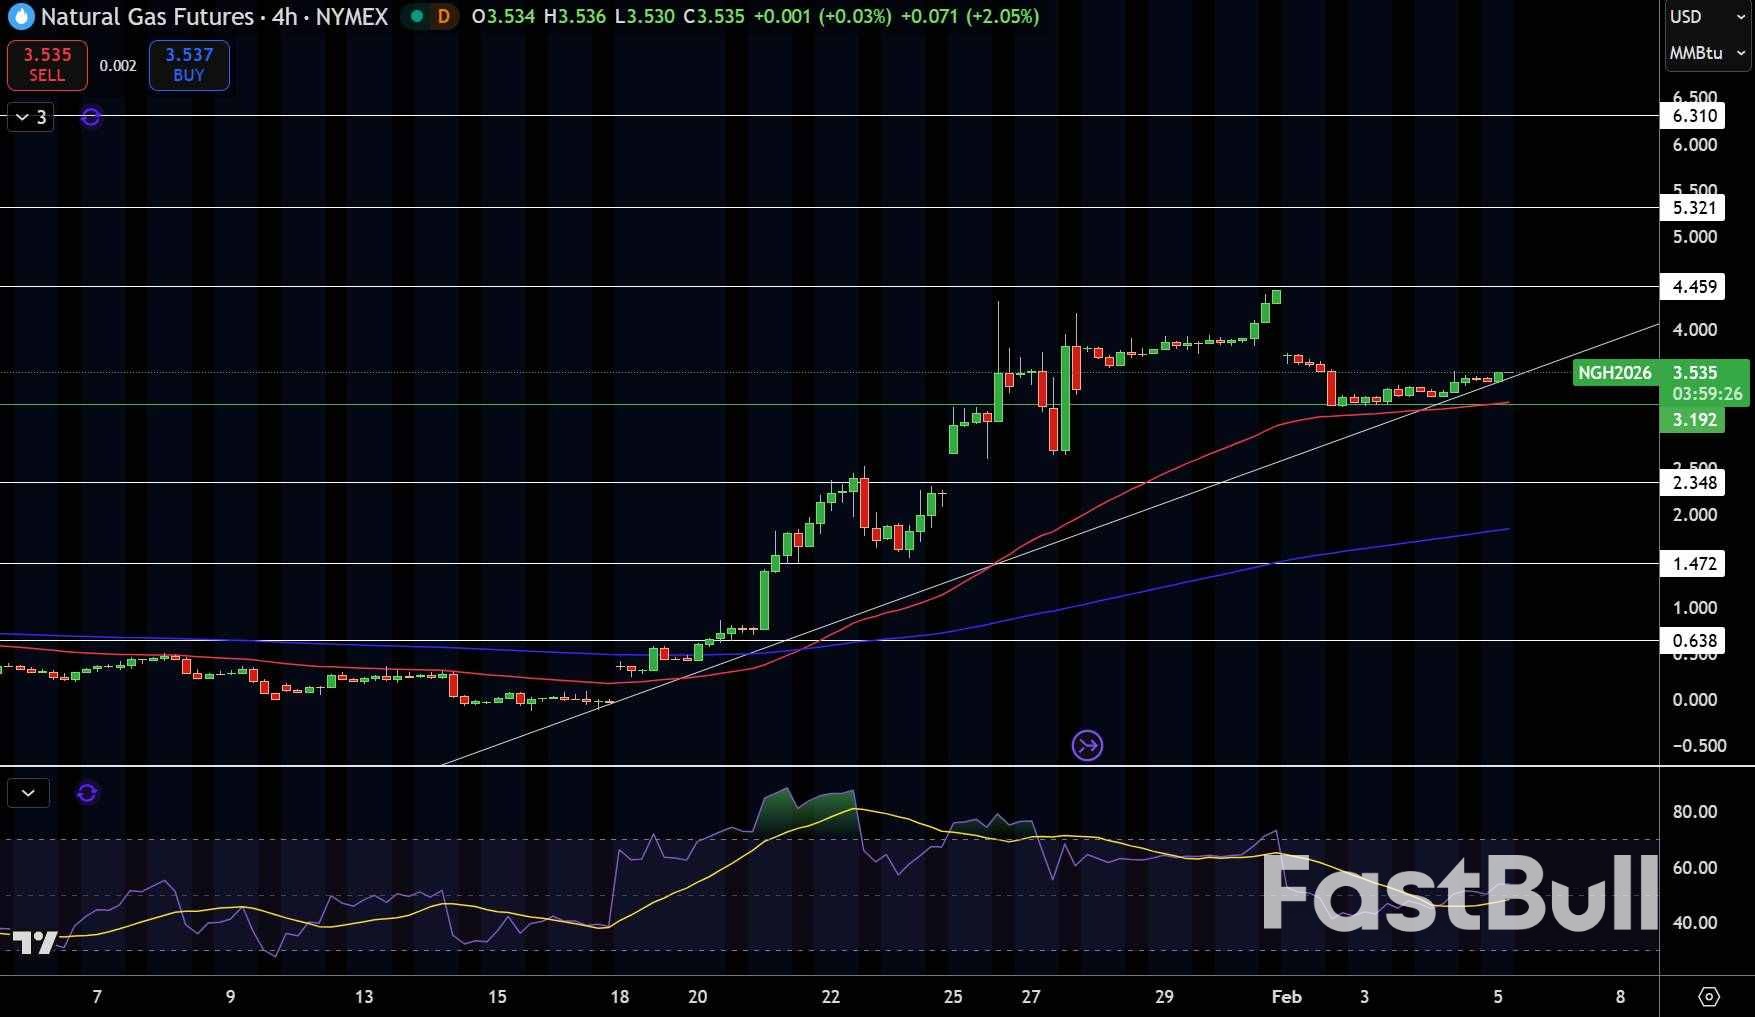
Natural Gas (NG) Price ChartNatural gas futures are trading around $3.53 after a strong rally and a pullback. The 4-hour chart shows candles with small bodies above $3.20, which suggests the market is consolidating instead of selling off.
The price is still above the rising trendline from mid-January and above the 50-EMA near $3.30, which keeps the short-term outlook positive.
The 200-EMA at about $2.60 is still moving higher, supporting the overall bullish trend. Resistance is near $3.75 and then $4.45, where sellers have stepped in before.
Support is at $3.20 and $3.00, which matches the base of the channel. The RSI has bounced back to about 55, showing momentum is recovering but not overbought.
Trade idea: Consider buying on dips near $3.25, aiming for $3.75, and set a stop below $3.00.
WTI Price Chart
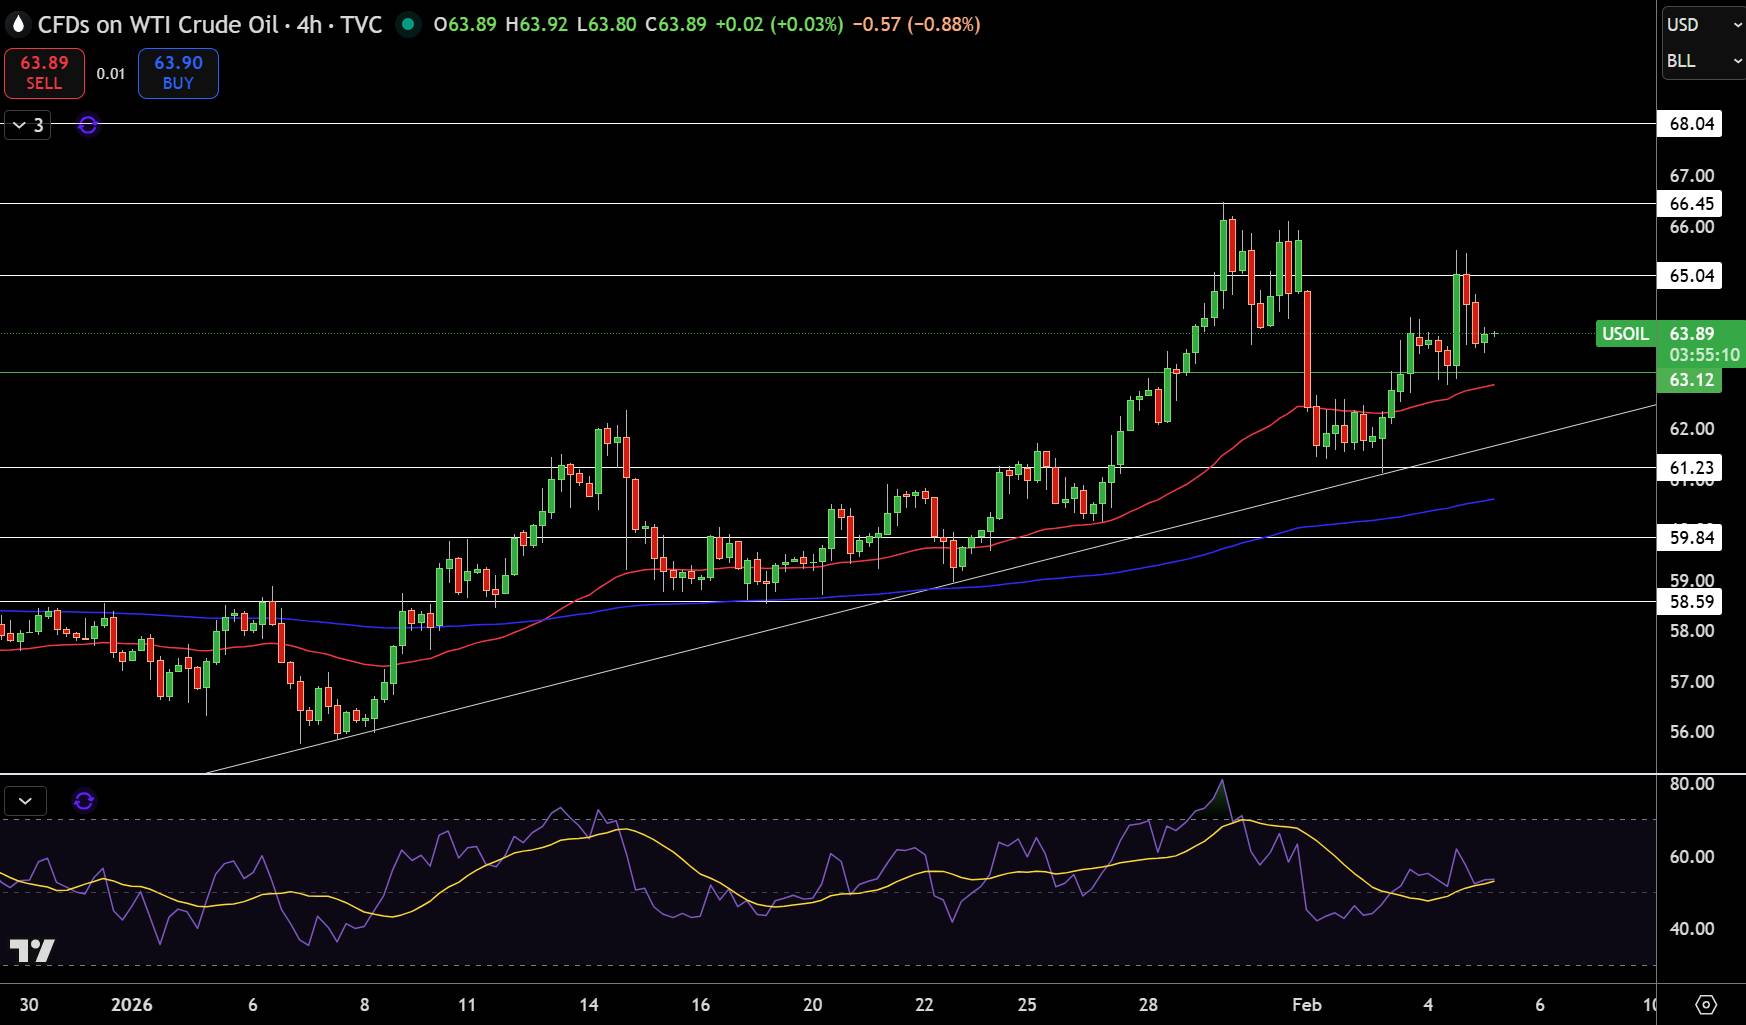
WTI crude oil is trading around $63.90 after a strong rally that nearly reached $66.40. The 4-hour chart shows candles with long wicks and small bodies, which suggests the market is pausing instead of selling off sharply.
The price is still above the rising trendline from early January and above the 50-EMA near $63.10, which keeps the overall outlook positive. The 200-EMA at about $60.80 is also moving higher, adding more support to the trend.
Resistance is between $65.00 and $66.40, while support is first at $63.10 and then at $61.20. The RSI has dropped to the mid-50s, showing that momentum is now more balanced after being overbought.
Trade idea: Consider buying on dips near $63.10, aiming for $65.80, and set a stop below $61.20.
Brent Price Chart
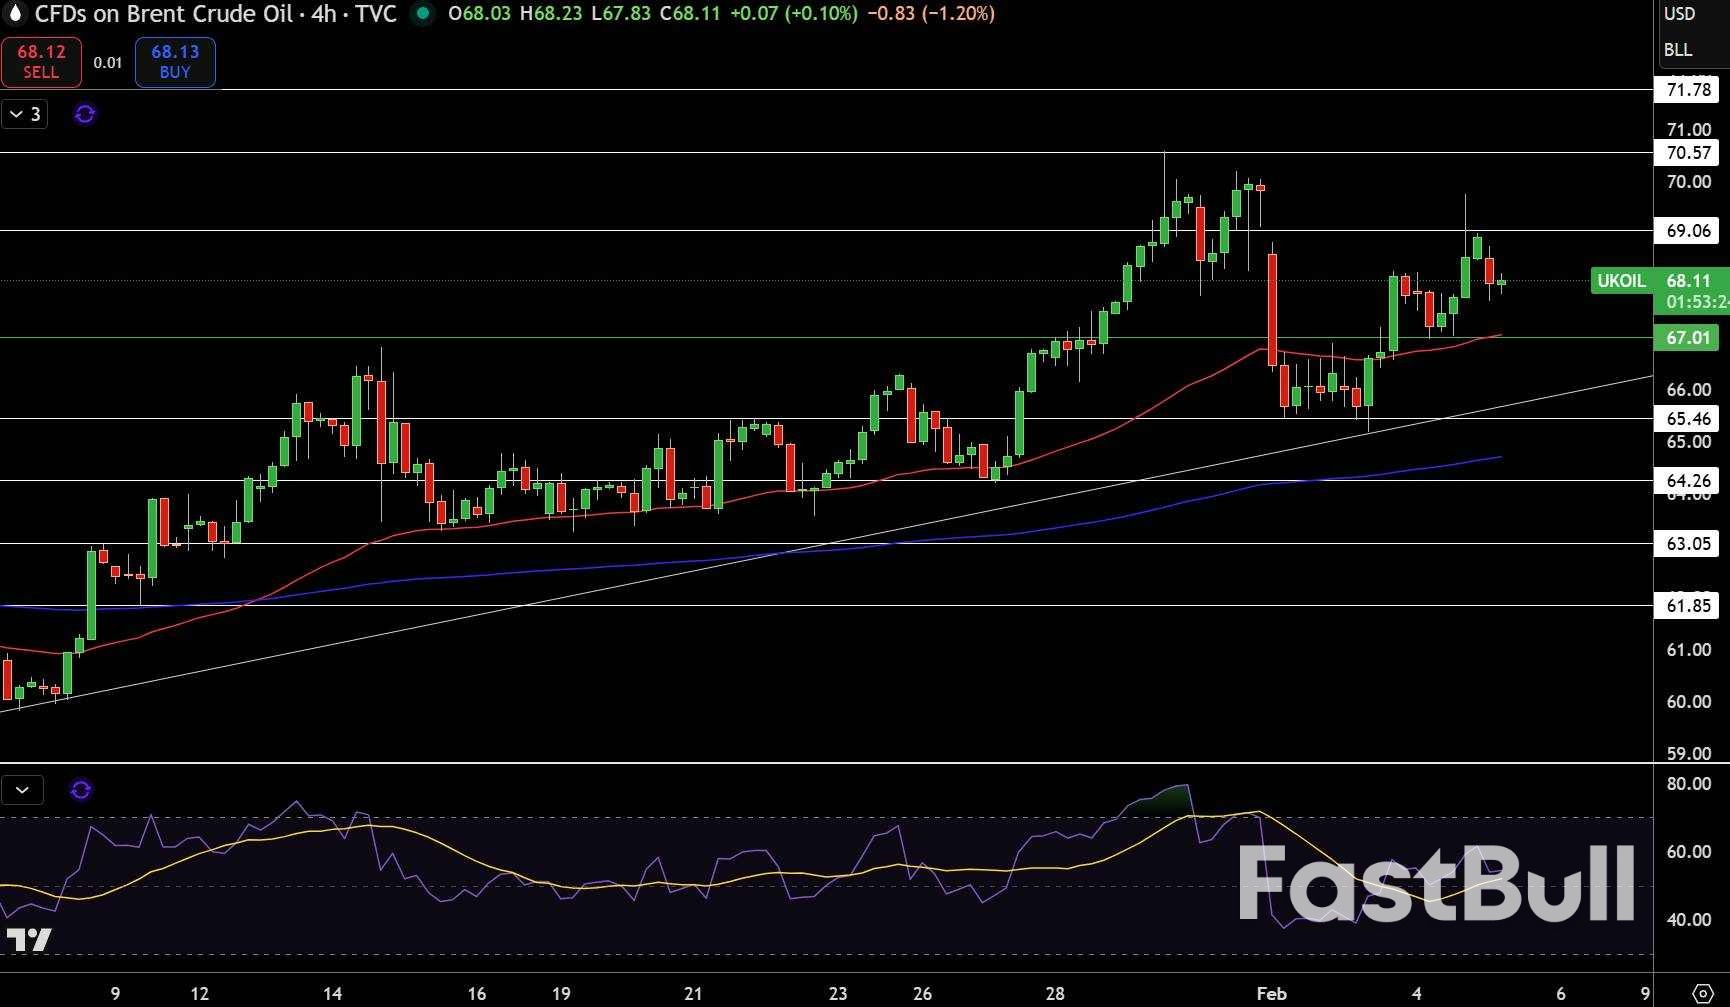
Brent crude oil is trading around $68.10 after pulling back from a recent high near $70.60. The 4-hour chart shows candles with long lower wicks near $67.00, which points to buyers stepping in rather than heavy selling.
The price is still above the rising trendline from early January and above the 50-EMA near $67.00, which keeps the short-term outlook positive. The 200-EMA at about $64.80 is also moving higher, supporting the overall uptrend.
Resistance is grouped around $69.10 and $70.60, while support is at $67.00 and $65.50. The RSI has moved back to the mid-50s, showing that momentum is steady after cooling off.
Trade idea: Look to buy near $67.00, target $69.80, and place a stop below $65.50.
The risk of loss in trading financial instruments such as stocks, FX, commodities, futures, bonds, ETFs and crypto can be substantial. You may sustain a total loss of the funds that you deposit with your broker. Therefore, you should carefully consider whether such trading is suitable for you in light of your circumstances and financial resources.
No decision to invest should be made without thoroughly conducting due diligence by yourself or consulting with your financial advisors. Our web content might not suit you since we don't know your financial conditions and investment needs. Our financial information might have latency or contain inaccuracy, so you should be fully responsible for any of your trading and investment decisions. The company will not be responsible for your capital loss.
Without getting permission from the website, you are not allowed to copy the website's graphics, texts, or trademarks. Intellectual property rights in the content or data incorporated into this website belong to its providers and exchange merchants.
Not Logged In
Log in to access more features
Log In
Sign Up