


Markets
Analysis
User
24/7
Economic Calendar
Education
Data
- Names
- Latest
- Prev


The oft-cited Wyckoff pattern suggests that Bitcoin price could be headed toward $86,000 next, especially if BTC fails to hold $94,000, which is the average cost basis of 6 to 12-month Bitcoin holders.
Bitcoin's drop below $100,000 comes as a Wyckoff Distribution pattern points to a potential decline toward $86,000.
Some analysts remain optimistic, arguing that the bull market will hold as long as the $94,000 support level remains intact.
Bitcoin (BTC) has just slipped under the key $100,000 support level, driven by hawkish Federal Reserve prospects and persistent whale selling.
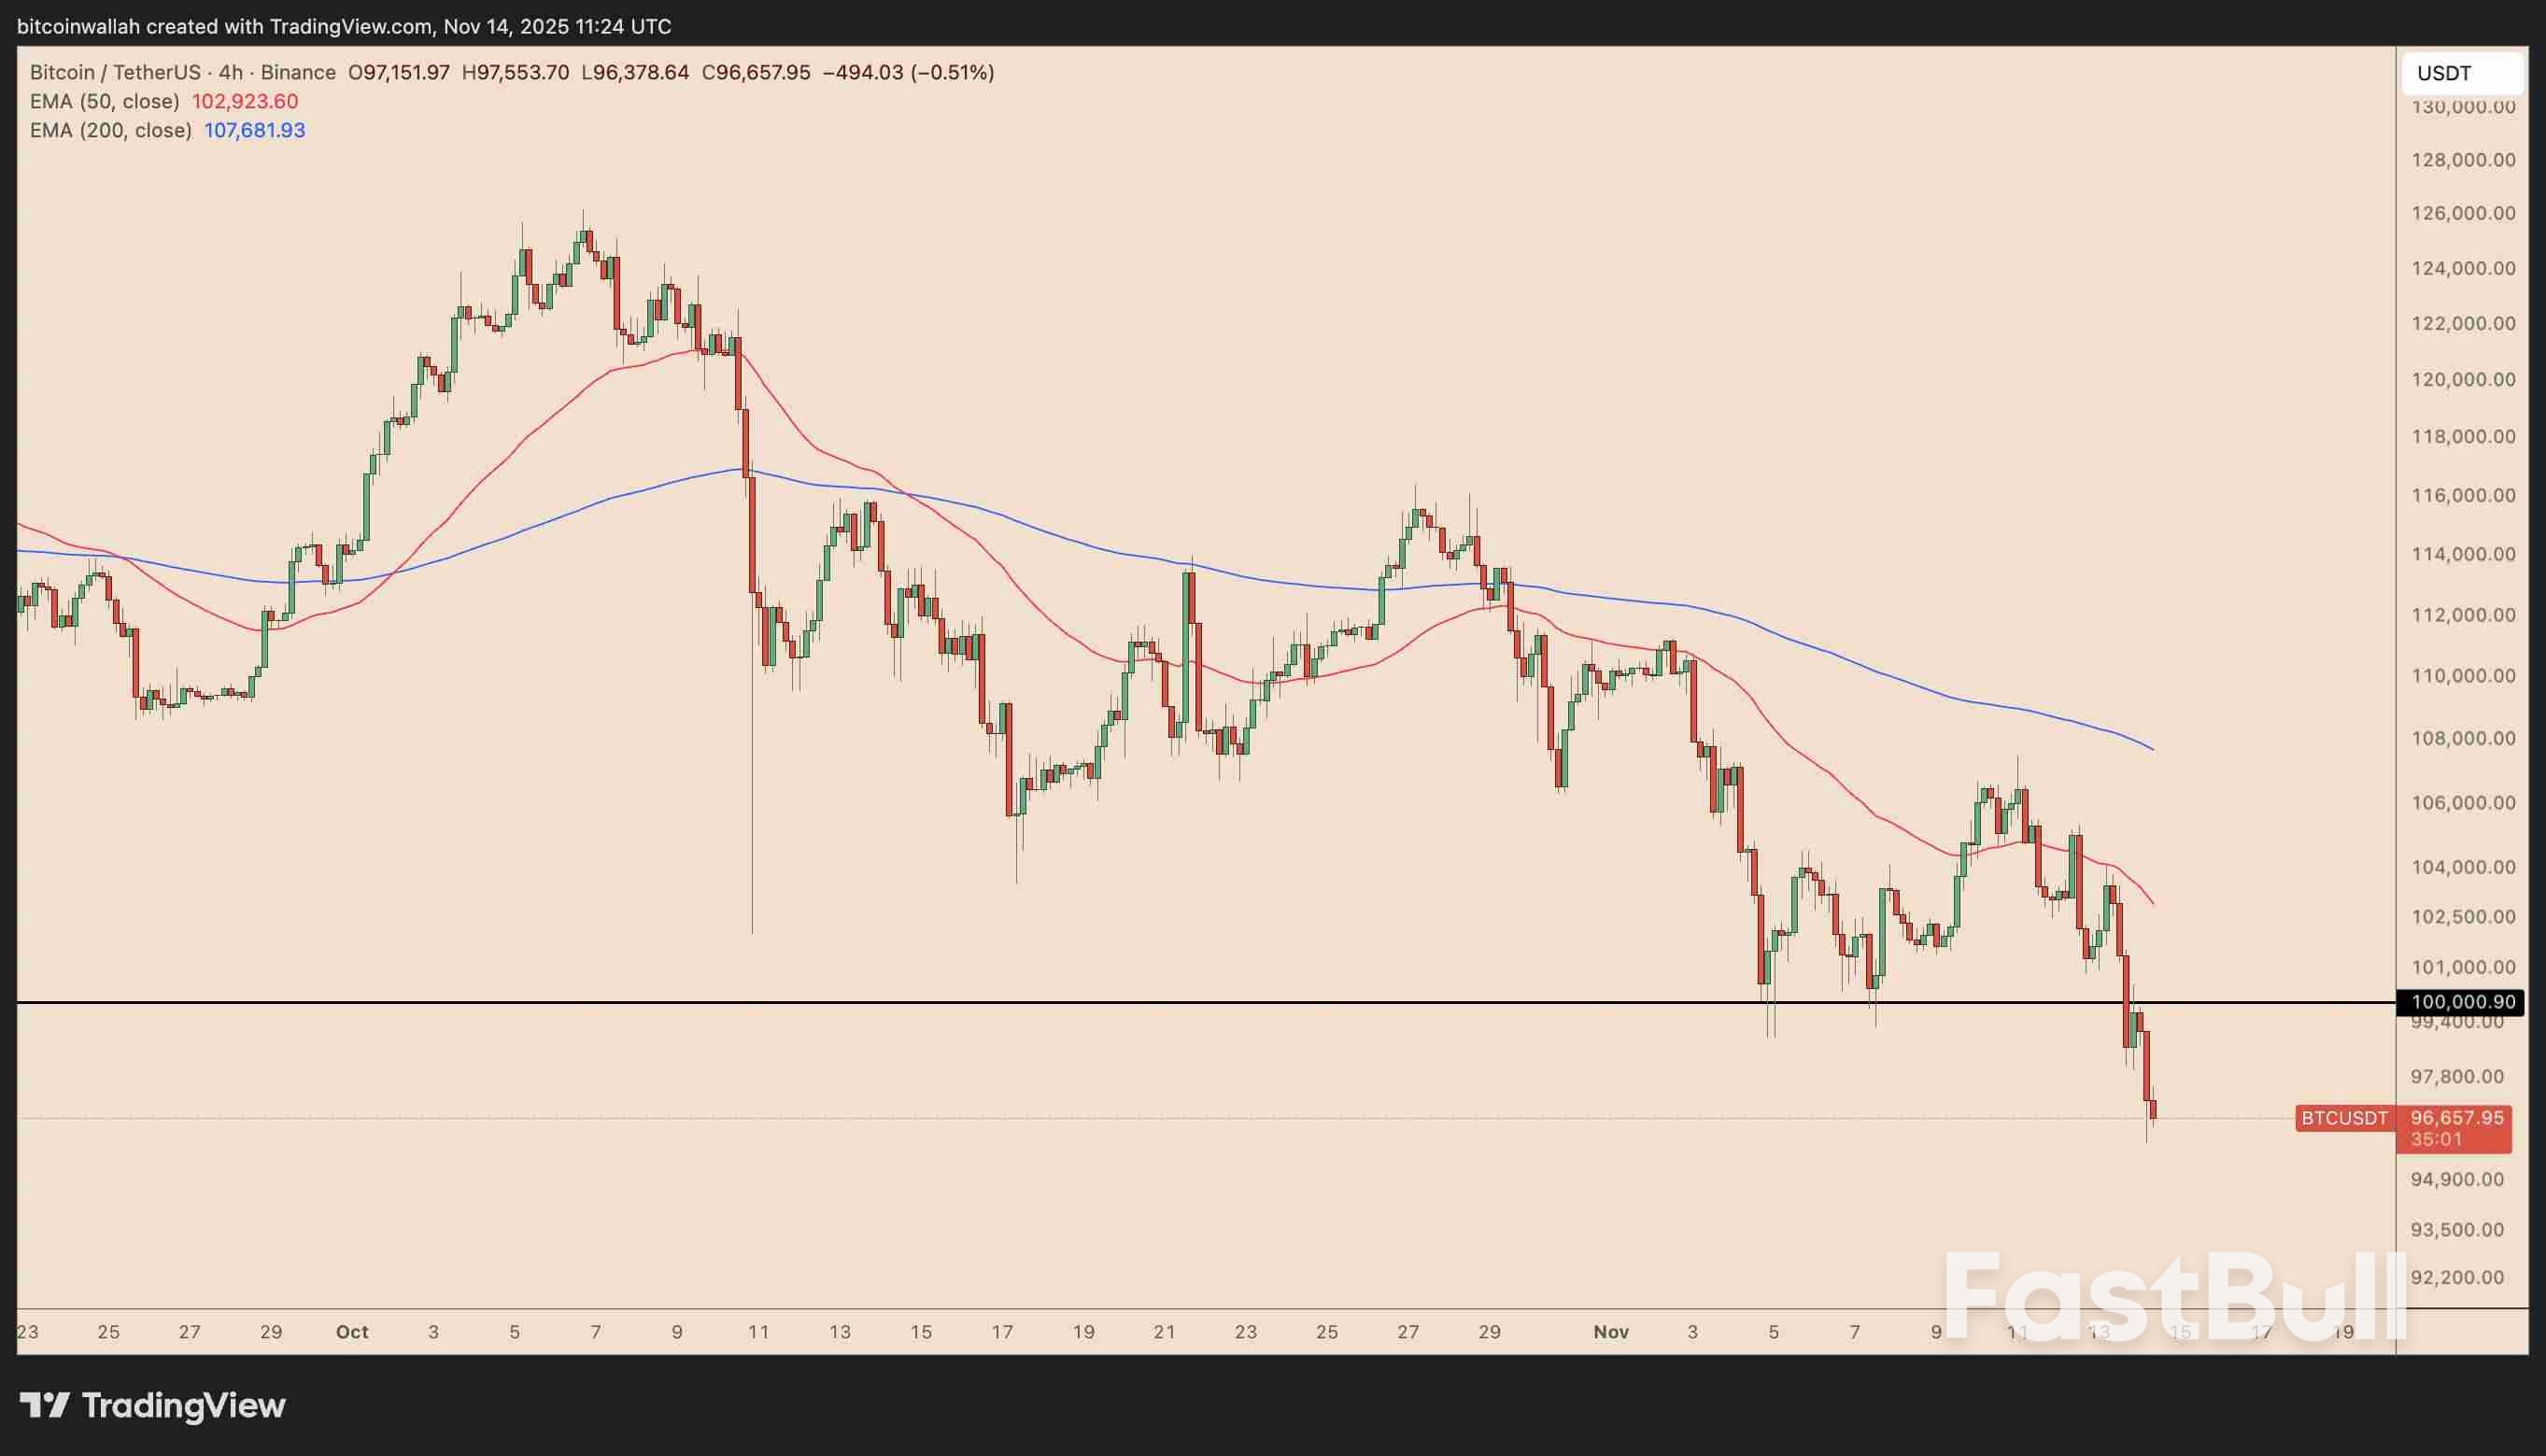 BTC/USDT four-hour chart. Source: TradingView
Now, a classic technical breakdown setup is strengthening the case for prolonged selling in the Bitcoin market.
Wyckoff distribution model warns of BTC price drop to $86,000
The schematic, highlighted by analyst @follis_ on X, shows Bitcoin's recent structure tracking the classic five-phase Wyckoff Distribution, a pattern often seen near macro market tops, as shown below.
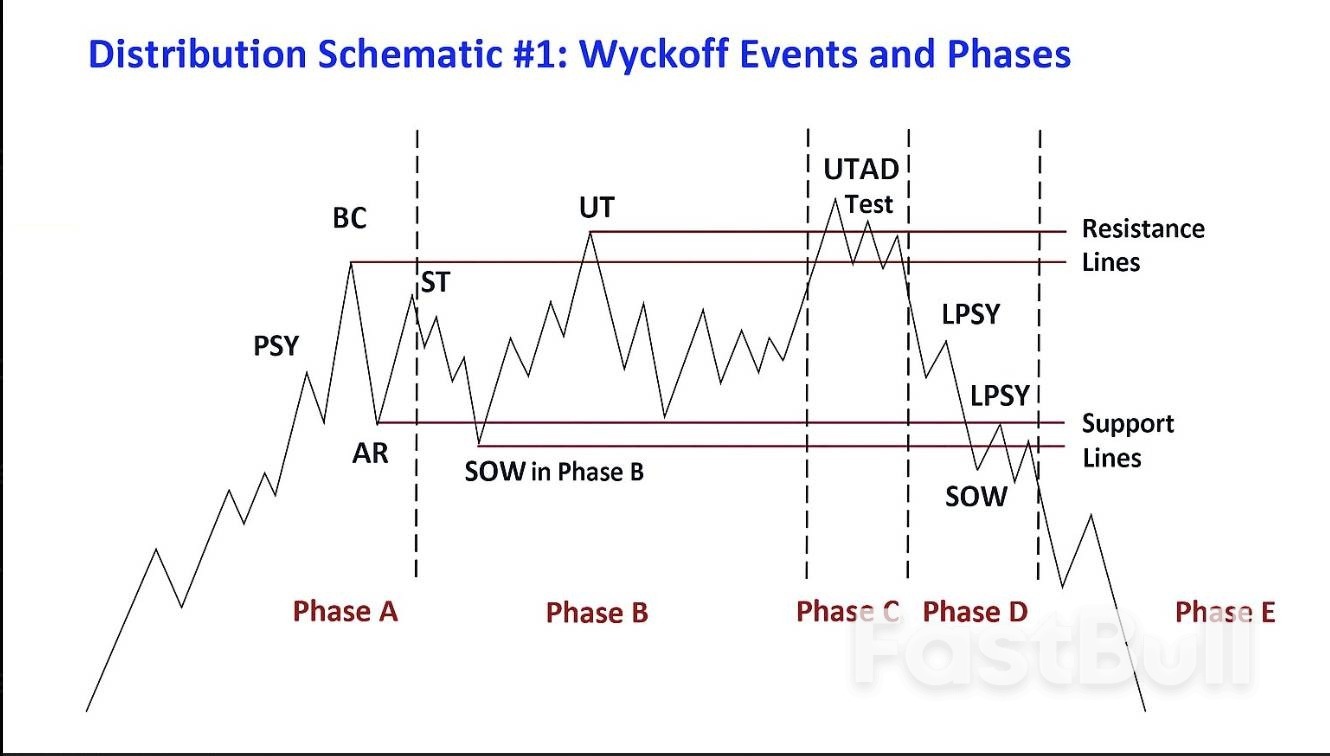 Wyckoff distribution schematic illustration
The alignment is strong enough that the Bitcoin bull market "might actually be over," @follis_ said.
BTC's surge above $122,000 marked the Buying Climax (BC), followed by an Automatic Reaction (AR) and Secondary Tests (ST) that failed to create higher highs.
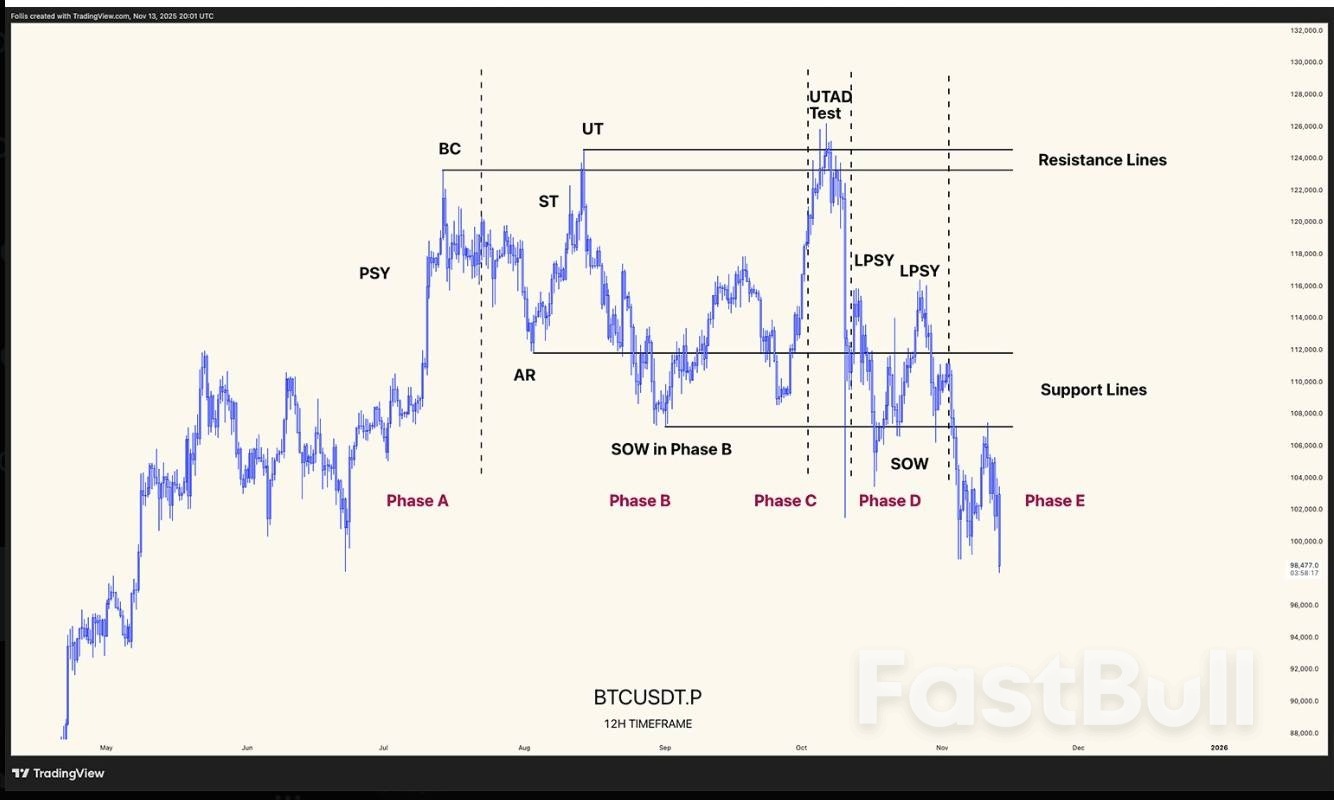 BTC/USDT daily chart. Source: TradingView/follis_
The early-October push toward $126,200 resembled an Upthrust After Distribution (UTAD), a final bullish deviation that signals demand exhaustion.
From there, Bitcoin printed multiple Last Points of Supply (LPSY) and lost mid-range support near $110,000, confirming Phase D.
It dropped below the AR/SOW zone at $102,000–$104,000, then shifted BTC into Phase E, the markdown phase, accelerating the decline. By Friday, BTC had dropped below $95,000 on Binance.
Based on Wyckoff's measured-move method, the $122,000–$104,000 distribution band implies an $18,000 downside projection, i.e., $86,000 as the primary target.
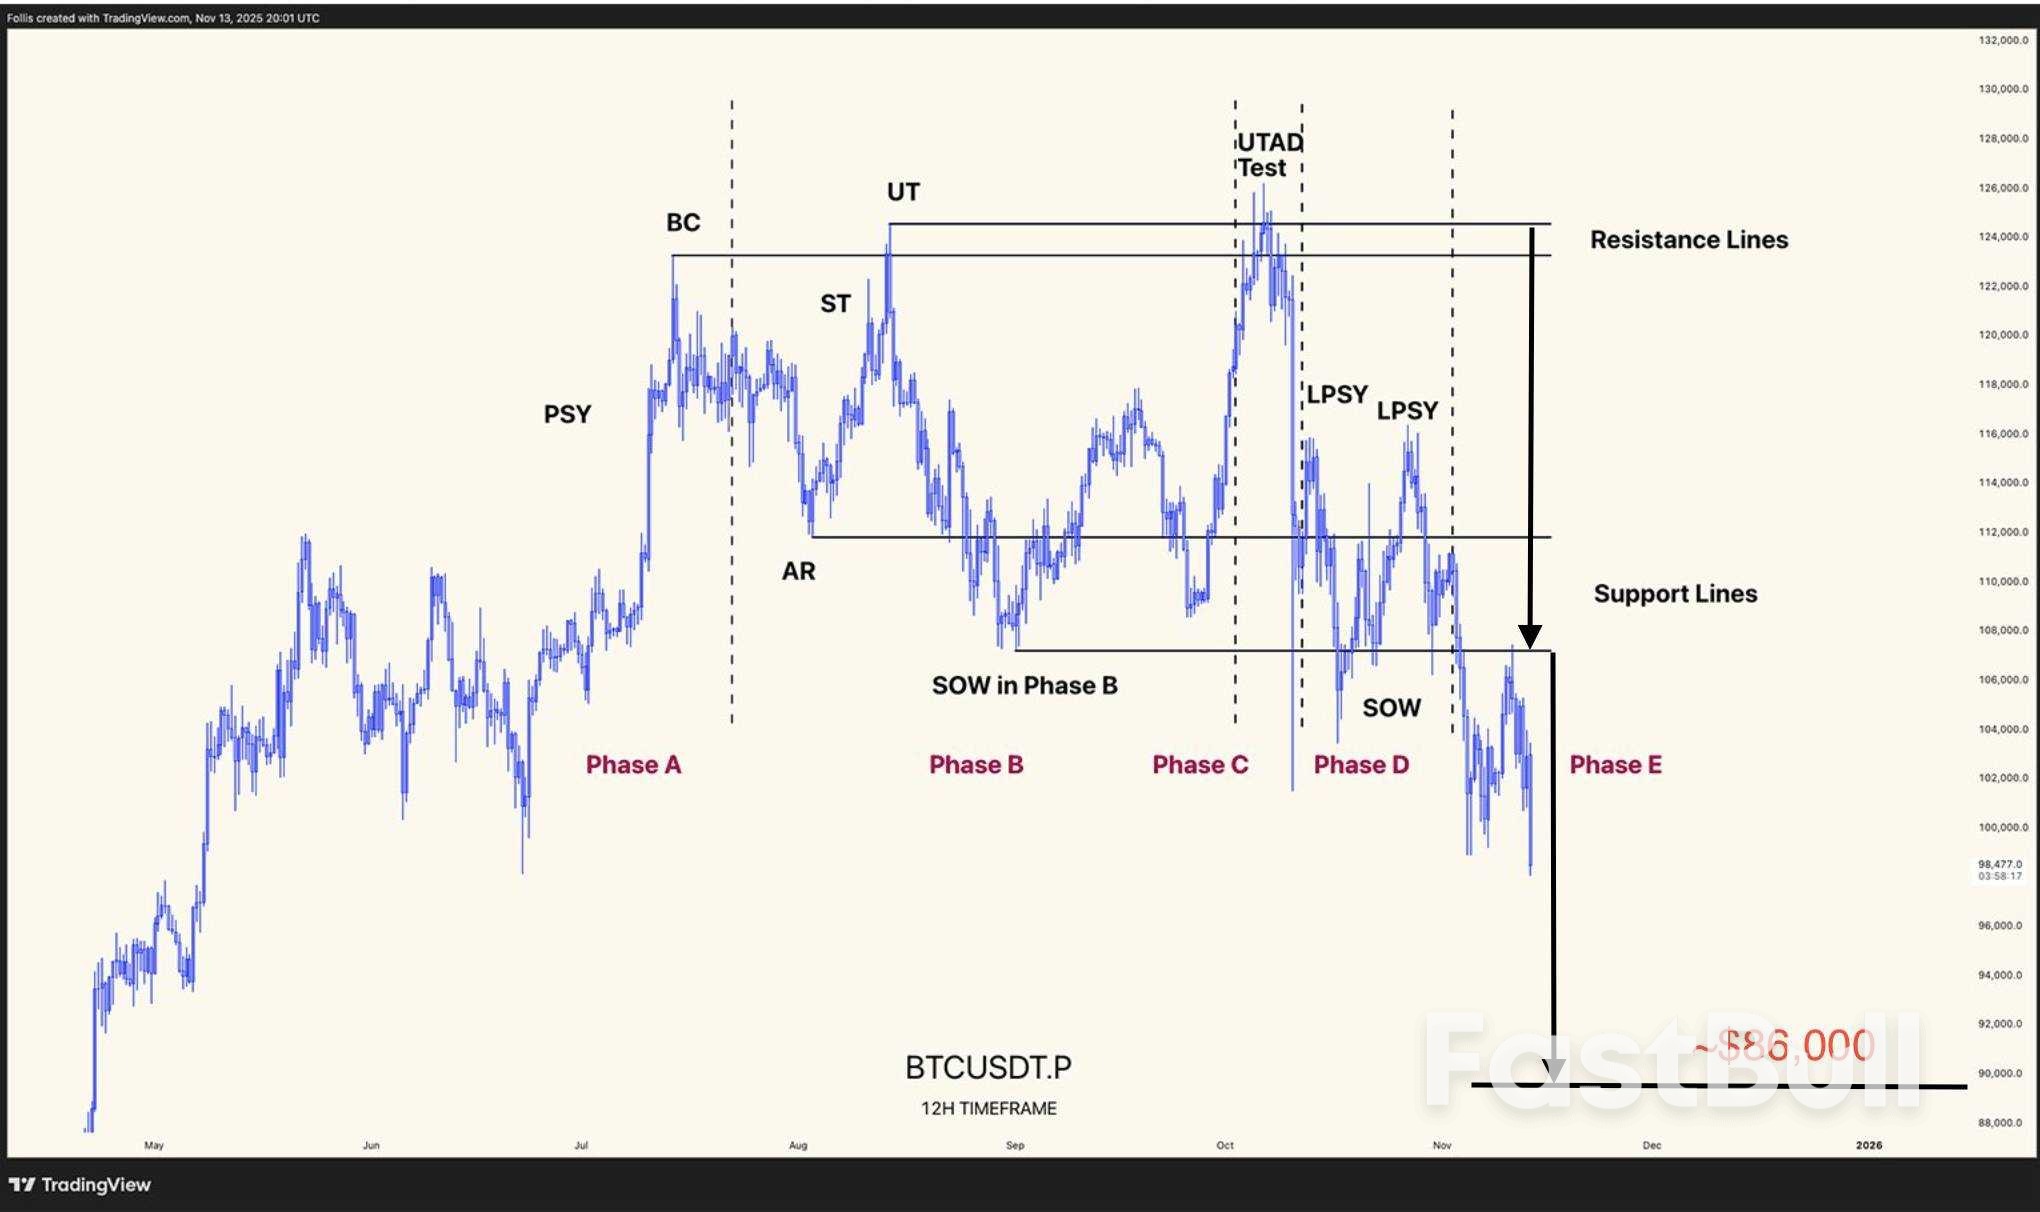 BTC/USDT daily chart. Source: TradingView/follis_
The bearish shift occurred as global risk appetite deteriorated, driven by fears that the Federal Reserve would not cut interest rates in December.
The US government shutdown, which ended on Thursday, restricted access to key economic data, making policymakers less confident about easing monetary policy. That uncertainty rippled through risk assets, hurting Bitcoin alongside US stocks.
Bitcoin's broader uptrend remains intact unless the price falls below the key $94,000 level, the average cost basis of six- to 12-month holders, according to CryptoQuant CEO Ki Young Ju.
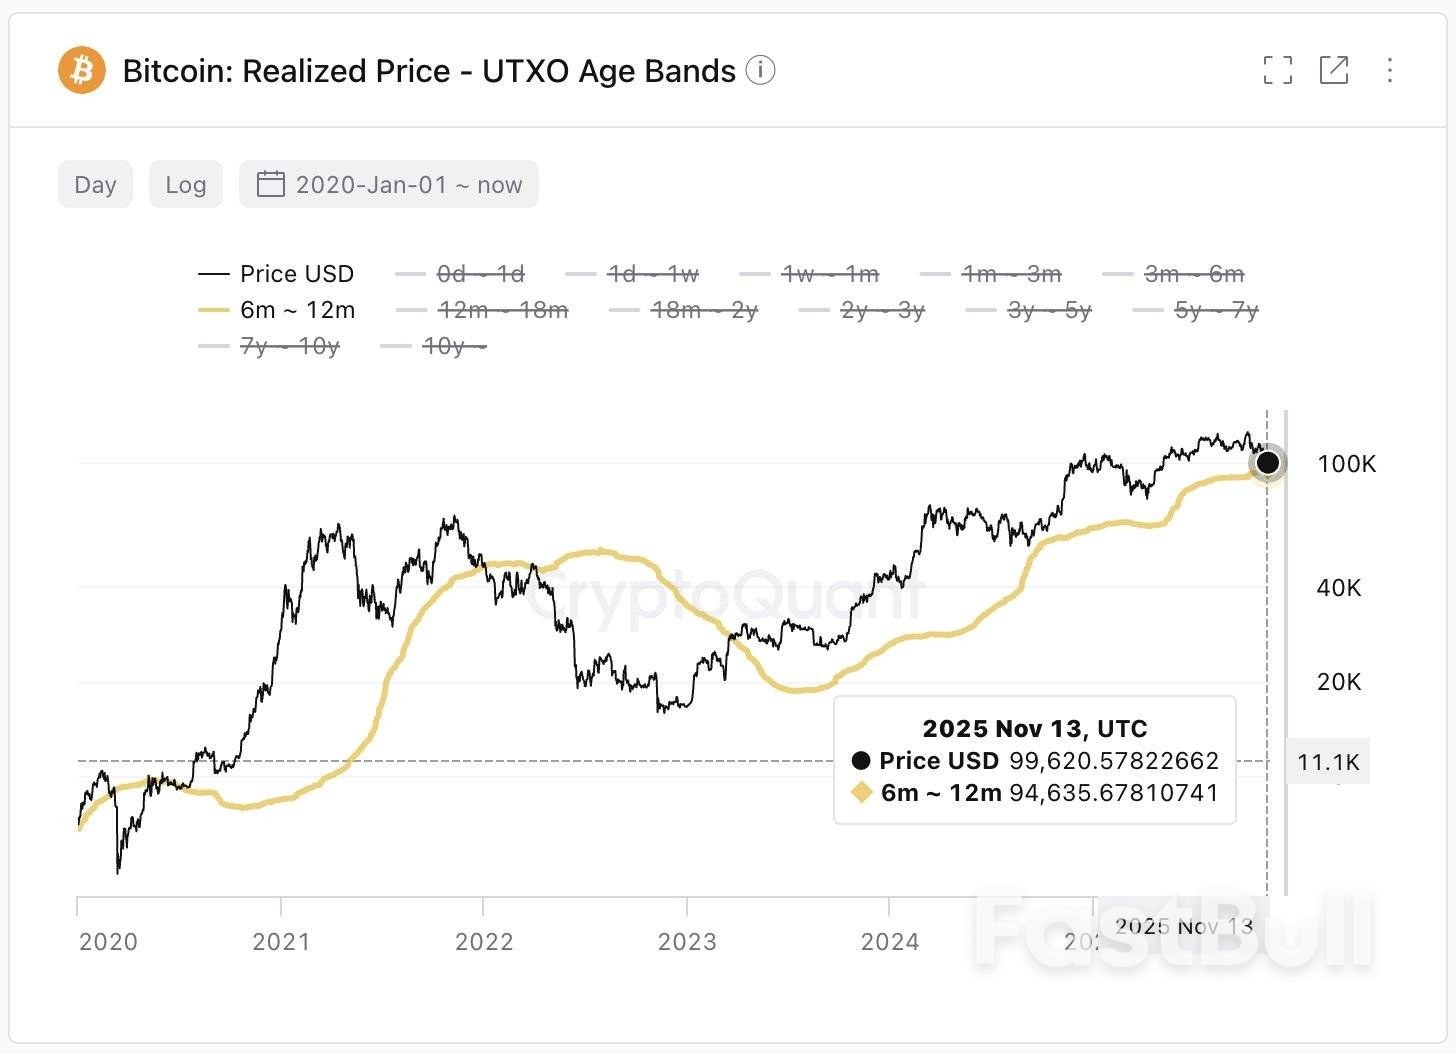 Bitcoin realized price UTXO band chart. Source: CryptoQuant
Bitwise CEO Hunter Horsley said Bitcoin "may have been in a bear market for almost six months" and is now nearing the end of it, adding that "the setup for crypto right now has never been stronger."
728 RM B 7/F GEE LOK IND BLDG NO 34 HUNG TO RD KWUN TONG KLN HONG KONG


The risk of loss in trading financial instruments such as stocks, FX, commodities, futures, bonds, ETFs and crypto can be substantial. You may sustain a total loss of the funds that you deposit with your broker. Therefore, you should carefully consider whether such trading is suitable for you in light of your circumstances and financial resources.
No decision to invest should be made without thoroughly conducting due diligence by yourself or consulting with your financial advisors. Our web content might not suit you since we don't know your financial conditions and investment needs. Our financial information might have latency or contain inaccuracy, so you should be fully responsible for any of your trading and investment decisions. The company will not be responsible for your capital loss.
Without getting permission from the website, you are not allowed to copy the website's graphics, texts, or trademarks. Intellectual property rights in the content or data incorporated into this website belong to its providers and exchange merchants.
Not Logged In
Log in to access more features


Log In
Sign Up


