


- EURUSD
- XAUUSD
- XAGUSD
- WTI
- USDX


Markets
Analysis
User
24/7
Economic Calendar
Education
Data
- Names
- Latest
- Prev


India's record gold and silver imports in 2025, driven by surging investment demand, exacerbate economic strain and pose policy dilemmas.
India's gold and silver imports soared to record levels in 2025, raising serious concerns among policymakers. Despite sky-high prices, the nation's demand for precious metals has proven resilient, leaving the government with few effective tools to manage the inflows.
In 2025, the country's gold imports climbed 1.6% year-over-year to $58.9 billion. Silver imports saw an even more dramatic increase, jumping 44% to $9.2 billion, even as both metals traded at record highs.
India ranks as the world's second-largest gold consumer and the biggest market for silver. The nation relies almost entirely on imports to meet its gold demand and sources over 80% of its silver from overseas.
This heavy reliance has significant economic consequences. Last year, gold and silver imports consumed nearly a tenth of the country's total foreign exchange reserves. With prices projected to rise further in 2026, this import bill is expected to grow, widening the trade deficit and putting sustained pressure on the rupee, which fell to a record low this month.
While silver has industrial applications in sectors like solar power and electronics, gold is primarily used for jewelry and investment. The government considers this demand non-essential and has historically tried to curb it by raising import duties to make purchases more expensive.
The combination of record prices and strong import volumes is fueling speculation about another government intervention. A rising import bill threatens to further expand the trade deficit and weaken the rupee, which has already lost ground against the dollar.
Trade and industry officials believe these pressures could prompt the government to raise import duties on both gold and silver in the coming weeks. This would be a reversal of the 2024 policy, which cut duties on both metals from 15% to 6% in an effort to curb smuggling. The government previously hiked gold duties sharply in 2012 and 2013 to stabilize a rapidly depreciating rupee, setting a precedent for the current situation.
Anticipating a potential tax increase, both gold and silver are already trading at a premium to global benchmarks in the domestic market.
Historically, jewelry sales accounted for over three-quarters of India's gold consumption. However, international gold prices have surged 98% since the beginning of 2025, which has cooled demand for jewelry.
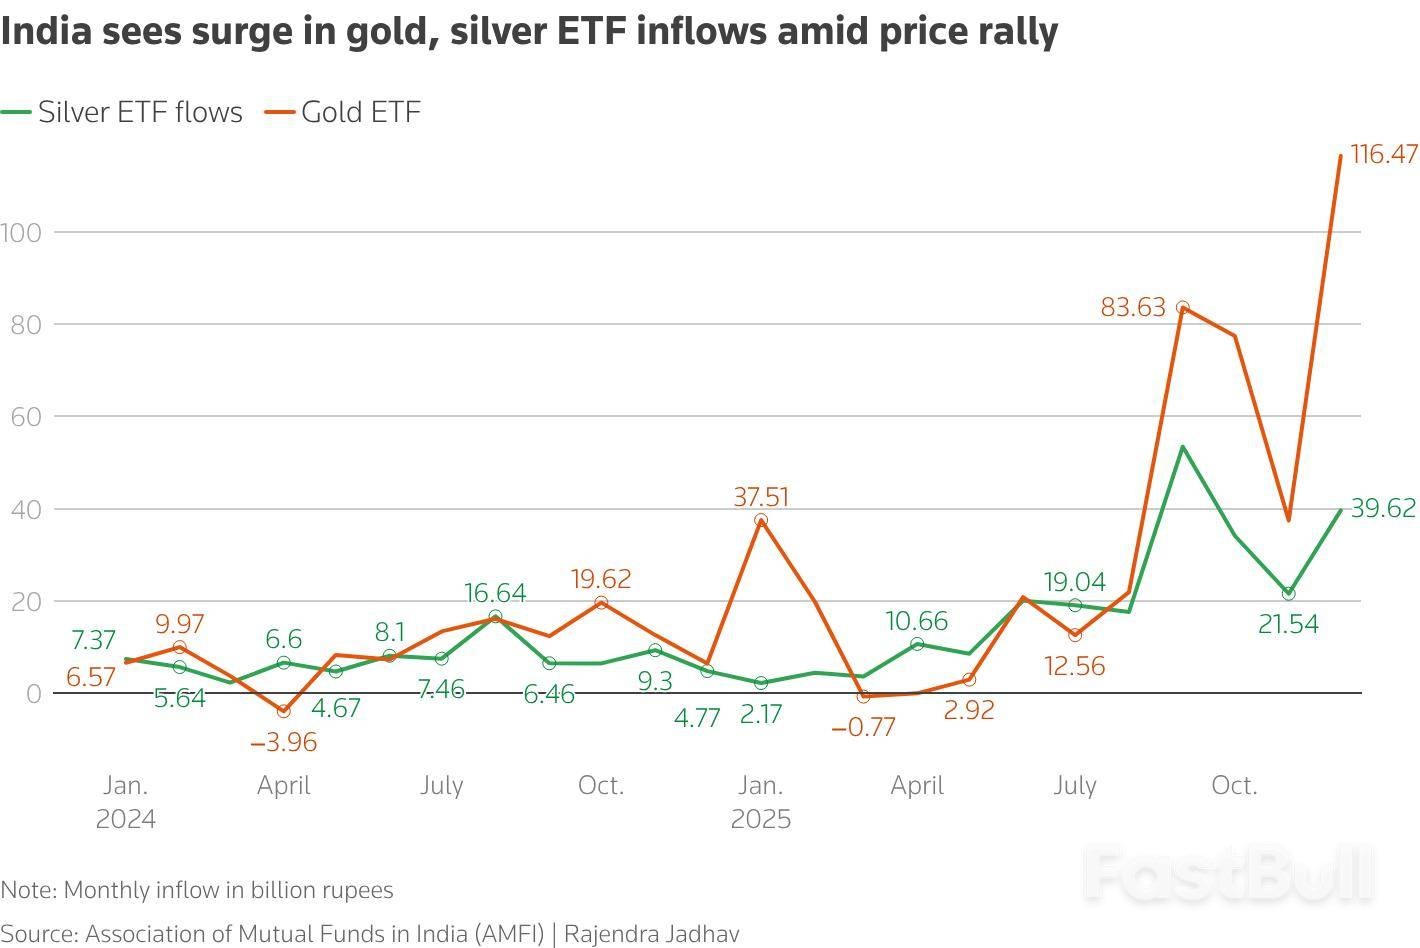
Despite this, overall demand has not fallen. Instead, there has been a significant shift toward investment. Indians are increasingly purchasing physical gold in the form of coins and bars. At the same time, exchange-traded funds (ETFs) backed by physical gold and silver have gained massive popularity.
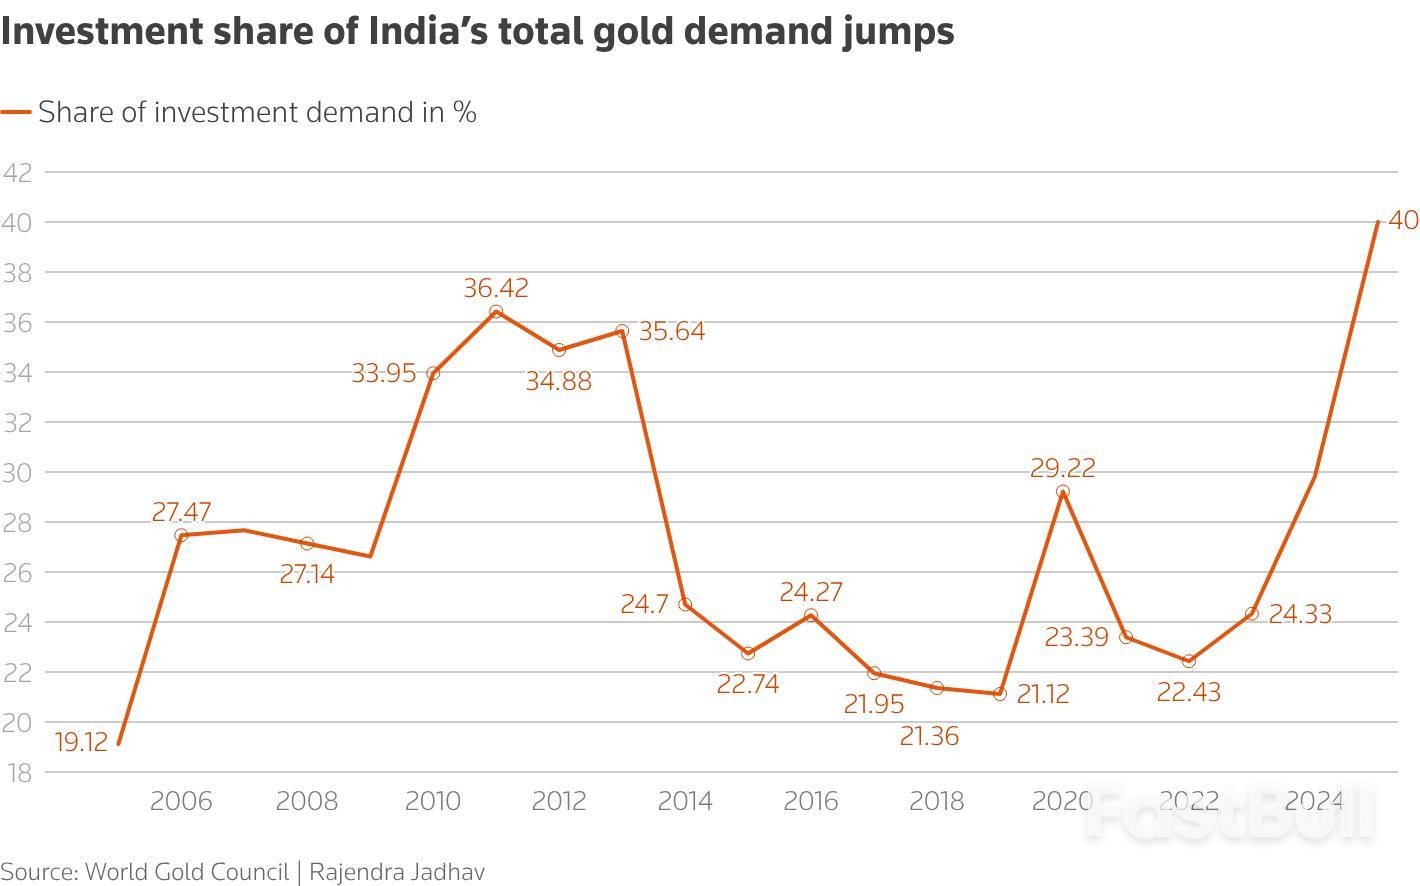
In 2025, inflows into gold ETFs jumped 283% from the previous year to a record 429.6 billion rupees ($4.69 billion). This structural shift pushed the investment share of total gold consumption above 40% in 2025, a trend expected to continue in 2026.
India has a long history of attempting to curb gold imports with higher duties, but these measures have had limited success. For example, when the government raised the import tax from 2% to 10% in August 2013, demand remained steady.
Domestic gold prices have skyrocketed from around 8,000 rupees per 10 grams in early 2006 to approximately 162,000 rupees today. Even a 76.5% price jump in 2025 failed to deter buyers. Consequently, another duty hike of 4 to 6 percentage points is unlikely to significantly reduce demand.
Instead, higher duties could inadvertently boost investor returns and encourage smuggling. With weak returns in the equity market, bullion remains an attractive asset, and inflows into gold ETFs are expected to stay strong. Furthermore, any sharp drop in gold prices could weaken investment demand but would likely trigger a rebound in jewelry sales from buyers awaiting a market correction.
Silver imports are also becoming a major concern. Silver prices have risen even faster than gold, inflating India's import bill. While industrial consumption was the primary driver of silver demand until last year, investment demand has recently become a major supporting factor.
In 2025, silver ETFs attracted inflows of 234.7 billion rupees, a substantial increase from 85.69 billion rupees the previous year. The growing popularity of these investment vehicles suggests that silver imports for investment purposes will continue to rise if the current price rally persists.
728 RM B 7/F GEE LOK IND BLDG NO 34 HUNG TO RD KWUN TONG KLN HONG KONG


The risk of loss in trading financial instruments such as stocks, FX, commodities, futures, bonds, ETFs and crypto can be substantial. You may sustain a total loss of the funds that you deposit with your broker. Therefore, you should carefully consider whether such trading is suitable for you in light of your circumstances and financial resources.
No decision to invest should be made without thoroughly conducting due diligence by yourself or consulting with your financial advisors. Our web content might not suit you since we don't know your financial conditions and investment needs. Our financial information might have latency or contain inaccuracy, so you should be fully responsible for any of your trading and investment decisions. The company will not be responsible for your capital loss.
Without getting permission from the website, you are not allowed to copy the website's graphics, texts, or trademarks. Intellectual property rights in the content or data incorporated into this website belong to its providers and exchange merchants.
Not Logged In
Log in to access more features


Log In
Sign Up


