Markets
Analysis
User
24/7
Economic Calendar
Education
Data
- Names
- Latest
- Prev


Signal Accounts for Members
All Signal Accounts
All Contests


USA State Dept Approves Possible Sale To Sweden Of M142 High Mobility Artillery Rocket Systems And Related Equipment For Estimated Cost Of $930 Million
MSCI Nordic Countries Index Rose 1.6% To 378.65 Points. Among The Ten Sectors, The Nordic Industrials Sector Saw The Largest Gain. Sandvik Ab Rose 6.3%, Leading The Pack Among Nordic Stocks
Four Iranian Diplomats Killed In Lebanon On Sunday In Israeli Attack - Nournews Citing Diplomat
Eurozone Blue-chip Indices Closed Up Over 2%. The STOXX Europe 600 Index Closed Up 1.85% At 605.95 Points. The STOXX Europe 50 Index Closed Up 2.58% At 5831.91 Points. The FTSE Eurotop 300 Index Closed Up 1.83% At 2417.72 Points
[Iran Reiterates No Right To Pass Through The Strait Of Hormuz For Ships Linked To Hostile Forces] On The Evening Of March 10 Local Time, Alireza Tansiri, Commander Of The Iranian Islamic Revolutionary Guard Corps Navy, Warned Via Social Media That Any Ships Linked To Hostile Forces In Iran Are Not Allowed To Pass Through The Strait Of Hormuz. He Stated, "If You Have Any Doubts, You Can Try Approaching." Previously, The Iranian Islamic Revolutionary Guard Corps Stated That Military And Commercial Vessels Belonging To The United States, Israel, European Countries, And Their Supporters Are Prohibited From Passing Through The Strait Of Hormuz, And That "if Discovered By The Iranian Islamic Revolutionary Guard Corps, They Will Be Dealt With."
EIA Raises Its Retail Diesel Price Forecast For 2026 To $4.12 Per Gallon, 20.1% Above Prior Estimate
EIA Says Global Oil Inventories Will Increase By An Average Of 1.9 Million Barrels Per Day In 2026 And By 3.0 Million Barrels/Day In 2027
EIA Says Once Oil Flows Are Reestablished Through Strait Of Hormuz, Global Oil Production Will Continue To Outpace Consumption
EIA Says Does Not Expect OPEC+ To Significantly Increase Production Next Year Given Estimates Of Significant Inventory Builds Over The Forecast Period
Bank Of America Warns: Soaring Oil Prices May Not Necessarily Lead To A Hawkish Fed; Significant Rate Cuts Are Still Possible. Bank Of America Stated That Investors Betting The Fed Will Adopt A More Hawkish Stance Due To Rising Oil Prices May Be Misjudging The Situation. The Bank Warned That Supply Shocks Could Also Result In Interest Rates Remaining Unchanged Or Even Being Significantly Lowered. Since The Outbreak Of The Iran-Iraq War, The Yield On Two-year US Treasury Bonds Has Moved In Tandem With Soaring Oil Prices, Reflecting Market Expectations Of Rising Borrowing Costs. However, Bank Of America Economist Aditya Bhave Pointed Out That This Judgment "may Be Wrong."
EIA - US Retail Gasoline Prices Expected To Average $3.34 Per Gallon In 2026, $3.18 Per Gallon In 2027

China, Mainland M2 Money Supply YoY (Feb)--
F: --
P: --
China, Mainland M1 Money Supply YoY (Feb)--
F: --
P: --
China, Mainland M0 Money Supply YoY (Feb)--
F: --
P: --
Japan Nominal GDP Revised QoQ (Q4)A:--
F: --
P: --
Japan GDP Annualized QoQ Revised (Q4)A:--
F: --
P: --
U.K. BRC Overall Retail Sales YoY (Feb)A:--
F: --
P: --
U.K. BRC Like-For-Like Retail Sales YoY (Feb)A:--
F: --
P: --
China, Mainland Exports YoY (CNH) (Jan)A:--
F: --
P: --
China, Mainland Imports (CNH) (Feb)A:--
F: --
P: --
China, Mainland Exports (Feb)A:--
F: --
P: --
China, Mainland Imports YoY (CNH) (Feb)A:--
F: --
P: --
China, Mainland Imports YoY (USD) (Feb)A:--
F: --
P: --
China, Mainland Exports YoY (USD) (Feb)A:--
F: --
P: --
China, Mainland Trade Balance (CNH) (Feb)A:--
F: --
P: --
China, Mainland Trade Balance (USD) (Feb)A:--
F: --
P: --
Indonesia Retail Sales YoY (Jan)A:--
F: --
P: --
Germany Exports MoM (SA) (Jan)A:--
F: --
P: --
France Trade Balance (SA) (Jan)A:--
F: --
France Current Account (Not SA) (Jan)A:--
F: --
P: --
Italy PPI YoY (Jan)A:--
F: --
P: --
South Africa GDP YoY (Q4)A:--
F: --
P: --
U.S. NFIB Small Business Optimism Index (SA) (Feb)A:--
F: --
P: --
Germany 2-Year Schatz Auction Avg. YieldA:--
F: --
P: --
U.S. Weekly Redbook Index YoYA:--
F: --
P: --
U.S. Existing Home Sales Annualized Total (Feb)A:--
F: --
U.S. Existing Home Sales Annualized MoM (Feb)A:--
F: --
U.S. EIA Natural Gas Production Forecast For The Next Year (Mar)A:--
F: --
P: --
U.S. EIA Short-Term Crude Production Forecast For The Next Year (Mar)A:--
F: --
P: --
U.S. EIA Short-Term Crude Production Forecast For The Year (Mar)A:--
F: --
P: --
EIA Monthly Short-Term Energy Outlook
U.S. 3-Year Note Auction Yield--
F: --
P: --
U.S. API Weekly Cushing Crude Oil Stocks--
F: --
P: --
U.S. API Weekly Crude Oil Stocks--
F: --
P: --
U.S. API Weekly Refined Oil Stocks--
F: --
P: --
U.S. API Weekly Gasoline Stocks--
F: --
P: --
Japan Domestic Enterprise Commodity Price Index YoY (Feb)--
F: --
P: --
Japan Domestic Enterprise Commodity Price Index MoM (Feb)--
F: --
P: --
Japan PPI MoM (Feb)--
F: --
P: --
Germany CPI Final YoY (Feb)--
F: --
P: --
Germany CPI Final MoM (Feb)--
F: --
P: --
Germany HICP Final YoY (Feb)--
F: --
P: --
Germany HICP Final MoM (Feb)--
F: --
P: --
Turkey Retail Sales YoY (Jan)--
F: --
P: --
Italy 12-Month BOT Auction Avg. Yield--
F: --
P: --
Germany 10-Year Bund Auction Avg. Yield--
F: --
P: --
U.S. MBA Mortgage Application Activity Index WoW--
F: --
P: --
Brazil Retail Sales MoM (Jan)--
F: --
P: --
U.S. Core CPI YoY (Not SA) (Feb)--
F: --
P: --
U.S. CPI MoM (Not SA) (Feb)--
F: --
P: --
U.S. Core CPI MoM (SA) (Feb)--
F: --
P: --
U.S. CPI YoY (Not SA) (Feb)--
F: --
P: --
U.S. CPI MoM (SA) (Feb)--
F: --
P: --
U.S. Core CPI (SA) (Feb)--
F: --
P: --
U.S. Real Income MoM (SA) (Feb)--
F: --
P: --
U.S. EIA Weekly Crude Oil Imports Changes--
F: --
P: --
U.S. EIA Weekly Heating Oil Stock Changes--
F: --
P: --
U.S. EIA Weekly Crude Demand Projected by Production--
F: --
P: --
U.S. EIA Weekly Gasoline Stocks Change--
F: --
P: --
U.S. EIA Weekly Crude Stocks Change--
F: --
P: --
U.S. EIA Weekly Cushing, Oklahoma Crude Oil Stocks Change--
F: --
P: --


No matching data
Gold rebounds near $4,850 as the dollar pauses, while silver stabilizes near $85. Traders watch key support zones for signs of a broader metals recovery.

Gold (XAU/USD) managed to gain some traction and edged higher around the 4,850 level. However, the reason for its renewed strength can be attributed to a pause in the US dollar's recent recovery, which encouraged some buying interest in the precious metal. Moreover, easing geopolitical and trade tensions could limit gains in gold.
Meanwhile, Silver is trading at 83.18, showing strong gains of 4.98% as investors turn to the metal amid a pause in the US dollar's recovery.
As we mentioned, President Trump has chosen Kevin Warsh to become the next head of the US Federal Reserve. This decision removed a main source of uncertainty in the market, which is basically bad for gold.
Kevin Warsh is known for being strict on inflation, which means interest rates may stay high for longer. When interest rates are high, Gold becomes less attractive.
At the same time, the global tensions are easing, which is also bad for Gold. It is worth mentioning that the US and India have agreed on a trade deal, making investors more confident about the economy.
Moreover, the US and Iran are also expected to restart nuclear talks, reducing fears of conflict. As a result, Gold prices are struggling to move higher.
On the other hand, the latest US economic data is helping the US Dollar recover, which can weigh on Gold. On Monday, the US ISM Manufacturing PMI showed that factory activity grew for the first time in a year, rising to 52.6 in January from 47.9 in December. This stronger-than-expected growth supports the US Dollar, making Gold less attractive because a stronger Dollar usually pushes Gold prices down.
Despite this, the overall outlook for Gold remains cautious. Traders are now waiting for more US economic updates, including the JOLTS Job Openings report on Tuesday, followed by the ADP private employment numbers and ISM Services PMI on Wednesday.
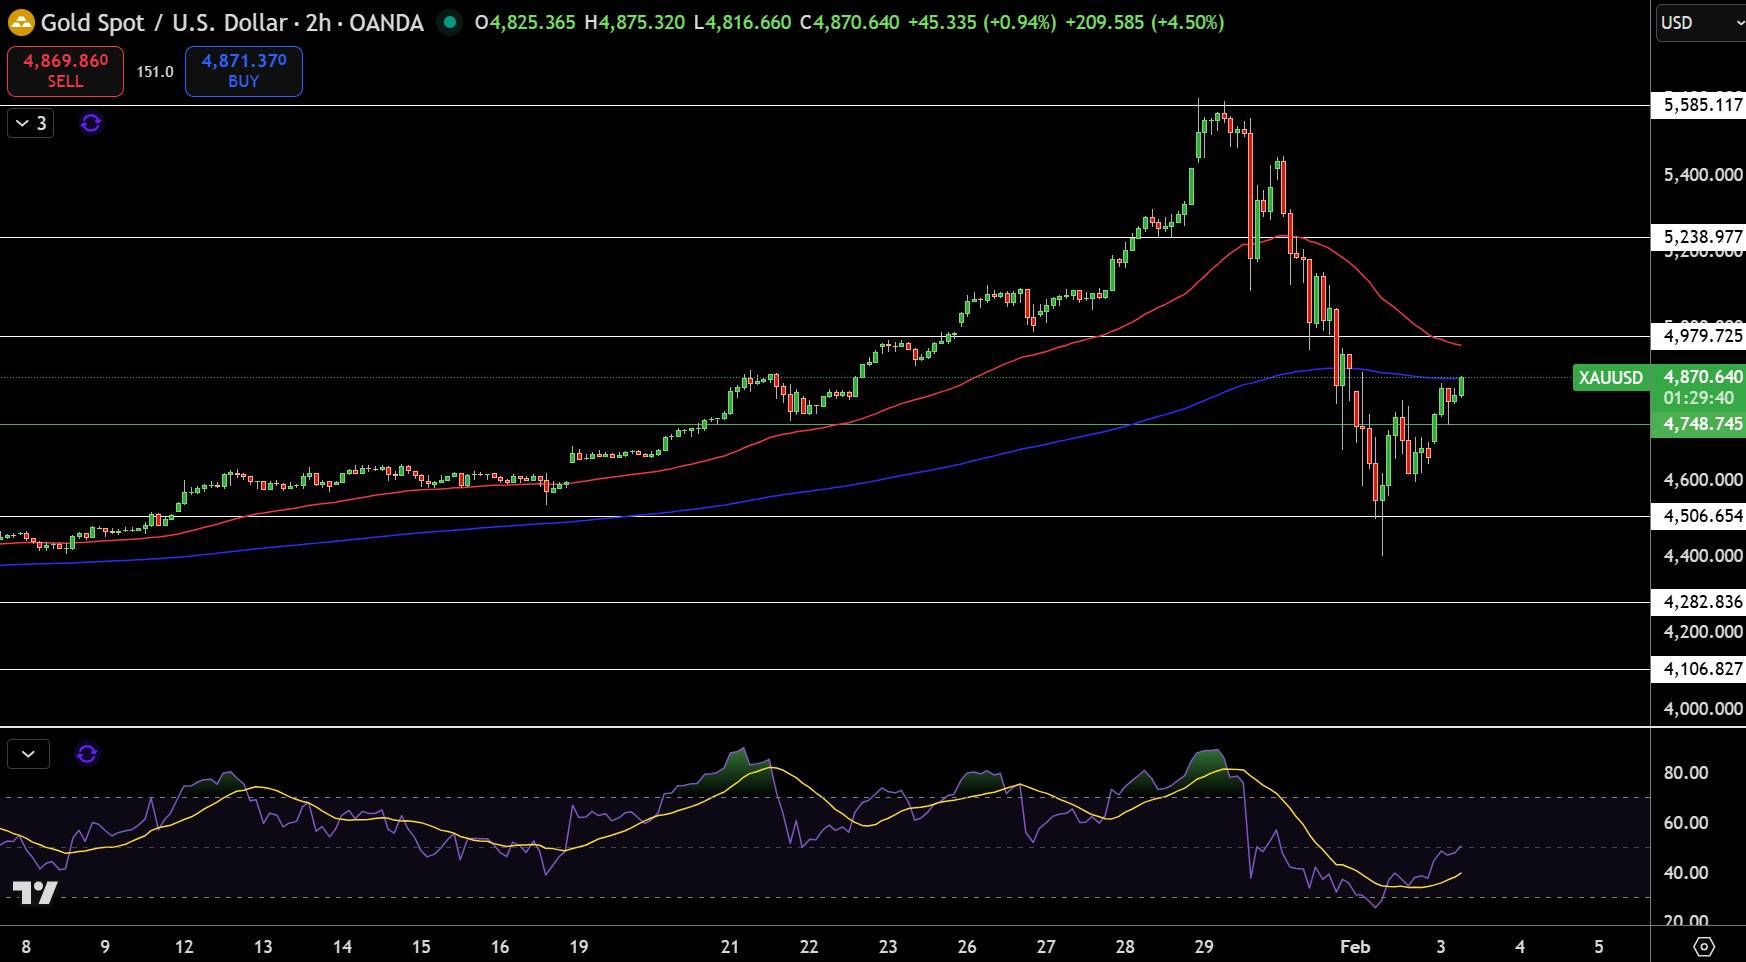
Gold – ChartGold (XAU/USD) is trading near $4,870, rebounding after a sharp sell-off from the $5,550 peak. The 2-hour chart shows a strong bullish recovery candle sequence following a long lower wick near $4,500, signaling dip buying. Price has reclaimed the 200-EMA and is now challenging the 50-EMA around $4,980, a key near-term resistance.
The broader structure still reflects an ascending trend, with this move resembling a corrective pullback rather than trend failure. RSI has bounced from oversold levels near 30 to around 45, showing improving momentum but not yet strength. Immediate support sits at $4,750, while resistance remains at $5,000–$5,050.
Trade idea: Buy pullbacks above $4,750, targeting $5,050, invalid below $4,600.
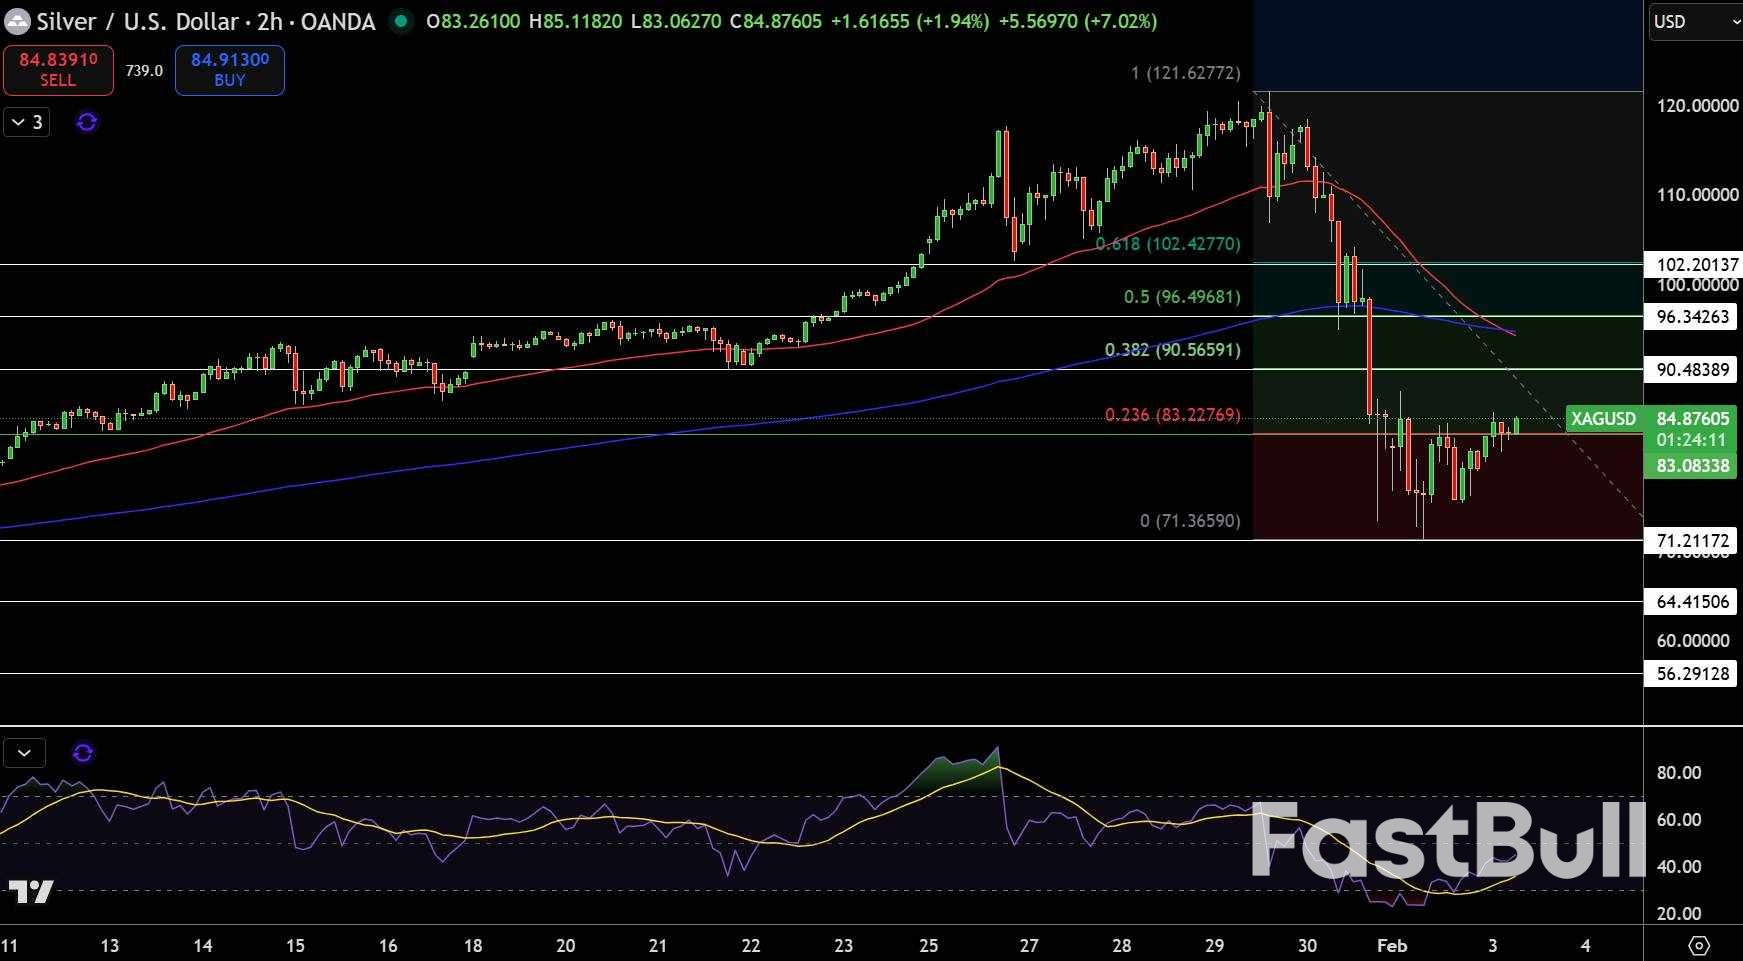
Silver – ChartSilver (XAG/USD) is trading around $84.9, attempting to stabilize after a sharp drop from the $120 peak. On the 2-hour chart, price plunged through the rising trendline and the 50-EMA, confirming a clear short-term trend break. The sell-off found support near the 0.236 Fibonacci level at $83.2, where long lower wicks suggest buyers are defending this zone.
Price is still below the 200-EMA near $96.5, keeping the broader bias cautious. RSI rebounded from oversold levels below 30 to near 40, signaling slowing downside momentum but not a reversal. Immediate resistance stands at $90.5, then $96.3, while support remains at $83 and $71.
Trade idea: Buy above $83 for a rebound toward $90, invalid below $71.
The risk of loss in trading financial instruments such as stocks, FX, commodities, futures, bonds, ETFs and crypto can be substantial. You may sustain a total loss of the funds that you deposit with your broker. Therefore, you should carefully consider whether such trading is suitable for you in light of your circumstances and financial resources.
No decision to invest should be made without thoroughly conducting due diligence by yourself or consulting with your financial advisors. Our web content might not suit you since we don't know your financial conditions and investment needs. Our financial information might have latency or contain inaccuracy, so you should be fully responsible for any of your trading and investment decisions. The company will not be responsible for your capital loss.
Without getting permission from the website, you are not allowed to copy the website's graphics, texts, or trademarks. Intellectual property rights in the content or data incorporated into this website belong to its providers and exchange merchants.
Not Logged In
Log in to access more features
Log In
Sign Up