


Markets
Analysis
User
24/7
Economic Calendar
Education
Data
- Names
- Latest
- Prev


Gold (XAU) is trading higher near $4,205 in early Monday trading, as markets widely expect the Federal Reserve to cut interest rates at its upcoming meeting.

Gold (XAU) is trading higher near $4,205 in early Monday trading, as markets widely expect the Federal Reserve to cut interest rates at its upcoming meeting. This policy shift supports investor interest in the metal, especially in the face of a cooling labour market. The expectations of easier monetary policy continue to provide a bullish backdrop for gold.
Moreover, recent data show that inflation remains above the Fed's 2% target. However, slowing job growth has increased pressure for a rate cut. A 25-basis-point reduction is now largely factored into the price. The lower rates weaken the US dollar and Treasury yields, both of which benefit gold prices. If the Fed confirms this dovish stance on Wednesday, gold may extend its gains toward the $4,380 resistance zone.
On the other hand, central bank demand continues to support gold's long-term bullish trend. The People's Bank of China added to its gold reserves for the 13th consecutive month, lifting total holdings to over 74 million troy ounces. This consistent buying reinforces gold's role as a strategic reserve asset in times of currency uncertainty or geopolitical tension. Sustained demand from global central banks provides a floor for gold prices.
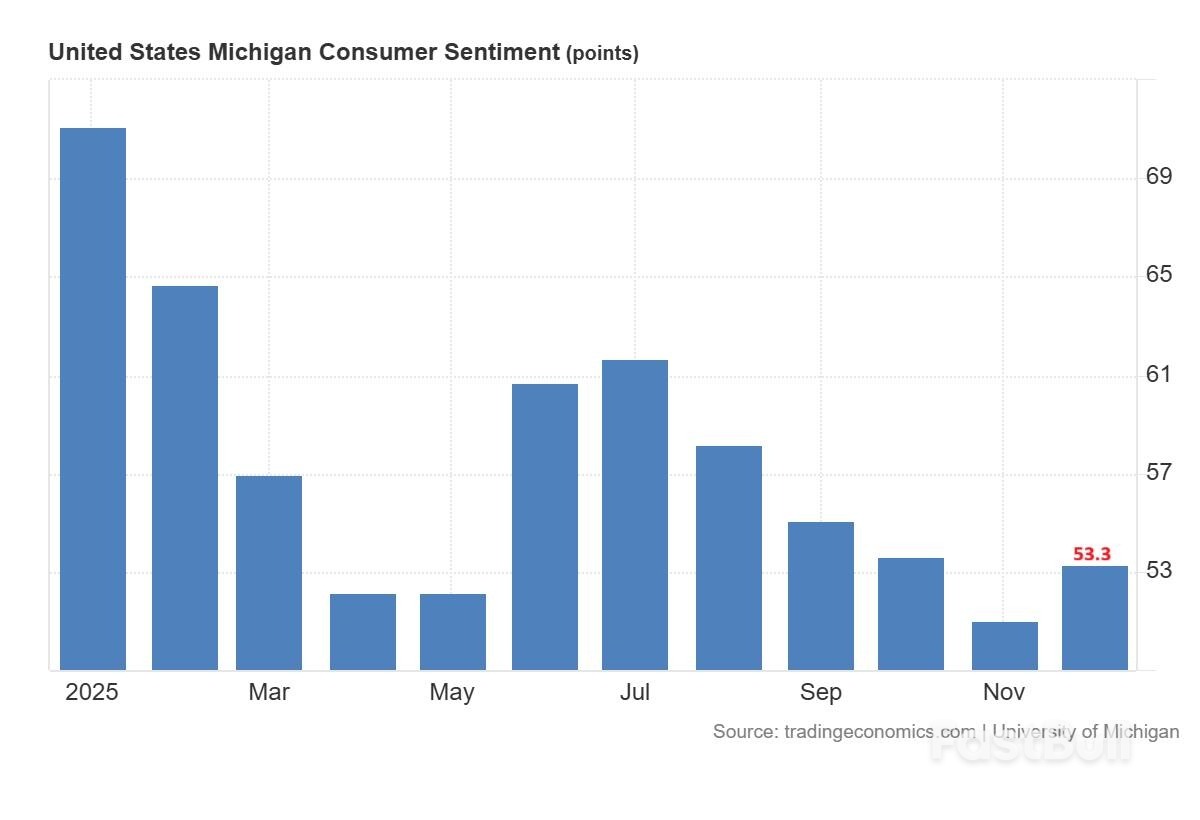
However, improved US consumer sentiment poses a risk to gold in the near term. The University of Michigan consumer sentiment increased to 53.3, beating expectations and signalling some resilience in the US economy. If the dollar strengthens on the back of better economic data, gold could face resistance. A stronger dollar makes gold more expensive for foreign buyers, potentially limiting upside momentum in the days ahead.
XAUUSD Daily Chart – Bullish Consolidation
The daily chart for spot gold shows that the price is consolidating within an ascending broadening wedge pattern. It has broken out of the triangle and is now consolidating around the $4,200 area.
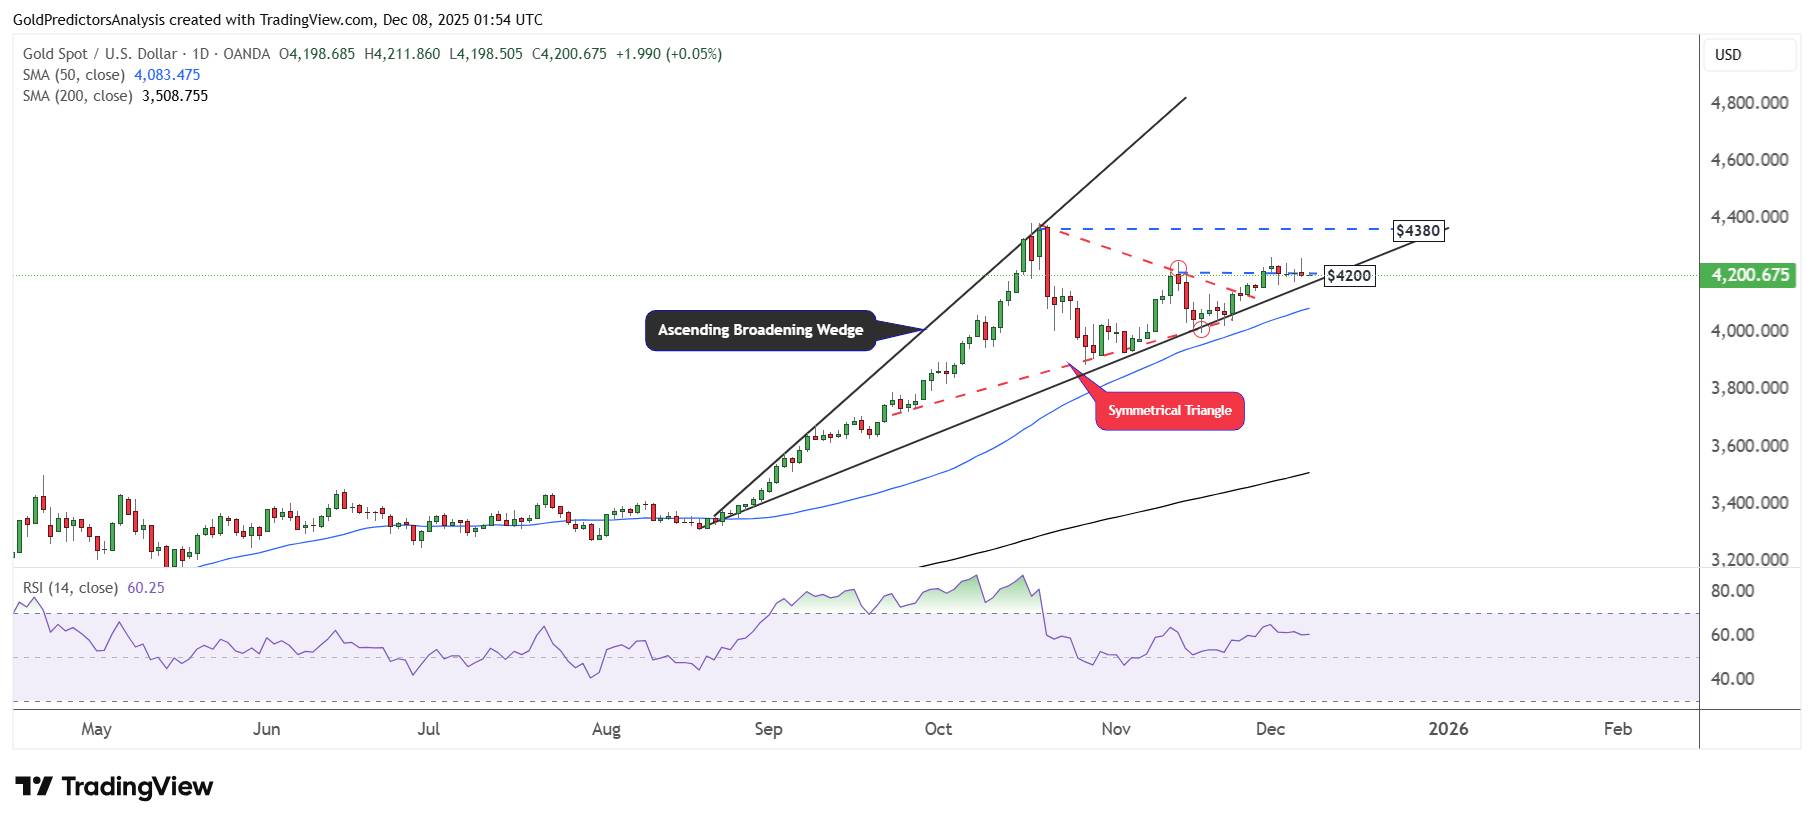
A break above $4,260 could trigger a move toward the $4,380 resistance level. Furthermore, a breakout above $4,380 would likely initiate a strong surge in gold prices. The sustained consolidation above the $4,000 region signals strong support in the gold market. This has been followed by the formation of a bullish structure, indicating growing positive momentum.
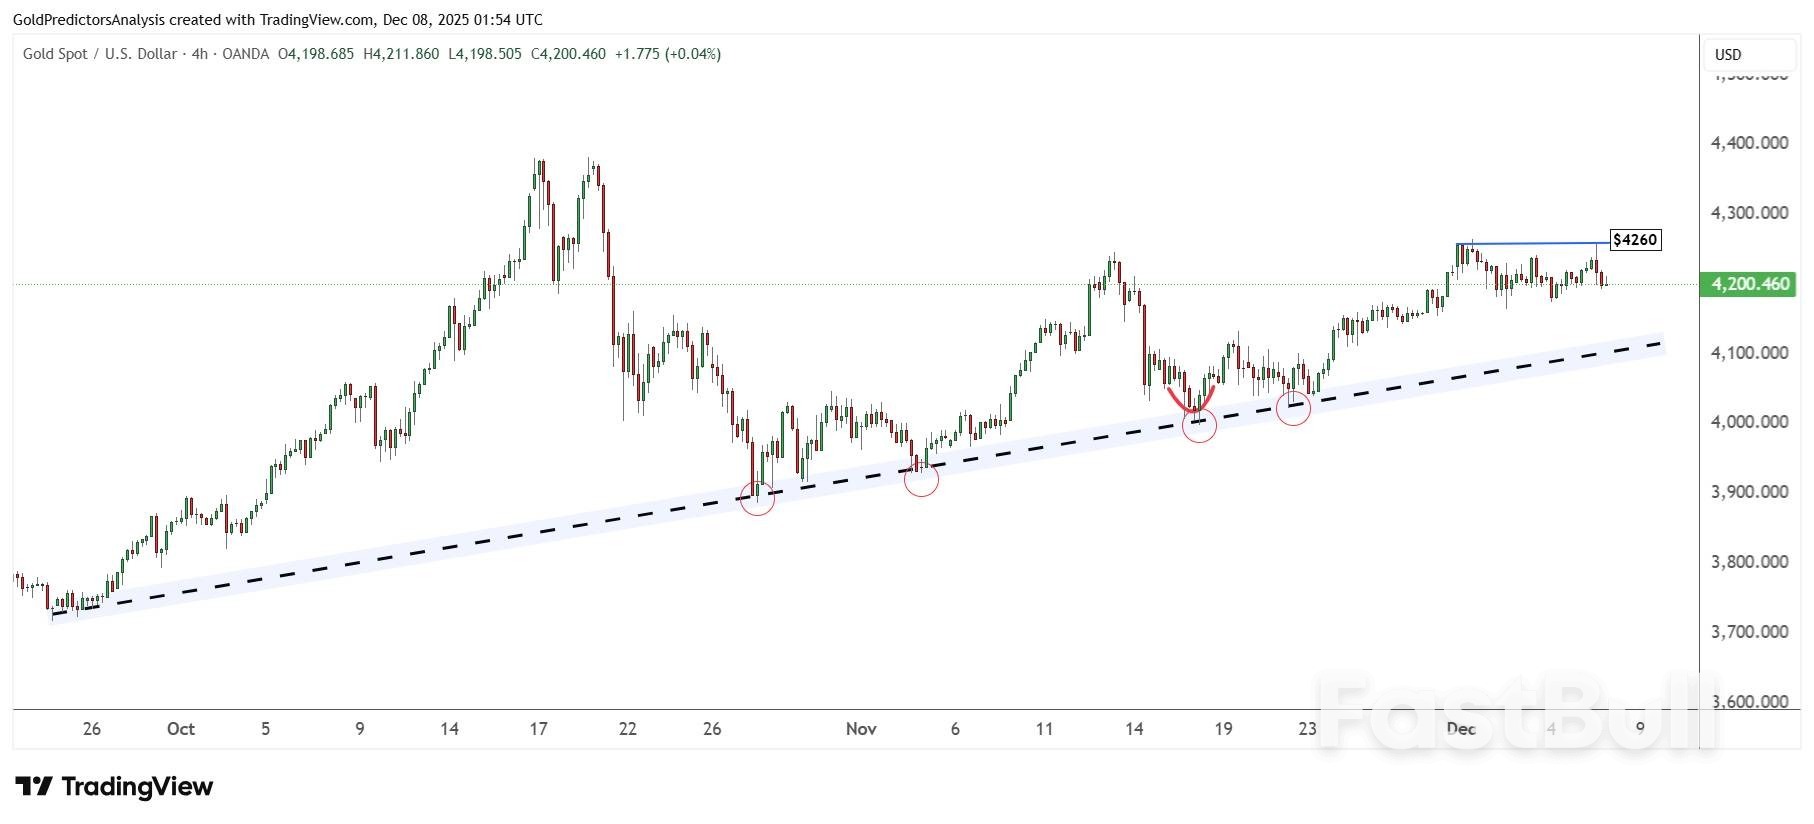
The 4-hour chart for spot gold shows that the price is consolidating above a rising trendline. Notably, the price has formed a double bottom pattern on this line multiple times. Each time, the price tests the support level, a rebound follows. Therefore, a break above $4,260 would be a bullish signal and could push the price toward the $4,380 level.
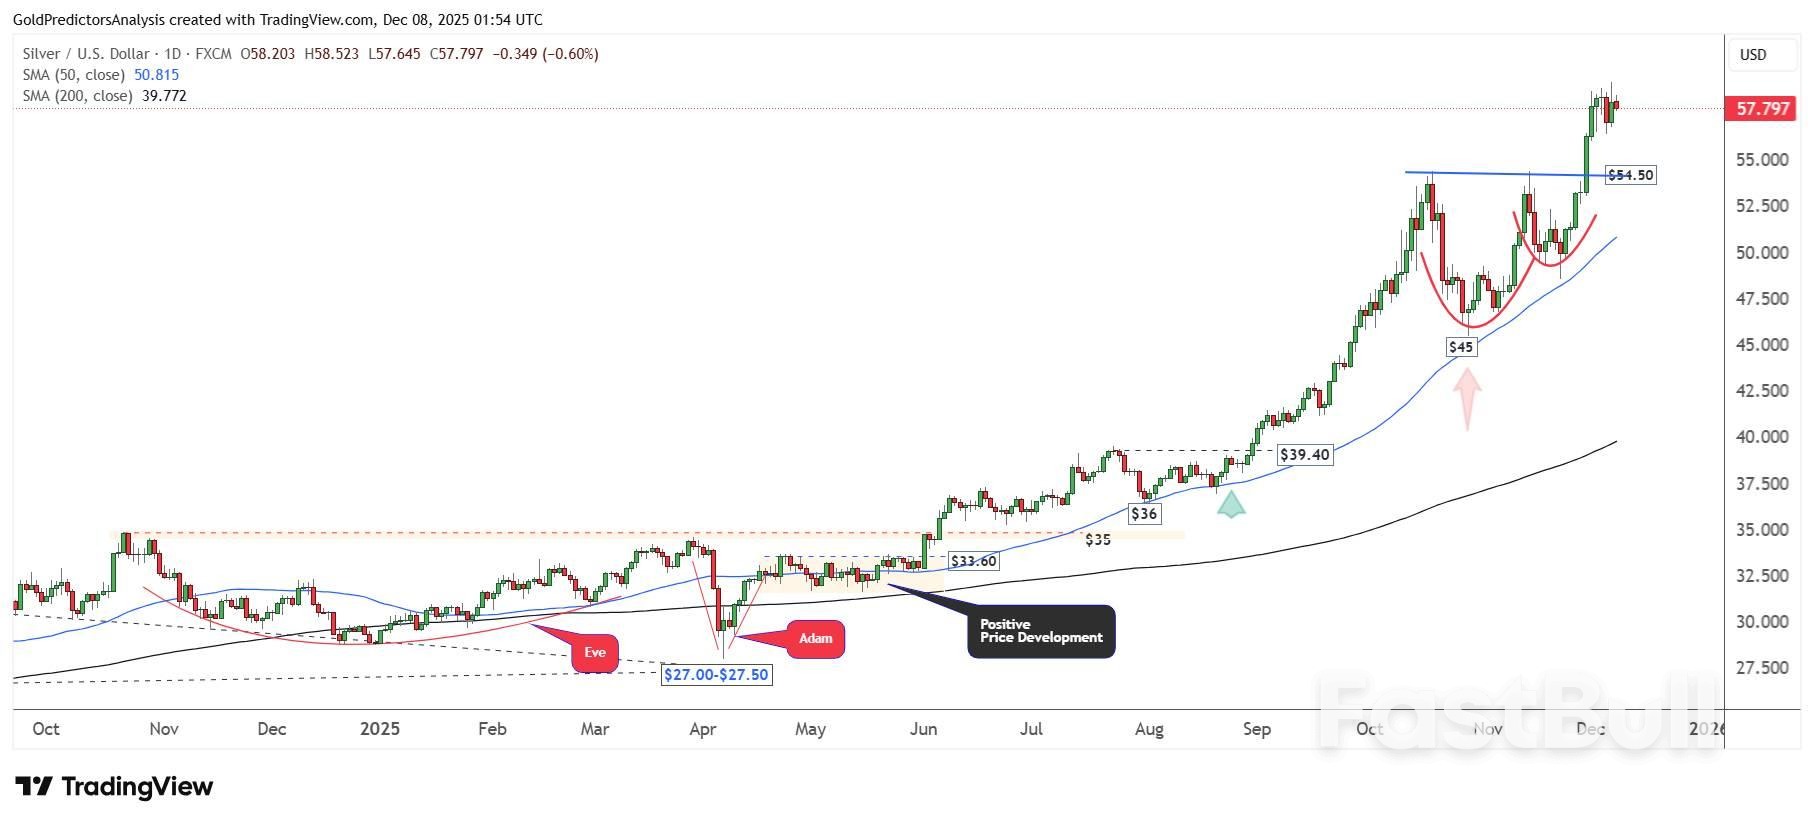
XAGUSD Daily Chart – Strong Bullish Momentum
The daily chart for spot silver (XAG) shows a strong bullish formation confirmed by a cup-and-handle pattern. The breakout above $54.50 has solidified a bullish structure. A move above $59.33 would likely push prices higher toward the $62 level. Furthermore, the strong upward momentum, supported by the rising 50-day and 200-day SMAs, indicates a firmly bullish trend in the silver market.
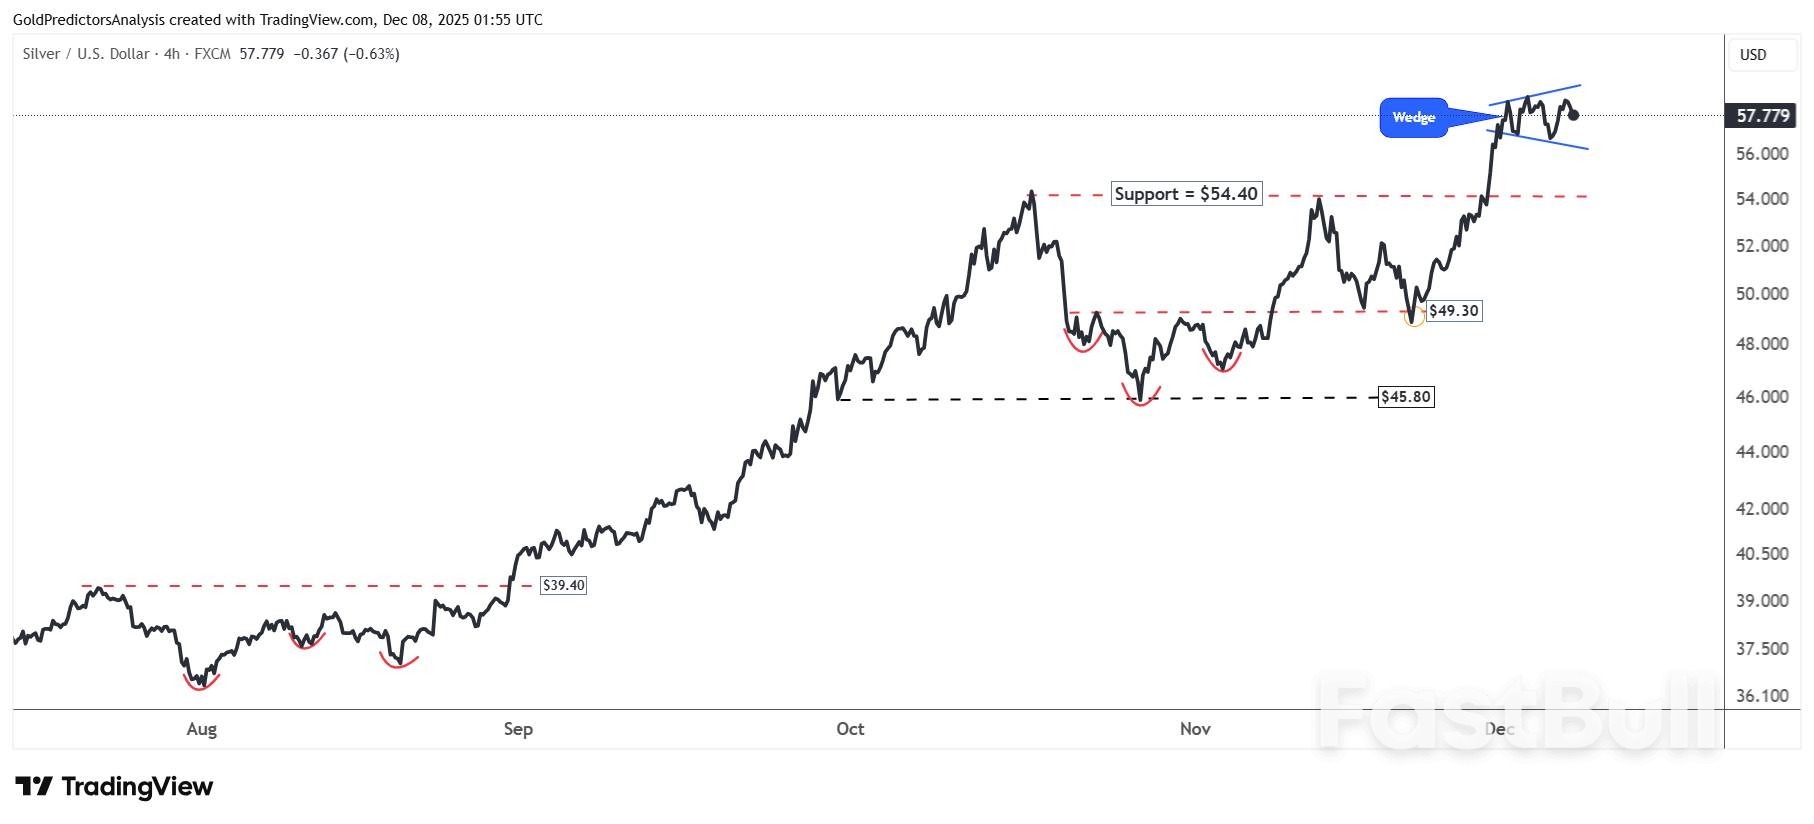
The 4-hour chart for spot silver shows that the price has formed a strong bullish pattern. An inverted head-and-shoulders formation is developing above the $45.80 level. A breakout above $54.50 pushed the price to a new record high at $59.33.
Following this high, silver is now consolidating within a wedge pattern, which signals short-term volatility. The upcoming Federal Reserve meeting on December 10 is likely to act as a catalyst for the next major move in the silver market.
US Dollar Daily – Negative Momentum
The daily chart for the USD Index shows that it is trading below the 99 level and remains weak below the 200-day SMA. The loss of momentum following the failure to break above 100.50 suggests the index is preparing for another move lower.
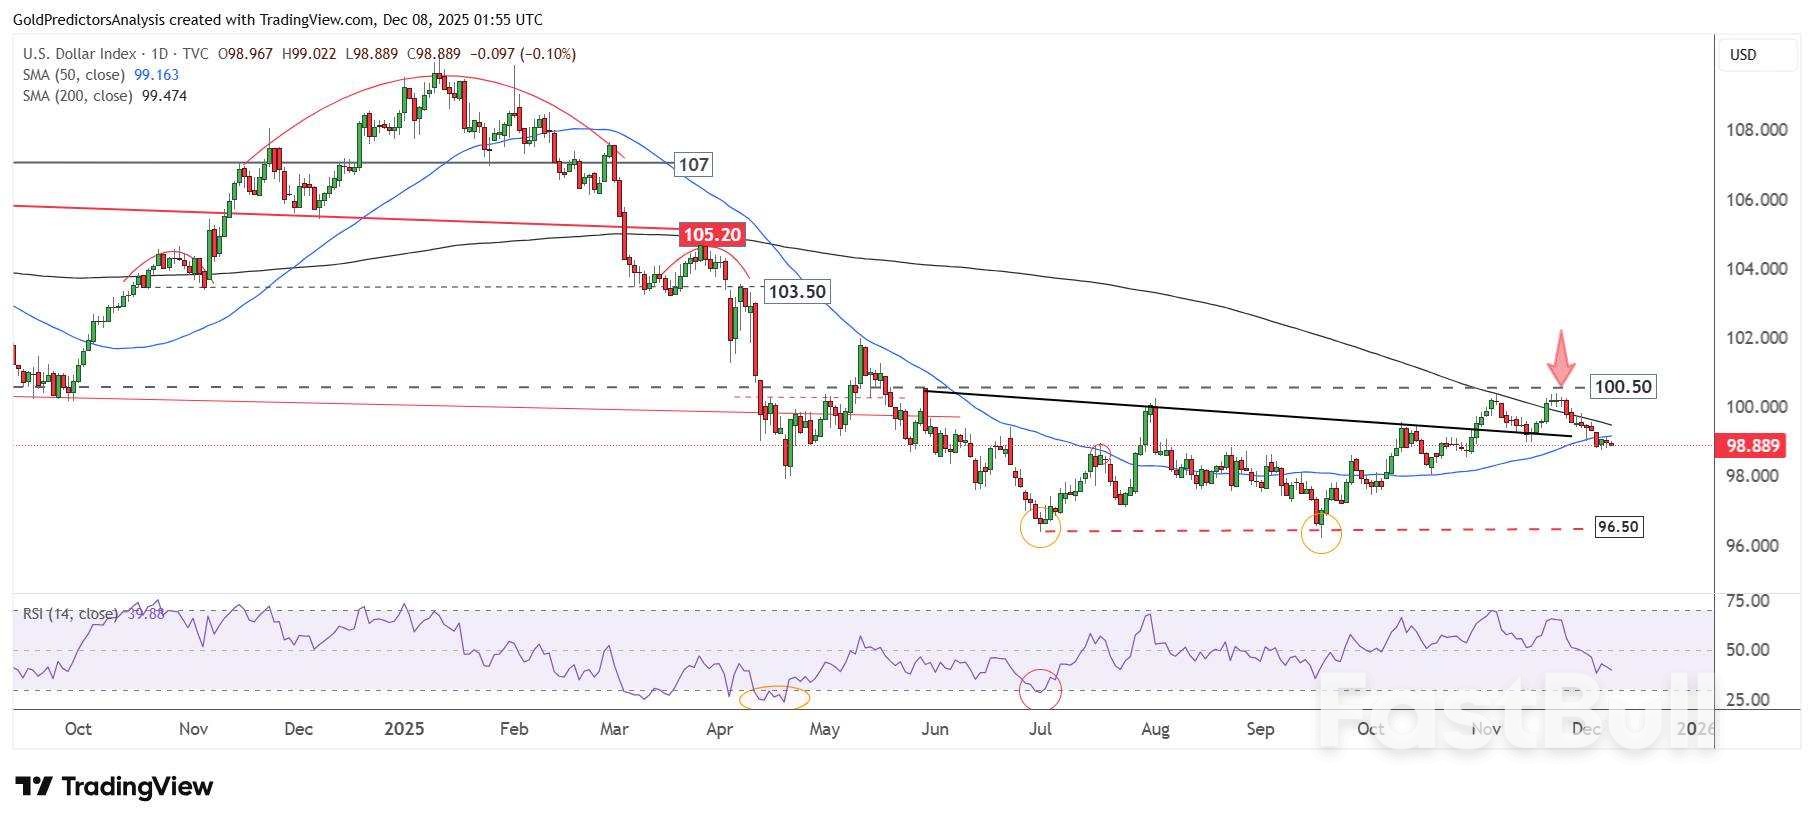
A break below the 98 level could trigger a sharp decline toward the 96.50 support area. Furthermore, a drop below 96.50 would likely open the door for a deeper move toward the 90 level. To negate this bearish setup, a decisive break above 100.50 is required.
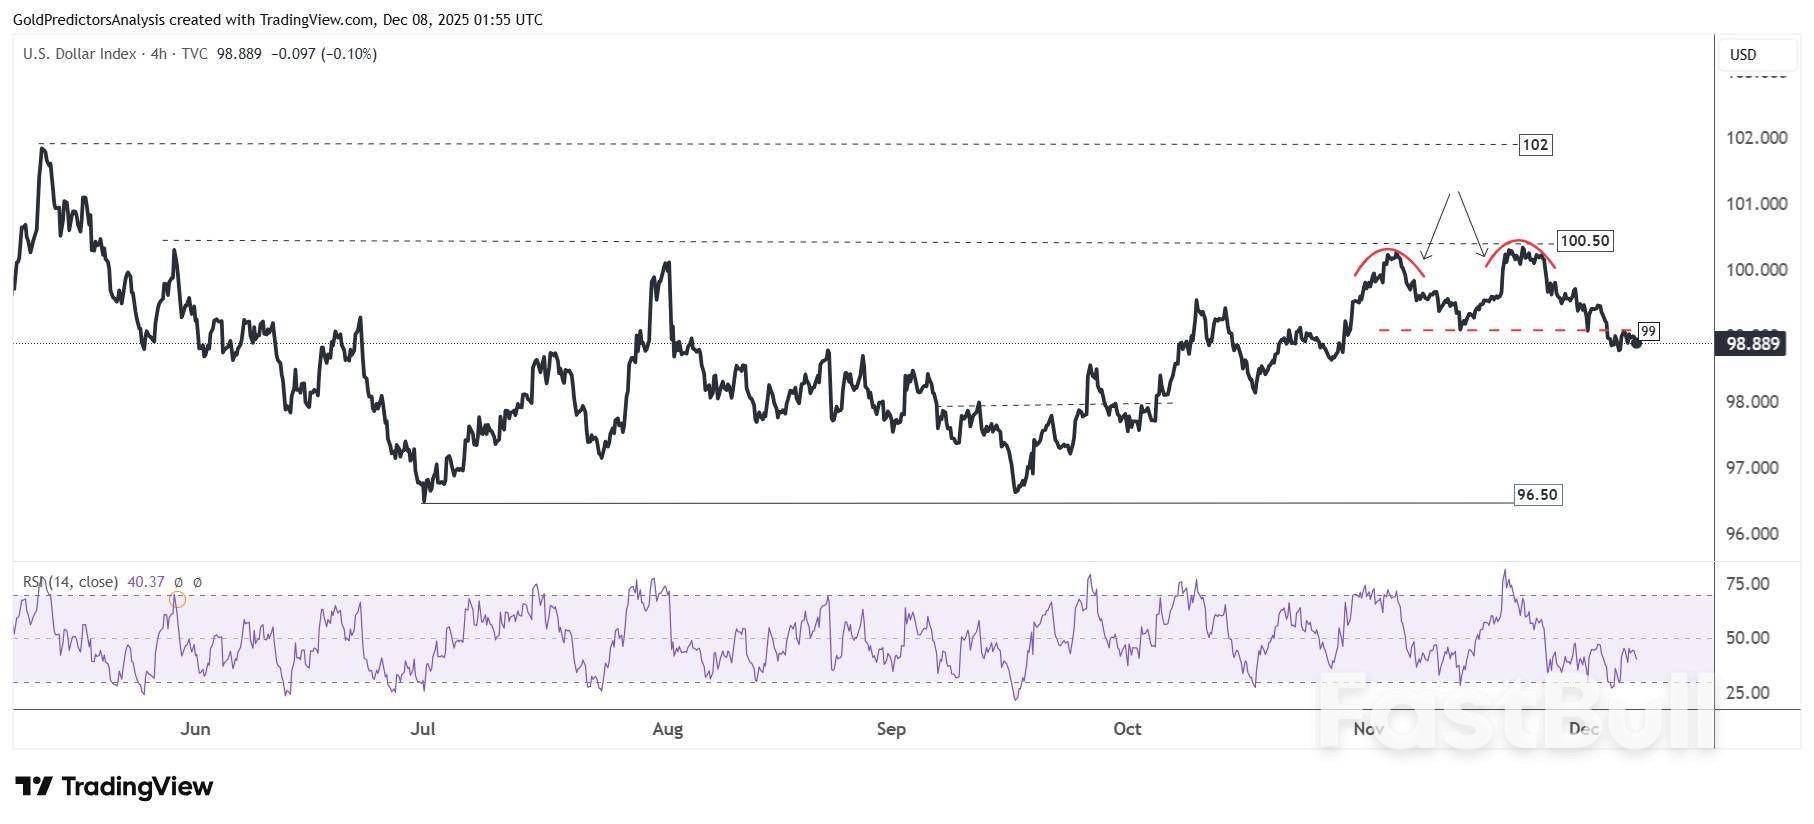
The 4-hour chart for the US Dollar Index shows that the index is consolidating below the 99 level after forming a double top at the 100.50 level. This pattern suggests further downside in the short term. However, the broader trend remains in a consolidation phase between the 96.50 and 100.50 levels. A breakout from this range will determine the next major move in the US Dollar Index.
728 RM B 7/F GEE LOK IND BLDG NO 34 HUNG TO RD KWUN TONG KLN HONG KONG


The risk of loss in trading financial instruments such as stocks, FX, commodities, futures, bonds, ETFs and crypto can be substantial. You may sustain a total loss of the funds that you deposit with your broker. Therefore, you should carefully consider whether such trading is suitable for you in light of your circumstances and financial resources.
No decision to invest should be made without thoroughly conducting due diligence by yourself or consulting with your financial advisors. Our web content might not suit you since we don't know your financial conditions and investment needs. Our financial information might have latency or contain inaccuracy, so you should be fully responsible for any of your trading and investment decisions. The company will not be responsible for your capital loss.
Without getting permission from the website, you are not allowed to copy the website's graphics, texts, or trademarks. Intellectual property rights in the content or data incorporated into this website belong to its providers and exchange merchants.
Not Logged In
Log in to access more features


Log In
Sign Up


