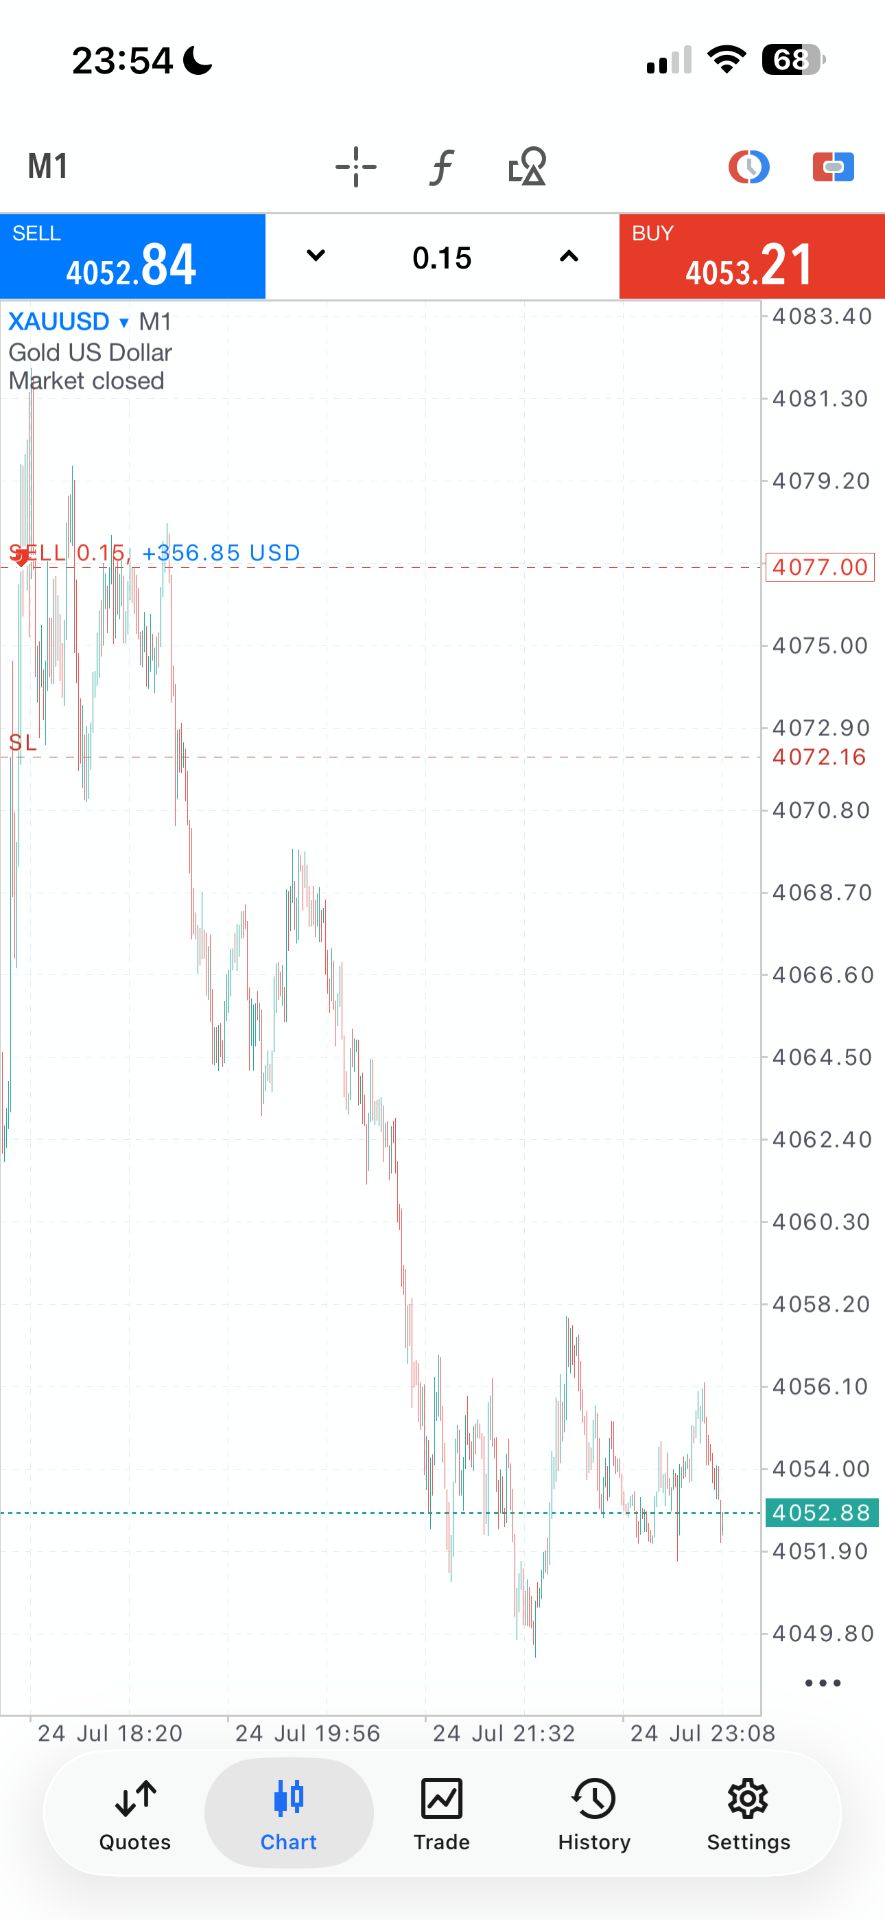
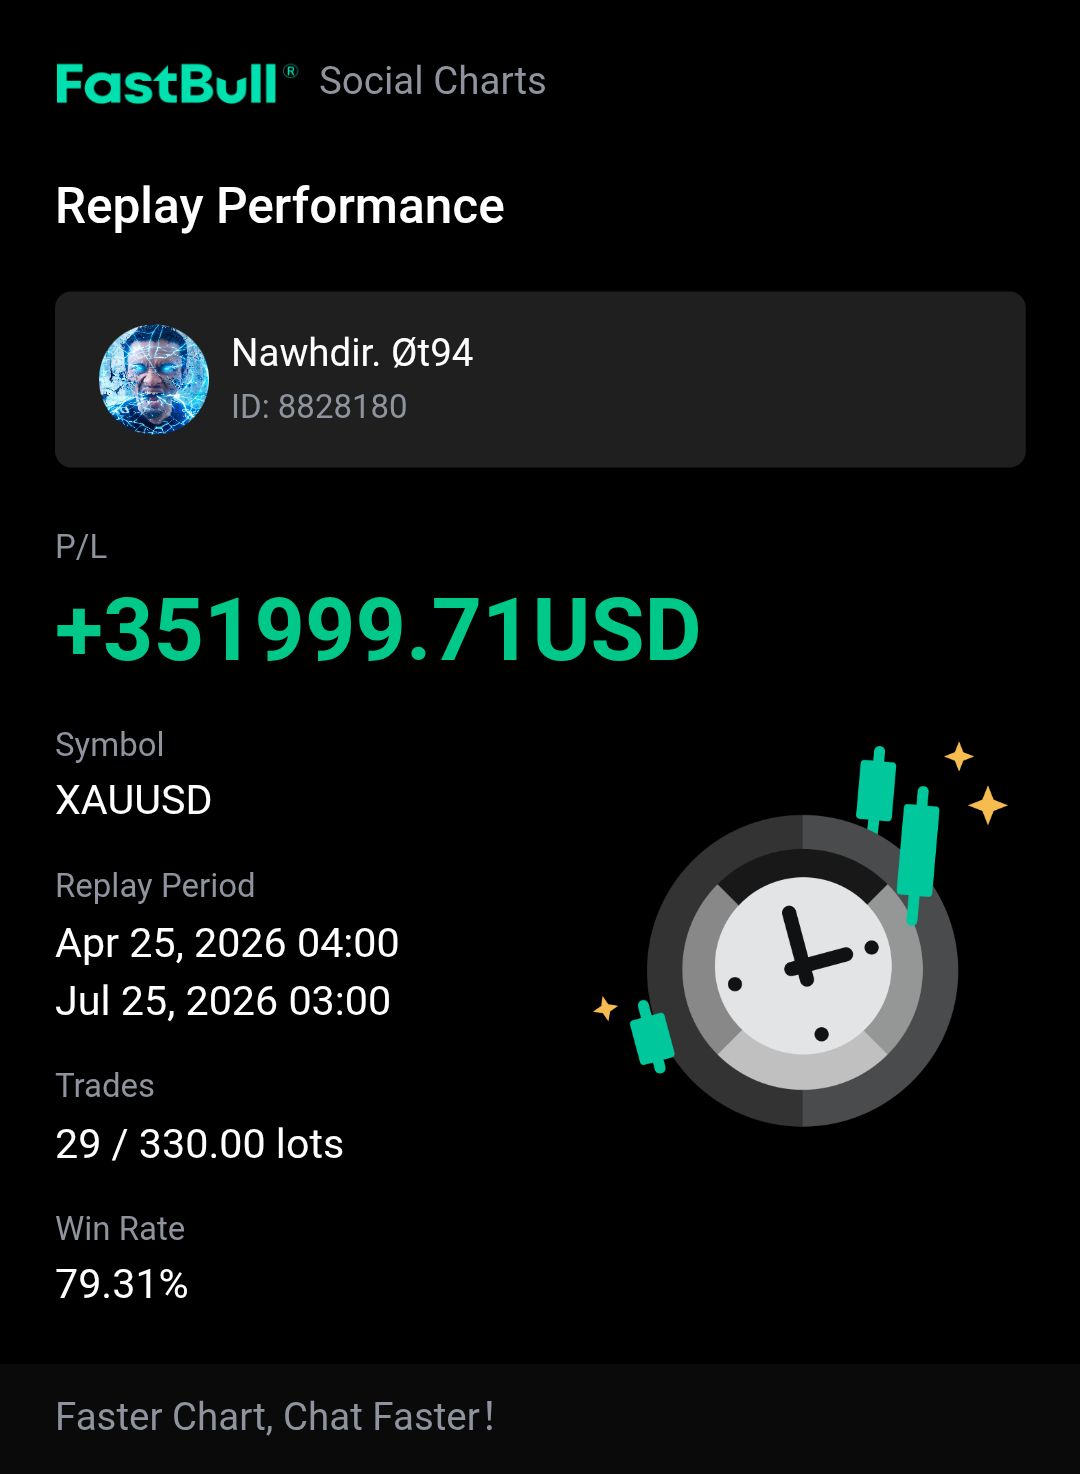
Markets
News
Analysis
User
24/7
Economic Calendar
Education
Data
- Names
- Latest
- Prev


Signal Accounts for Members
All Signal Accounts
All Contests


Euro Zone IHS Markit Construction PMI (Nov)A:--
F: --
P: --
Italy IHS Markit Construction PMI (Nov)A:--
F: --
P: --
U.K. Markit/CIPS Construction PMI (Nov)A:--
F: --
P: --
France 10-Year OAT Auction Avg. YieldA:--
F: --
P: --
Euro Zone Retail Sales MoM (Oct)A:--
F: --
P: --
Euro Zone Retail Sales YoY (Oct)A:--
F: --
P: --
Brazil GDP YoY (Q3)A:--
F: --
P: --
U.S. Challenger Job Cuts (Nov)A:--
F: --
P: --
U.S. Challenger Job Cuts MoM (Nov)A:--
F: --
P: --
U.S. Challenger Job Cuts YoY (Nov)A:--
F: --
P: --
U.S. Initial Jobless Claims 4-Week Avg. (SA)A:--
F: --
P: --
U.S. Weekly Initial Jobless Claims (SA)A:--
F: --
P: --
U.S. Weekly Continued Jobless Claims (SA)A:--
F: --
P: --
Canada Ivey PMI (SA) (Nov)A:--
F: --
P: --
Canada Ivey PMI (Not SA) (Nov)A:--
F: --
P: --
U.S. Non-Defense Capital Durable Goods Orders Revised MoM (Excl. Aircraft) (SA) (Sept)A:--
F: --
U.S. Factory Orders MoM (Excl. Transport) (Sept)A:--
F: --
P: --
U.S. Factory Orders MoM (Sept)A:--
F: --
P: --
U.S. Factory Orders MoM (Excl. Defense) (Sept)A:--
F: --
P: --
U.S. EIA Weekly Natural Gas Stocks ChangeA:--
F: --
P: --
Saudi Arabia Crude Oil ProductionA:--
F: --
P: --
U.S. Weekly Treasuries Held by Foreign Central BanksA:--
F: --
P: --
Japan Foreign Exchange Reserves (Nov)A:--
F: --
P: --
India Repo RateA:--
F: --
P: --
India Benchmark Interest RateA:--
F: --
P: --
India Reverse Repo RateA:--
F: --
P: --
India Cash Reserve RatioA:--
F: --
P: --
Japan Leading Indicators Prelim (Oct)A:--
F: --
P: --
U.K. Halifax House Price Index YoY (SA) (Nov)A:--
F: --
P: --
U.K. Halifax House Price Index MoM (SA) (Nov)A:--
F: --
P: --
France Current Account (Not SA) (Oct)--
F: --
P: --
France Trade Balance (SA) (Oct)--
F: --
P: --
France Industrial Output MoM (SA) (Oct)--
F: --
P: --
Italy Retail Sales MoM (SA) (Oct)--
F: --
P: --
Euro Zone Employment YoY (SA) (Q3)--
F: --
P: --
Euro Zone GDP Final YoY (Q3)--
F: --
P: --
Euro Zone GDP Final QoQ (Q3)--
F: --
P: --
Euro Zone Employment Final QoQ (SA) (Q3)--
F: --
P: --
Euro Zone Employment Final (SA) (Q3)--
F: --
Brazil PPI MoM (Oct)--
F: --
P: --
Mexico Consumer Confidence Index (Nov)--
F: --
P: --
Canada Unemployment Rate (SA) (Nov)--
F: --
P: --
Canada Labor Force Participation Rate (SA) (Nov)--
F: --
P: --
Canada Employment (SA) (Nov)--
F: --
P: --
Canada Part-Time Employment (SA) (Nov)--
F: --
P: --
Canada Full-time Employment (SA) (Nov)--
F: --
P: --
U.S. Personal Income MoM (Sept)--
F: --
P: --
U.S. Dallas Fed PCE Price Index YoY (Sept)--
F: --
P: --
U.S. PCE Price Index YoY (SA) (Sept)--
F: --
P: --
U.S. PCE Price Index MoM (Sept)--
F: --
P: --
U.S. Personal Outlays MoM (SA) (Sept)--
F: --
P: --
U.S. Core PCE Price Index MoM (Sept)--
F: --
P: --
U.S. UMich 5-Year-Ahead Inflation Expectations Prelim YoY (Dec)--
F: --
P: --
U.S. Core PCE Price Index YoY (Sept)--
F: --
P: --
U.S. Real Personal Consumption Expenditures MoM (Sept)--
F: --
P: --
U.S. 5-10 Year-Ahead Inflation Expectations (Dec)--
F: --
P: --
U.S. UMich Current Economic Conditions Index Prelim (Dec)--
F: --
P: --
U.S. UMich Consumer Sentiment Index Prelim (Dec)--
F: --
P: --
U.S. UMich 1-Year-Ahead Inflation Expectations Prelim (Dec)--
F: --
P: --
U.S. UMich Consumer Expectations Index Prelim (Dec)--
F: --
P: --


No matching data
Latest Views
Latest Views
Trending Topics
Top Columnists
Latest Update
White Label
Data API
Web Plug-ins
Affiliate Program
View All

No data
Key Highlights EUR/USD started a fresh increase above the 1.0750 resistance zone. A short-term rising channel with support at 1.
Key Highlights
EUR/USD Technical Analysis
The Euro started a decent increase above the 1.0750 resistance against the US Dollar. EUR/USD broke the 1.0800 and 1.0820 resistance levels.
Looking at the 4-hour chart, the pair settled above the 1.0800 level, the 100 simple moving average (red, 4-hour), and the 200 simple moving average (green, 4-hour). The pair even climbed above the 1.0850 zone before the bears appeared.
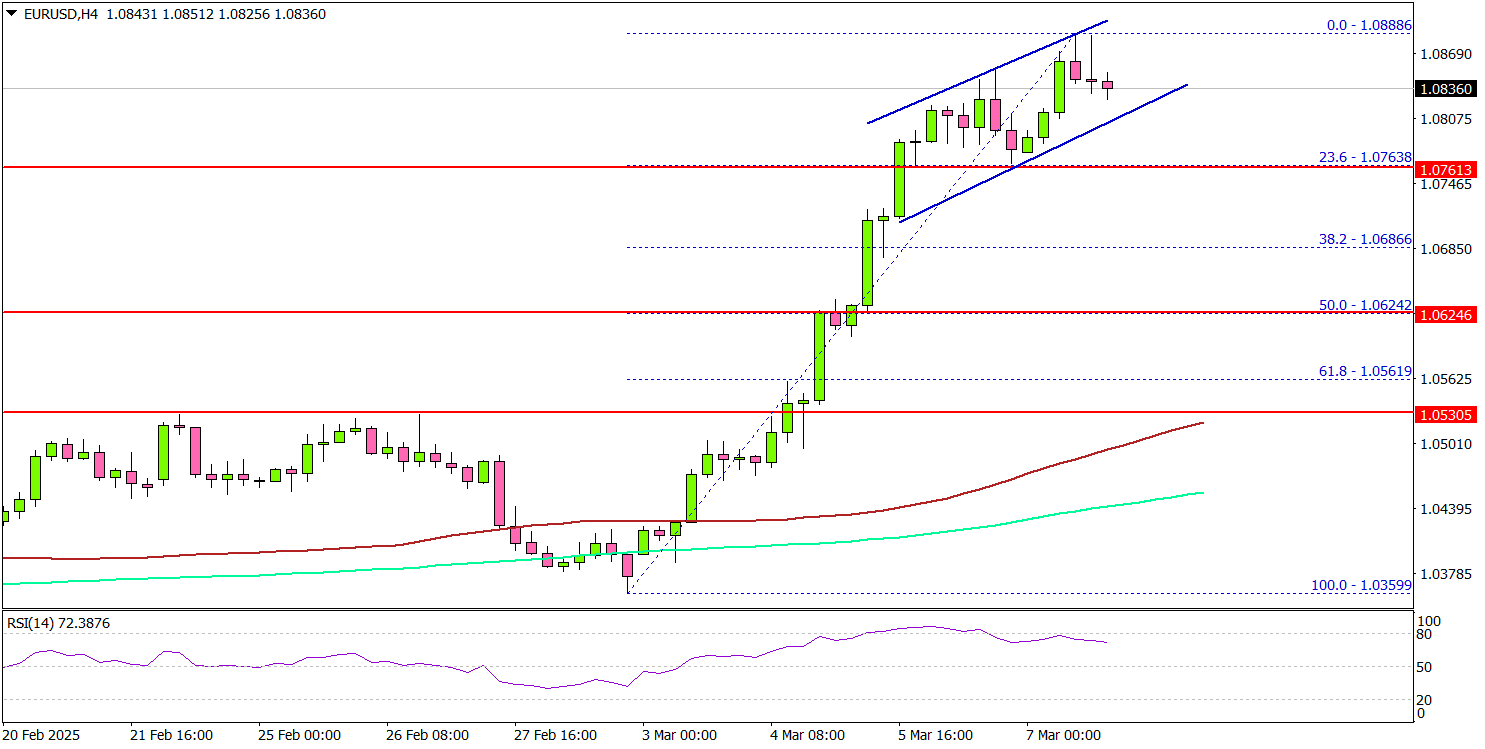
It tested the 1.0880 zone. On the upside, the pair seems to be facing hurdles near the 1.0880 level. The next major resistance is near the 1.0920 level.
The main resistance is now forming near the 1.0950 zone. Any more gains might send the pair toward the 1.1000 zone. On the downside, immediate support sits near the 1.0800 level. There is also a short-term rising channel with support at 1.0800 on the same chart.
The next key support sits near the 1.0765 level. Any more losses could send the pair toward the 1.0750 level. A close above the 1.0750 level could set the tone for another increase. In the stated case, the pair could even clear the 1.0720 resistance.
Looking at GBP/USD, the pair also started a decent increase and the pair even cleared the 1.2880 resistance zone.
Upcoming Economic Events:

Acting President Choi Sang-mok speaks during a meeting with ministers and officials on economic issues at the government complex in Seoul, March 10. Courtesy of Ministry of Economy and Finance
Acting President Choi Sang-mok on Monday instructed the government to engage with the United States to address any "misunderstandings" regarding Korea's average tariff rate on U.S. imports.
The order followed U.S. President Donald Trump's claim in his address to a joint session of Congress last week, stating that Korea's average tariff is four times higher than that of the U.S.
In a meeting with ministers and officials on economic issues, Choi ordered officials to "actively explain" any misunderstandings regarding Korea's tariff rate on U.S. imports in future talks with the United States.
The Korean government has clarified that its average tariff rate on goods imported from the U.S. was 0.79 percent last year under the bilateral free trade agreement (FTA) between the two nations, with the rate set to decrease further this year.
He also instructed officials to prepare and negotiate on matters of interest to the U.S., such as the shipbuilding and energy sectors, in ways that would benefit both countries.
Oil prices fell on Monday as concern about the impact of US import tariffs on global economic growth and fuel demand, as well as rising output from OPEC+ producers, cooled investor appetite for riskier assets.
Brent crude fell 25 cents, or 0.4%, to $70.11 a barrel by 0037 GMT after settling up 90 cents on Friday. US West Texas Intermediate crude was at $66.76 a barrel, down 28 cents, or 0.4%, after closing 68 cents higher in the previous trading session.
WTI declined for a seventh successive week, the longest losing streak since November 2023, while Brent was down for a third consecutive week after US President Donald Trump imposed then delayed tariffs on its key oil suppliers Canada and Mexico while raising taxes on Chinese goods. China retaliated against the US and Canada with tariffs on agricultural products.
"Crude oil was weighed down last week by US tariff uncertainty, US growth concerns, the potential lifting of US sanctions on Russia, and OPEC+ opting to increase output," IG analyst Tony Sycamore said in a client note.
"Nonetheless, with much of the bad news likely factored in, we expect weekly support around $65/$62 to hold firm before a recovery back to $72.00," he said in reference to the WTI price.
Oil prices clawed back some loss on Friday after Trump said the US would increase sanctions on Russia if the latter fails to reach a ceasefire with Ukraine.
The US is also studying ways to ease sanctions on Russia's energy sector if Russia agrees to end its war with Ukraine, two people familiar with the matter told Reuters.
Meanwhile, the Organization of the Petroleum Exporting Countries and allies including Russia, collectively known as OPEC+, said it will proceed with oil output hikes from April.
Russia's Deputy Prime Minister Alexander Novak on Friday said OPEC+ could reverse the decision in the event of market imbalance.
Last week, Trump said he wanted to negotiate a deal with OPEC member Iran to prevent the latter seeking nuclear weapons - though Iran has said it is not seeking such weapons.
Trump is pursuing a "maximum pressure" campaign against Iran under which the US on Saturday rescinded a waiver that allowed Iraq to pay Iran for electricity, a State Department spokesperson said.
Iran's Supreme Leader Ayatollah Ali Khamenei on Saturday said his country will not be bullied into negotiations.
Call it the Wagnerisation of US diplomacy – like the Russian mercenary group, trading military for metals. The White House’s sudden, bizarre fixation on minerals from Ukraine to Greenland to Congo makes little economic, political or security sense. But for one key person, it might be explicable.
This approach to foreign policy is not new. China has for a couple of decades sought to integrate crucial minerals overseas into its supply chains through political deals, direct ownership, supply contracts and infrastructure funding. US President Donald Trump, during his first presidential campaign, advocated seizing Iraq’s oil, saying “You win the war, and you take it”.
But for Beijing, this was just one element of engaging with other countries. Mr Trump has made this new doctrine into a core principle.
First threats to annex Greenland for its rare earths. Then, starting last month, talks to support the Democratic Republic of Congo’s president in a war against Rwanda-backed rebels in return for copper, cobalt and uranium. Finally, the hostile White House meeting where Ukraine’s President Volodymyr Zelenskyy was expected to sign over his country’s mineral wealth in return for … what exactly was not clear.
It is obligatory when discussing these minerals to note that “rare earths” are not actually that rare. What is rare are economically viable concentrations. They are hard to separate from one another, the process is polluting, and they are often mixed with thorium and uranium which would leave radioactive residues.
Only four or five of the 17 elements in the group are really industrially important. Neodymium and dysprosium, used in powerful magnets for motors in electric cars and wind turbines, are particularly critical. Attempts to develop sources outside China have mostly focused on the light rare earths, which other than neodymium are not particularly vital nor in short supply.
The term “rare earth”, though, is often carelessly used to mean “critical mineral”, a much wider group. What constitutes a critical mineral is in the eye of the beholder, with the US, EU, Japan and others issuing lengthy lists featuring more than half of the periodic table.
But materials critical for the new energy economy include lithium, cobalt, nickel, copper, silver and graphite. They are used in wiring for an increasingly electrified world, making solar panels, and the batteries that power consumer electronics, electric cars, and storage for renewable energy. Other important minerals are used in defence or industry, such as uranium, titanium and tungsten, or as fertilisers, namely potash and phosphates.
There is no firm evidence that Ukraine has any commercial rare earths. Its geological institute says it has such deposits, including neodymium, but details are classified. It does hold resources of titanium, graphite, uranium and other minerals, though, and potentially potash and phosphates. But most importantly, and what might have attracted the eye of electric car tycoon and Trump acolyte Elon Musk, is lithium.
The country holds an estimated 500,000 tonnes of lithium resources, the biggest in Europe. That is a bit less than a tenth of the reserves of Australia, the world’s largest producer, or a sixth of China’s. But one of the deposits is in a Russian-occupied area, and another was recently overrun by the Russians. The best-known site holds lithium in the mineral petalite, which requires an additional processing step to convert it into spodumene, the most commonly-used lithium ore.
Mr Musk is constructing a lithium refinery in Texas at a cost of $1 billion, to supply material for Tesla’s batteries. This centre will process spodumene. The US mines hardly any lithium itself, although new mines are under way and oil companies are looking at separating it from underground waters. In September 2020, Tesla announced a process to extract lithium from clay minerals in Nevada, but industry experts are sceptical it is economically viable.
And it is not just electric cars. SpaceX, Mr Musk’s explosive rocket venture, uses an aluminium-lithium alloy for its light weight.
There is no direct evidence that he is involved in the Ukrainian minerals negotiations. But Reuters reported that, following the rejection of the US’s demands, negotiators threatened to turn off Ukraine’s access to his Starlink system, crucial for frontline soldiers. Mr Musk vehemently denied this.
World lithium demand could triple by 2030. A new source of lithium, even if none of it comes directly to the US, would help keep prices down, and offer some diversification from Chinese sources.
But now for the flaws in this plan. For now, lithium supplies are ample, and prices for battery-grade lithium carbonate have slumped below $10,000 per tonne, from more than $78,000 in 2022. Rather than being worth the touted $500 billion, Ukraine’s lithium and other minerals may be at best modestly profitable.
Mere deposits in the ground are not of much use. Even for those that are not in an active war-zone or under hostile occupation, developing a new mine can take a decade or more. If Russia were to conquer the mineral deposits after a failed peace deal, the US would presumably be equally willing to buy from Mr Putin.
Anyway, the real bottleneck in lithium, rare earths, graphite and several other critical metals is not getting them out of the ground, but processing them into usable form.
China dominates here much more than in mining, its proprietary technologies giving it a competitive edge. Most countries do not want the polluting process on their soil. It would not help the US much to have an alternative supply of raw materials if it still needs Beijing to refine them.
In December, China banned the export of gallium and germanium, used in semiconductors, and antimony, which has military applications, to the US. In February it limited in general the export of tungsten, used to make armour-piercing munitions, and four other elements.
Attempts to extract lithium in Europe, such as in Portugal and Serbia, have faced – ironically – environmentalist opposition. So Ukraine’s resources would be more useful to Europe, which would gain a domestic source, than to the US which has its own minerals as well as easy access to mining powerhouses such as Canada and Brazil. At least, it had easy access to Canada until choosing to stir up a trade war.
Mr Zelenskyy’s original offer of mineral rights was probably a smart attempt to harness Mr Trump’s transactionalism and give him a reason to care about Ukraine’s continued security. But mercenaries are famous for seeking higher pay. Whether the business model is the Trump Organisation, Tesla or the Wagner Group, lithium is not going to propel Ukraine to peace.
Oil prices were steady on Friday but were on track to record the worst weekly loss since October on US President Donald Trump’s tariff policy and prospects of higher crude supply in the market.
Brent, the benchmark for two-thirds of the world’s oil, was trading 0.63 per cent higher at $69.90 a barrel at 11.02am UAE time. West Texas Intermediate, the gauge that tracks US crude, was up 0.63 per cent at $66.71 a barrel.
Brent, which lost about 5 per cent of its value since last Friday, dropped as low as $68.33 a barrel earlier this week, its lowest level since December 2021.
US tariffs and the Opec+ decision to boost production from April are fuelling the “bearish rout” in the oil market, FGE, an energy consultancy, said in a research note.
US President Donald Trump's tariff approach has pushed investors to the edge, with confusion over the White House's trade policy affecting market sentiment and sparking fears of an economic slowdown.
On Thursday, the US leader signed orders excluding most of the goods from Mexico and Canada from 25 per cent tariffs two days after imposing them. The amendment does not fully cover Canadian energy products, which face a separate 10 per cent tariff.
Canada, responsible for about half of US crude imports, supplied about 4 million barrels per day to its biggest market in 2024.
On Wednesday, Mr Trump granted a one-month tariff exemption to US car makers from the tariffs on Canada and Mexico, which global markets welcomed as a sign of easing trade tension.
This week, the US also imposed an additional 10 per cent tariff on China’s imports on top of an existing 10 per cent enacted last month.
“Oil markets are dealing with renewed uncertainty on the supply side and a darkening outlook on the demand side,” BMI, a Fitch company, said in a research note on Thursday.
“The ultimate impact of US tariffs on the global economy remains unclear but most see it as highly negative … broadly, the risks to oil prices remain tilted to the downside with new supply from Opec+ and non-Opec producers expected to push the market well into an oversupply,” BMI added.
On Monday, the alliance of producers said it would proceed with a “gradual and flexible” unwinding of voluntary production cuts of 2.2 million bpd starting on April 1, adding 138,000 bpd per month until September 2026.
Opec+ said the increase could be halted or reversed if market conditions deteriorate. The group is holding back 5.86 million bpd from the market as part of a series of production cuts made since 2022, representing 5.6 per cent of current global oil supply.
The International Energy Agency expects global oil supply to rise by 1.6 million bpd to 104.5 million bpd this year, while global oil demand growth is projected to average only 1.1 million bpd.
Positive sentiment was driven by the success of the DeepSeek startup, boosting Chinese tech stocks and mobile operators.
Price movements formed a bullish structure based on Fibonacci proportions.
Analysts predicted the uptrend could persist until the second half of March.
Today, the Hang Seng index (Hong Kong 50 on FXOpen) surged above the 24,500 level for the first time since February 2022. According to Reuters, investor enthusiasm for artificial intelligence continues to fuel the rally.
Technical Analysis of the Hang Seng Chart
New price data support the construction of a large-scale upward channel (marked in blue).
From a bullish perspective:
The median line of the blue channel has shifted from resistance to support (as indicated by arrows).
The price remains within the intermediate purple ascending channel.
From a bearish perspective:
The last two candlesticks show long upper wicks—an indication that sellers are active, possibly locking in profits.
The RSI indicator is forming a bearish divergence.
Given these factors, the price appears vulnerable to a pullback. However, the future trajectory will largely depend on fundamental factors, particularly the ongoing tariff tensions between China and the United States.
Trade global index CFDs with zero commission and tight spreads. Open your FXOpen account now or learn more about trading index CFDs with FXOpen.
This article represents the opinion of the Companies operating under the FXOpen brand only. It is not to be construed as an offer, solicitation, or recommendation with respect to products and services provided by the Companies operating under the FXOpen brand, nor is it to be considered financial advice.
White Label
Data API
Web Plug-ins
Poster Maker
Affiliate Program
The risk of loss in trading financial instruments such as stocks, FX, commodities, futures, bonds, ETFs and crypto can be substantial. You may sustain a total loss of the funds that you deposit with your broker. Therefore, you should carefully consider whether such trading is suitable for you in light of your circumstances and financial resources.
No decision to invest should be made without thoroughly conducting due diligence by yourself or consulting with your financial advisors. Our web content might not suit you since we don't know your financial conditions and investment needs. Our financial information might have latency or contain inaccuracy, so you should be fully responsible for any of your trading and investment decisions. The company will not be responsible for your capital loss.
Without getting permission from the website, you are not allowed to copy the website's graphics, texts, or trademarks. Intellectual property rights in the content or data incorporated into this website belong to its providers and exchange merchants.
Not Logged In
Log in to access more features

FastBull Membership
Not yet
Purchase
Log In
Sign Up