• Trade
  • Markets
  • Copy
  • Contests
  • 24/7
  • Calendar
  • Q&A
  • Chats
Screeners
SYMBOL
LAST
BID
ASK
HIGH
LOW
NET CHG.
%CHG.
SPREAD
SPX
S&P 500 Index
6960.46
6960.46
6960.46
6965.24
6905.18
+143.57
+ 2.11%
--
DJI
Dow Jones Industrial Average
48524.97
48524.97
48524.97
48553.70
48192.30
+608.39
+ 1.27%
--
IXIC
NASDAQ Composite Index
23600.21
23600.21
23600.21
23623.88
23331.50
+416.48
+ 1.80%
--
USDX
US Dollar Index
97.880
97.880
97.960
98.160
97.710
-0.270
-0.28%
--
EURUSD
Euro / US Dollar
1.17921
1.17921
1.17928
1.18109
1.17468
+0.00338
+ 0.29%
--
GBPUSD
Pound Sterling / US Dollar
1.35627
1.35627
1.35634
1.35893
1.34934
+0.00574
+ 0.43%
--
XAUUSD
Gold / US Dollar
4838.70
4838.70
4839.11
4843.26
4745.25
+97.94
+ 2.07%
--
WTI
Light Sweet Crude Oil
88.862
88.862
88.892
93.152
88.314
-3.814
-4.12%
--

Community Accounts

Signal Accounts
--
Profit Accounts
--
Loss Accounts
--
View More

Become a signal provider

Sell trading signals to earn additional income

View More

Guide to Copy Trading

Get started with ease and confidence

View More

Signal Accounts for Members

All Signal Accounts

Best Return
  • Best Return
  • Best P/L
  • Best MDD
Past 1W
  • Past 1W
  • Past 1M
  • Past 1Y

All Contests

  • All
  • Trump Updates
  • Recommend
  • Stocks
  • Cryptocurrencies
  • Central Banks
  • Featured News
Top News Only
Share

Commerzbank CEO: Germany's Economic Outlook Has Weakened

Share

U.S. Treasury Threatens Secondary Sanctions Against Financial Institutions Supporting Iran

Share

U.S. Department Of The Treasury: Negotiations For Contingent Contracts Related To Commercial Activities With The Venezuelan Government Have Been Authorized. The Authorization Covers Financial Services Transactions Involving Certain Venezuelan Banks And Officials Of The Venezuelan Government

Share

According To The Wall Street Journal, European Countries Are Drafting A Plan To Form A Broad, Multinational Alliance To Help Clear Shipping Lanes In The Strait Of Hormuz. However, The Plan Would Only Be Implemented After The War And Might Exclude The United States

Share

Argentina's National Institute Of Statistics And Censuses (INSEE) Reported That Consumer Prices Rose 3.4% Month-on-month In March. The Cumulative Inflation Rate For The 12 Months Ending In March Was 32.6%

Share

The U.S. State Department Called For A Ceasefire In Lebanon And For Measures To Address The Humanitarian Crisis. All Parties Agreed To Begin Direct Negotiations At A Mutually Agreed Time And Place

Share

The U.S. State Department Reported That Israel Reiterated Its Commitment To Cooperating With Lebanon To Disarm Non-state Terrorist Organizations And Their Infrastructure. Israel Stated Its Commitment To Resolving Outstanding Issues And Achieving Peace Through Direct Negotiations

Share

The U.S. State Department Stated That The Trilateral Talks Between The U.S., Israel, And Lebanon Discussed Steps To Initiate Direct Negotiations Between Israel And Lebanon. The U.S. Expressed Support For Further Negotiations And Indicated Its Hope That The Talks Could Extend Beyond The Scope Of The 2024 Agreement

Share

Hang Seng Index Futures Closed Up 0.88% At 26,145 Points In Overnight Trading, A Premium Of 273 Points

Share

According To Fox News: Fox News Reports That U.S. House Representative Moolenaar Has Asked Defense Secretary Hergese To Pressure Airbus Over Issues Related To Satellite Imagery

Share

Iranian MP: Will Continue To Participate In Negotiations While Foiling U.S. Plot

Share

According To An Official Cited By NBC News, During The Talks That Day, Lebanon And Israel Agreed That Hezbollah Should Be Completely Disarmed And That Iran Should No Longer Be Allowed To Influence Lebanon's Future

Share

U.S. Senate Republican Leader Thune: Most Of US Are Satisfied With The U.S.’s Achievements In Iran

Share

Ukrainian President Zelensky: We Have Not Yet Received Definite Information On When Kushner And Witkov Will Visit Ukraine

Share

U.S. Senate Republican Leader Thune: Plans To Vote On The Department Of Homeland Security Spending Outline Next Week

Share

WTI Crude Oil Fell 7% On The Day, Currently Trading At $91.19 Per Barrel. Brent Crude Oil Fell Below $92 Per Barrel, Down More Than 3% On The Day

Share

The Norwegian Government Announced That Norway And Ukraine Will Strengthen Bilateral Defense Cooperation. Ukrainian Drones Will Be Produced In Norway, Which Will Help Increase The Production Of Munitions And Air Defense Weapons For Ukraine

Share

Turkish Foreign Minister Holds Phone Conversations With Iranian And Pakistani Foreign Ministers To Discuss Iran-US Talks

Share

UAE President Discusses Middle East Situation With President Of The European Council

Share

Some AI Application Software Stocks Plunged In The Short Term, With Figma Down Nearly 6% And Adobe And TEAM Down By More Than 2%; Reports Say Anthropic Is Preparing The Opus 4.7 Model And AI Design Tools

TIME
ACT
FCST
PREV
Canada National Economic Confidence Index

A:--

F: --

P: --

Canada Building Permits MoM (SA) (Feb)

A:--

F: --

P: --
Russia Trade Balance (Feb)

A:--

F: --

P: --

U.S. Existing Home Sales Annualized MoM (Mar)

A:--

F: --

P: --
U.S. Existing Home Sales Annualized Total (Mar)

A:--

F: --

P: --
US President Trump delivered a speech
U.K. BRC Overall Retail Sales YoY (Mar)

A:--

F: --

P: --

U.K. BRC Like-For-Like Retail Sales YoY (Mar)

A:--

F: --

P: --

U.S. Treasury Secretary Bensont delivers a speech
China, Mainland Imports YoY (CNH) (Mar)

A:--

F: --

P: --

China, Mainland Trade Balance (CNH) (Mar)

A:--

F: --

P: --

China, Mainland Exports (Mar)

A:--

F: --

P: --

China, Mainland Imports (CNH) (Mar)

A:--

F: --

P: --

China, Mainland Exports YoY (USD) (Mar)

A:--

F: --

P: --

China, Mainland Imports YoY (USD) (Mar)

A:--

F: --

P: --

China, Mainland Trade Balance (USD) (Mar)

A:--

F: --

P: --

South Africa Mining Output YoY (Feb)

A:--

F: --

P: --

South Africa Gold Production YoY (Feb)

A:--

F: --

P: --

U.S. NFIB Small Business Optimism Index (SA) (Mar)

A:--

F: --

P: --

Brazil Services Growth YoY (Feb)

A:--

F: --

P: --

IEA Oil Market Report
U.S. PPI MoM (SA) (Mar)

A:--

F: --

P: --
U.S. PPI YoY (Mar)

A:--

F: --

P: --

U.S. Core PPI MoM (SA) (Mar)

A:--

F: --

P: --
U.S. Core PPI YoY (Mar)

A:--

F: --

P: --
U.S. Weekly Redbook Index YoY

A:--

F: --

P: --

World Economic Outlook
ECB Chief Economist Lane Speaks
BOE Gov Bailey Speaks
Philadelphia Fed President Paulson, Richmond Fed President Barkin, Boston Fed President Collins, and Fed Governor Barr participated in a fireside chat at the Fed Board's working forum.
Argentina CPI MoM (Mar)

A:--

F: --

P: --

U.S. API Weekly Crude Oil Stocks

--

F: --

P: --

U.S. API Weekly Gasoline Stocks

--

F: --

P: --

U.S. API Weekly Cushing Crude Oil Stocks

--

F: --

P: --

U.S. API Weekly Refined Oil Stocks

--

F: --

P: --

ECB President Lagarde Speaks
South Korea Unemployment Rate (SA) (Mar)

--

F: --

P: --

Japan Reuters Tankan Manufacturers Index (Apr)

--

F: --

P: --

Japan Reuters Tankan Non-Manufacturers Index (Apr)

--

F: --

P: --

Japan Core Machinery Orders YoY (Feb)

--

F: --

P: --

Japan Core Machinery Orders MoM (Feb)

--

F: --

P: --

Saudi Arabia CPI YoY (Mar)

--

F: --

P: --

France HICP Final MoM (Mar)

--

F: --

P: --

Euro Zone Industrial Output MoM (Feb)

--

F: --

P: --

Euro Zone Industrial Output YoY (Feb)

--

F: --

P: --
Euro Zone Total Reserve Assets (Mar)

--

F: --

P: --

India CPI YoY (Mar)

--

F: --

P: --

U.S. MBA Mortgage Application Activity Index WoW

--

F: --

P: --

Brazil Retail Sales MoM (Feb)

--

F: --

P: --

U.S. NY Fed Manufacturing Employment Index (Apr)

--

F: --

P: --

Canada Manufacturing Unfilled Orders MoM (Feb)

--

F: --

P: --

Canada Wholesale Inventory YoY (Feb)

--

F: --

P: --

Canada Wholesale Sales MoM (SA) (Feb)

--

F: --

P: --

U.S. NY Fed Manufacturing Index (Apr)

--

F: --

P: --

Canada Wholesale Inventory MoM (Feb)

--

F: --

P: --

Canada Wholesale Sales YoY (Feb)

--

F: --

P: --

U.S. Export Price Index MoM (Mar)

--

F: --

P: --

Canada Manufacturing Inventory MoM (Feb)

--

F: --

P: --

U.S. Import Price Index YoY (Mar)

--

F: --

P: --

U.S. Import Price Index MoM (Mar)

--

F: --

P: --

U.S. Export Price Index YoY (Mar)

--

F: --

P: --

Q&A with Experts
    • All
    • Chatrooms
    • Groups
    • Friends
    Matthew flag
    EuroTrader
    @Matthewhead over to indocators, then orderflow then click on cummulative volume delta to actually see it
    @EuroTraderI've seen it now thank you
    EuroTrader flag
    Matthew
    @EuroTraderthat's why you can teach me if you dont mind sir
    @Matthewill try wat i can but its not a promise or a guarantee that ill teach you
    EuroTrader flag
    Matthew
    @EuroTraderthat's why you can teach me if you dont mind sir
    @Matthewyouve gotta take it one step at a time, we cant rush everything all at once
    EuroTrader flag
    Matthew
    @EuroTraderthat's why you can teach me if you dont mind sir
    @Matthewhave you mastered the smt dvergence i actually taught you earlier?
    Matthew flag
    EuroTrader
    @Matthewyouve gotta take it one step at a time, we cant rush everything all at once
    @EuroTraderokay
    Matthew flag
    EuroTrader
    @Matthewhave you mastered the smt dvergence i actually taught you earlier?
    @EuroTraderyes am still studying it just like you explained
    Matthew flag
    EuroTrader
    @Matthewyouve gotta take it one step at a time, we cant rush everything all at once
    @EuroTraderwhen am done with the smt learning I'll tell you
    EuroTrader flag
    Matthew
    @EuroTraderyes am still studying it just like you explained
    @Matthewyou would have to finish studying and master that one before you learn new things
    horus flag
    RPGFX
    If I may ask, how long did it take you to get this done?@horus
    @RPGFXun mes lo que llevo conectado con ustedes
    EuroTrader flag
    Matthew
    @EuroTraderwhen am done with the smt learning I'll tell you
    @Matthewokay lets see how it goes, but too much information can actually get you confused
    Matthew flag
    EuroTrader
    @Matthewokay lets see how it goes, but too much information can actually get you confused
    @EuroTraderokey sir
    EuroTrader flag
    EuroTrader
    @Matthewokay lets see how it goes, but too much information can actually get you confused
    the lesser the better for you so you dont choke yourself with information you know
    horus flag
    RPGFX
    @horus I have used different brokers and they all pay me during withdrawals
    @RPGFX cuáles broker más a usado
    horus flag
    RPGFX
    Please be extremely careful my friend, I will not like you to encounter another loss@horus
    @RPGFXgracias la tendré
    horus flag
    horus
    @RPGFXgracias la tendré
    tendré cuidado amigo
    EuroTrader flag
    horus
    @RPGFX cuáles broker más a usado
    @horus not directed to me but I've use several brokers from FBS which is my first broker to vantage which am using now
    EuroTrader flag
    horus
    @RPGFX cuáles broker más a usado
    @horus how about you? what broker have you used the most while trading
    Matthew flag
    EuroTrader
    @horus how about you? what broker have you used the most while trading
    @EuroTrader currently using bee marksts
    Aman Mhone flag
    hi guys
    Aman Mhone flag
    long time no see
    Type here...
    Add Symbol or Code

      No matching data

      All
      Trump Updates
      Recommend
      Stocks
      Cryptocurrencies
      Central Banks
      Featured News
      • All
      • Russia-Ukraine Conflict
      • Middle East Flashpoint
      • All
      • Russia-Ukraine Conflict
      • Middle East Flashpoint
      Search
      Products

      Charts Free Forever

      Chats Q&A with Experts
      Screeners Economic Calendar Data Tools
      Membership Features
      Data Warehouse Market Trends Institutional Data Policy Rates Macro

      Market Trends

      Market Sentiment Order Book Forex Correlations

      Top Indicators

      Charts Free Forever
      Markets

      News

      24/7 Analysis Education

      Latest Views

      Latest Update

      Signals

      Copy Rankings Latest Signals Become a signal provider AI Rating
      Contests
      Brokers

      Overview Brokers Assessment Rankings Regulators News Claims
      Broker listing Forex Brokers Comparison Tool Live Spread Comparison Scam
      Q&A Complaint Scam Alert Videos Tips to Detect Scam
      More

      Business
      Events
      Careers About Us Advertising Help Center

      White Label

      Broker API

      Data API

      Web Plug-ins

      Affiliate Program

      Awards Institution Evaluation IB Seminar Salon Event Exhibition
      Vietnam Thailand Singapore Dubai
      Fans Party Investment Sharing Session
      FastBull Summit BrokersView Expo
      Recent Searches
        Top Searches
          Markets
          Analysis
          User
          24/7
          Economic Calendar
          Education
          Data
          • Names
          • Latest
          • Prev

          View All

          No data

          Scan to Download

          Faster Charts, Chat Faster!

          Download App
          English
          • English
          • Español
          • العربية
          • Bahasa Indonesia
          • Bahasa Melayu
          • Tiếng Việt
          • ภาษาไทย
          • Français
          • Italiano
          • Türkçe
          • Русский язык
          • 简中
          • 繁中
          Open Account
          Search
          Products
          Charts Free Forever
          Markets
          News
          Signals

          Copy Rankings Latest Signals Become a signal provider AI Rating
          Contests
          Brokers

          Overview Brokers Assessment Rankings Regulators News Claims
          Broker listing Forex Brokers Comparison Tool Live Spread Comparison Scam
          Q&A Complaint Scam Alert Videos Tips to Detect Scam
          More

          Business
          Events
          Careers About Us Advertising Help Center

          White Label

          Broker API

          Data API

          Web Plug-ins

          Affiliate Program

          Awards Institution Evaluation IB Seminar Salon Event Exhibition
          Vietnam Thailand Singapore Dubai
          Fans Party Investment Sharing Session
          FastBull Summit BrokersView Expo

          Ethereum OI Jumps +8.2% As Traders Chase The Pump: Leverage Fueling ETH Again

          NewsBTC
          Linea / USD Coin
          +3.21%
          Avantis / USD Coin
          0.00%
          Toshi / USD Coin
          -1.29%
          Avantis / Tether
          -5.98%
          Toshi / Tether
          -3.21%

          Ethereum is showing early signs of recovery after a dramatic sell-off on Friday that sent prices plunging to $3,450. The drop came amid what analysts describe as the largest liquidation event in crypto market history, wiping out billions in leveraged positions across major exchanges. While bulls briefly lost control during the panic, ETH has since begun to stabilize, with renewed buying interest emerging near key demand zones.

          Onchain analyst Maartunn highlighted that leverage is once again building up on Ethereum, signaling that traders are returning to the market following the reset. According to his data, open interest on ETH surged significantly over the past 24 hours — a sign that speculative activity is resuming as volatility cools. This renewed leverage could set the stage for another decisive move, either fueling a short-term relief rally or inviting further liquidations if momentum fades.

          The coming days will be crucial for Ethereum, as bulls attempt to reclaim the $4,000 level to confirm a sustainable recovery. Market sentiment remains cautious but optimistic, with onchain data showing large holders and institutions continuing to accumulate ETH despite recent turbulence — a potential signal of long-term confidence in the asset’s resilience.

          Leverage Returns to Ethereum: A Risky Revival In Market Activity

          According to Maartunn, Ethereum’s Open Interest has surged by +8.2% within the past 24 hours — a clear sign that leverage is flowing back into the market. This rapid rise comes just days after the largest liquidation event in crypto history, where overleveraged traders were wiped out during the sudden crash. Now, it seems many are trying to “trade their money back,” reigniting short-term volatility and speculation across exchanges.

          ETH Price and OI change | Source: Maartunn

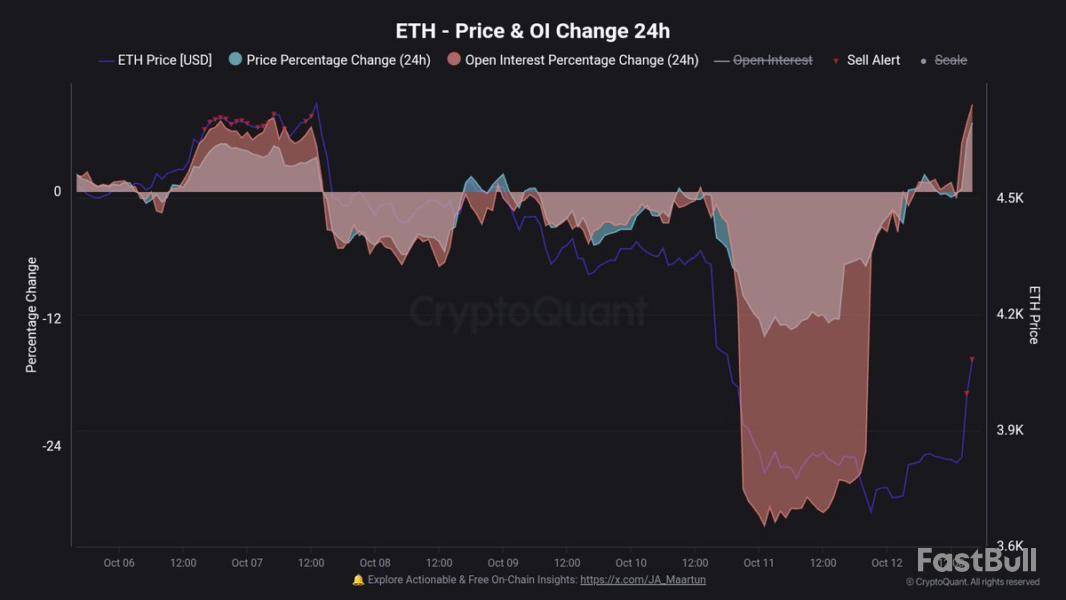
          Maartunn notes that while these so-called “revenge pumps” often create strong intraday rallies, they rarely sustain long-term momentum. Historically, around 75% of similar leverage-driven recoveries tend to revert, leading to renewed pullbacks once liquidity and funding rates normalize. Only about 25% manage to extend into lasting uptrends, typically when supported by fresh spot buying or renewed institutional inflows.

          This data underscores the precarious balance Ethereum currently faces. The jump in Open Interest signals revived market participation, but also introduces the risk of another wave of forced liquidations if traders overextend their positions. For now, ETH’s short-term recovery remains largely fueled by derivatives activity rather than spot demand.

          The next few days will be pivotal in determining Ethereum’s direction. If price holds above the $4,000 region with sustained volume, it could confirm that bulls are regaining control. However, a sudden drop in Open Interest or sharp funding spikes could signal that the rally is overextended — setting the stage for another correction.

          Ethereum Rebounds, But Resistance Looms Ahead

          Ethereum is showing a solid recovery after last week’s dramatic sell-off that drove prices down to the $3,450 level. The daily chart shows that ETH quickly rebounded from the 200-day moving average (red line), confirming it as a major area of demand. Price is now consolidating near $4,150, attempting to build momentum after a strong bullish candle on high volume — a potential sign that buyers are regaining control.

          ETH reclaims key levels | Source: ETHUSDT chart on TradingView

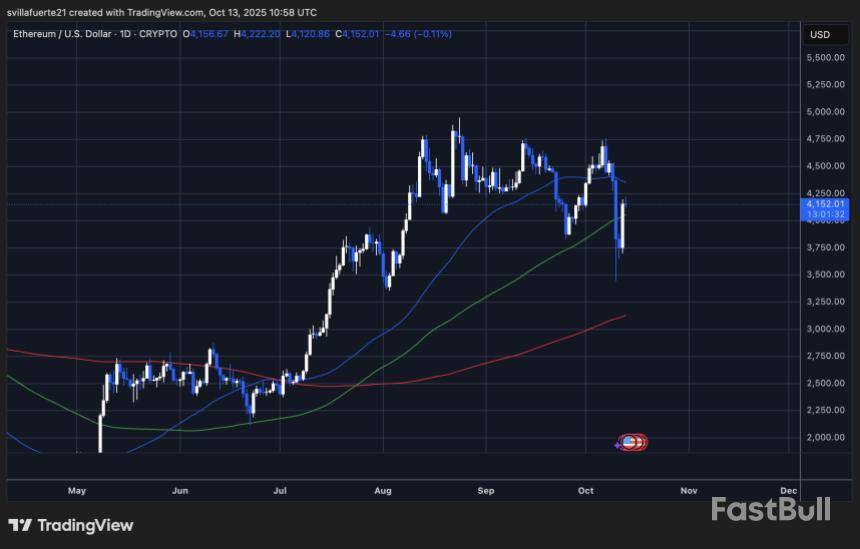
          However, ETH faces immediate resistance near the $4,250–$4,300 zone, which coincides with the 50-day moving average (blue line). This area previously acted as strong support, and reclaiming it would be essential for confirming a shift back into bullish structure. The 100-day moving average (green line) is now flattening, reflecting the market’s cautious sentiment following the massive liquidation event.

          If bulls manage to sustain price action above $4,000, the next targets lie near $4,500 and eventually $4,750. Conversely, failure to hold the 200-day MA could open the door to a deeper retest of $3,600 or lower. For now, Ethereum’s recovery remains technically constructive, but it must overcome these resistance levels to confirm that the recent rebound is more than just a short-term reaction to oversold conditions.

          Featured image from ChatGPT, chart from TradingView.com

          Risk Warnings and Disclaimers
          You understand and acknowledge that there is a high degree of risk involved in trading. Following any strategies or investment methods may lead to potential losses. The content on the site is provided by our contributors and analysts for information purposes only. You are solely responsible for determining whether any trading assets, securities, strategy, or any other product is suitable for investing based on your own investment objectives and financial situation.
          Add to Favorites
          Share
          FastBull
          Copyright © 2026 FastBull Ltd

          728 RM B 7/F GEE LOK IND BLDG NO 34 HUNG TO RD KWUN TONG KLN HONG KONG

          TelegramInstagramTwitterfacebooklinkedin
          App Store Google Play Google Play
          Products
          Charts

          Chats

          Q&A with Experts
          Screeners
          Economic Calendar
          Data
          Tools
          Membership
          Features
          Function
          Markets
          Copy Trading
          Latest Signals
          Contests
          24/7
          Analysis
          Education
          Company
          Careers
          About Us
          Contact Us
          Advertising
          Help Center
          Feedback
          User Agreement
          Privacy Policy
          Personal Information Protection Statement
          Business

          White Label

          Broker API

          Data API

          Web Plug-ins

          Poster Maker

          Affiliate Program

          Risk Disclosure

          The risk of loss in trading financial instruments such as stocks, FX, commodities, futures, bonds, ETFs and crypto can be substantial. You may sustain a total loss of the funds that you deposit with your broker. Therefore, you should carefully consider whether such trading is suitable for you in light of your circumstances and financial resources.

          No decision to invest should be made without thoroughly conducting due diligence by yourself or consulting with your financial advisors. Our web content might not suit you since we don't know your financial conditions and investment needs. Our financial information might have latency or contain inaccuracy, so you should be fully responsible for any of your trading and investment decisions. The company will not be responsible for your capital loss.

          Without getting permission from the website, you are not allowed to copy the website's graphics, texts, or trademarks. Intellectual property rights in the content or data incorporated into this website belong to its providers and exchange merchants.

          Not Logged In

          Log in to access more features

          Connect Broker
          Become a signal provider
          Help Center
          Customer Service
          Dark Mode
          Price Up/Down Colors

          Log In

          Sign Up

          Position
          Layout
          Fullscreen
          Default to Chart
          The chart page opens by default when you visit fastbull.com