• Trade
  • Markets
  • Copy
  • Contests
  • News
  • 24/7
  • Calendar
  • Q&A
  • Chats
Trending
Screeners
SYMBOL
LAST
BID
ASK
HIGH
LOW
NET CHG.
%CHG.
SPREAD
SPX
S&P 500 Index
6870.39
6870.39
6870.39
6895.79
6858.28
+13.27
+ 0.19%
--
DJI
Dow Jones Industrial Average
47954.98
47954.98
47954.98
48133.54
47871.51
+104.05
+ 0.22%
--
IXIC
NASDAQ Composite Index
23578.12
23578.12
23578.12
23680.03
23506.00
+72.99
+ 0.31%
--
USDX
US Dollar Index
98.830
98.910
98.830
98.960
98.810
-0.120
-0.12%
--
EURUSD
Euro / US Dollar
1.16543
1.16550
1.16543
1.16553
1.16341
+0.00117
+ 0.10%
--
GBPUSD
Pound Sterling / US Dollar
1.33398
1.33405
1.33398
1.33420
1.33151
+0.00086
+ 0.06%
--
XAUUSD
Gold / US Dollar
4208.54
4208.92
4208.54
4213.06
4190.61
+10.63
+ 0.25%
--
WTI
Light Sweet Crude Oil
59.867
59.904
59.867
60.063
59.752
+0.058
+ 0.10%
--

Community Accounts

Signal Accounts
--
Profit Accounts
--
Loss Accounts
--
View More

Become a signal provider

Sell trading signals to earn additional income

View More

Guide to Copy Trading

Get started with ease and confidence

View More

Signal Accounts for Members

All Signal Accounts

Best Return
  • Best Return
  • Best P/L
  • Best MDD
Past 1W
  • Past 1W
  • Past 1M
  • Past 1Y

All Contests

  • All
  • Trump Updates
  • Recommend
  • Stocks
  • Cryptocurrencies
  • Central Banks
  • Featured News
Top News Only
Share

Governor: Russian Drone Strike On Ukraine's Sumy Injures At Least Seven

Share

Inida's Nifty Psu Bank Index Down 1.3%

Share

India Markets Regulator Official: Have Created A Platform For Real Time Monitoring Of Algo Returns

Share

Cambodia Provincial Official: 3 Cambodian Civilians Seriously Injured In Thai-Cambodia Fighting

Share

Russia's Air Defences Destroy 67 Ukrainian Drones Overnight, RIA Agency Reports

Share

India's Nifty 50 Index Down 0.37%

Share

Hsi Down 287 Pts, Hsti Down 13 Pts, Pop Mart Down Over 8%, Ping An Hit New Highs

Share

China's November Coal Imports Down 20% Year-On-Year

Share

At Least One Thai Soldier Killed And 7 Wounded - Thai Army Spokesman

Share

India's Nifty Bank Futures Up 0.73% In Pre-Open Trade

Share

Cambodia Has Expanded Clashes To Several New Locations - Thai Army Spokesman

Share

Cambodian Military Has Increased Deployment Of Troops And Weapons - Thai Army Spokesman

Share

India's Nifty 50 Futures Up 0.53% In Pre-Open Trade

Share

India's Nifty 50 Index Down 0.1% In Pre-Open Trade

Share

Indian Rupee Opens Down 0.1% At 90.0625 Per USA Dollar, Versus 89.98 Previous Close

Share

China November Copper Imports At 427000 Tonnes

Share

China November Coal Imports At 44.05 Million Tonnes

Share

China November Iron Ore Imports At 110.54 Million Tonnes, Down 0.7 % From October

Share

China November Meat Imports At 393000 Tonnes

Share

China Imported 8.11 Million Tonnes Of Soy In November

TIME
ACT
FCST
PREV
U.S. Personal Income MoM (Sept)

A:--

F: --

P: --

U.S. PCE Price Index YoY (SA) (Sept)

A:--

F: --

P: --

U.S. PCE Price Index MoM (Sept)

A:--

F: --

P: --

U.S. Personal Outlays MoM (SA) (Sept)

A:--

F: --

P: --

U.S. Core PCE Price Index MoM (Sept)

A:--

F: --

P: --

U.S. Core PCE Price Index YoY (Sept)

A:--

F: --

P: --

U.S. UMich 5-Year-Ahead Inflation Expectations Prelim YoY (Dec)

A:--

F: --

P: --

U.S. Real Personal Consumption Expenditures MoM (Sept)

A:--

F: --

P: --

U.S. UMich Current Economic Conditions Index Prelim (Dec)

A:--

F: --

P: --

U.S. UMich Consumer Sentiment Index Prelim (Dec)

A:--

F: --

P: --

U.S. UMich 1-Year-Ahead Inflation Expectations Prelim (Dec)

A:--

F: --

P: --

U.S. UMich Consumer Expectations Index Prelim (Dec)

A:--

F: --

P: --

U.S. Weekly Total Rig Count

A:--

F: --

P: --

U.S. Weekly Total Oil Rig Count

A:--

F: --

P: --

U.S. Unit Labor Cost Prelim (SA) (Q3)

--

F: --

P: --

U.S. Consumer Credit (SA) (Oct)

A:--

F: --

P: --

China, Mainland Foreign Exchange Reserves (Nov)

A:--

F: --

P: --

Japan Wages MoM (Oct)

A:--

F: --

P: --

Japan Trade Balance (Oct)

A:--

F: --

P: --

Japan Nominal GDP Revised QoQ (Q3)

A:--

F: --

P: --

Japan Trade Balance (Customs Data) (SA) (Oct)

A:--

F: --

P: --

Japan GDP Annualized QoQ Revised (Q3)

A:--

F: --

P: --
China, Mainland Exports YoY (CNH) (Nov)

A:--

F: --

P: --

China, Mainland Imports YoY (CNH) (Nov)

A:--

F: --

P: --

China, Mainland Exports (Nov)

A:--

F: --

P: --

China, Mainland Imports (CNH) (Nov)

A:--

F: --

P: --

China, Mainland Trade Balance (CNH) (Nov)

A:--

F: --

P: --

China, Mainland Imports YoY (USD) (Nov)

A:--

F: --

P: --

China, Mainland Exports YoY (USD) (Nov)

A:--

F: --

P: --

China, Mainland Trade Balance (USD) (Nov)

A:--

F: --

P: --

Germany Industrial Output MoM (SA) (Oct)

--

F: --

P: --

Euro Zone Sentix Investor Confidence Index (Dec)

--

F: --

P: --

Canada Leading Index MoM (Nov)

--

F: --

P: --

Canada National Economic Confidence Index

--

F: --

P: --

U.S. Dallas Fed PCE Price Index YoY (Sept)

--

F: --

P: --

China, Mainland Trade Balance (USD) (Nov)

--

F: --

P: --

U.S. 3-Year Note Auction Yield

--

F: --

P: --

U.K. BRC Overall Retail Sales YoY (Nov)

--

F: --

P: --

U.K. BRC Like-For-Like Retail Sales YoY (Nov)

--

F: --

P: --

Australia Overnight (Borrowing) Key Rate

--

F: --

P: --

RBA Rate Statement
RBA Press Conference
Germany Exports MoM (SA) (Oct)

--

F: --

P: --

U.S. NFIB Small Business Optimism Index (SA) (Nov)

--

F: --

P: --

Mexico Core CPI YoY (Nov)

--

F: --

P: --

Mexico 12-Month Inflation (CPI) (Nov)

--

F: --

P: --

Mexico PPI YoY (Nov)

--

F: --

P: --

Mexico CPI YoY (Nov)

--

F: --

P: --

U.S. Weekly Redbook Index YoY

--

F: --

P: --

U.S. JOLTS Job Openings (SA) (Oct)

--

F: --

P: --

China, Mainland M2 Money Supply YoY (Nov)

--

F: --

P: --

China, Mainland M0 Money Supply YoY (Nov)

--

F: --

P: --

China, Mainland M1 Money Supply YoY (Nov)

--

F: --

P: --

U.S. EIA Short-Term Crude Production Forecast For The Next Year (Dec)

--

F: --

P: --

U.S. EIA Short-Term Crude Production Forecast For The Year (Dec)

--

F: --

P: --

U.S. EIA Natural Gas Production Forecast For The Next Year (Dec)

--

F: --

P: --

EIA Monthly Short-Term Energy Outlook
U.S. 10-Year Note Auction Avg. Yield

--

F: --

P: --

U.S. API Weekly Cushing Crude Oil Stocks

--

F: --

P: --

U.S. API Weekly Crude Oil Stocks

--

F: --

P: --

Q&A with Experts
    • All
    • Chatrooms
    • Groups
    • Friends
    Connecting
    .
    .
    .
    Type here...
    Add Symbol or Code

      No matching data

      All
      Trump Updates
      Recommend
      Stocks
      Cryptocurrencies
      Central Banks
      Featured News
      • All
      • Russia-Ukraine Conflict
      • Middle East Flashpoint
      • All
      • Russia-Ukraine Conflict
      • Middle East Flashpoint
      Search
      Products

      Charts Free Forever

      Chats Q&A with Experts
      Screeners Economic Calendar Data Tools
      Membership Features
      Data Warehouse Market Trends Institutional Data Policy Rates Macro

      Market Trends

      Market Sentiment Order Book Forex Correlations

      Top Indicators

      Charts Free Forever
      Markets

      News

      News Analysis 24/7 Columns Education
      From Institutions From Analysts
      Topics Columnists

      Latest Views

      Latest Views

      Trending Topics

      Top Columnists

      Latest Update

      Signals

      Copy Rankings Latest Signals Become a signal provider AI Rating
      Contests
      Brokers

      Overview Brokers Assessment Rankings Regulators News Claims
      Broker listing Forex Brokers Comparison Tool Live Spread Comparison Scam
      Q&A Complaint Scam Alert Videos Tips to Detect Scam
      More

      Business
      Events
      Careers About Us Advertising Help Center

      White Label

      Data API

      Web Plug-ins

      Affiliate Program

      Awards Institution Evaluation IB Seminar Salon Event Exhibition
      Vietnam Thailand Singapore Dubai
      Fans Party Investment Sharing Session
      FastBull Summit BrokersView Expo
      Recent Searches
        Top Searches
          Markets
          News
          Analysis
          User
          24/7
          Economic Calendar
          Education
          Data
          • Names
          • Latest
          • Prev

          View All

          No data

          Scan to Download

          Faster Charts, Chat Faster!

          Download App
          English
          • English
          • Español
          • العربية
          • Bahasa Indonesia
          • Bahasa Melayu
          • Tiếng Việt
          • ภาษาไทย
          • Français
          • Italiano
          • Türkçe
          • Русский язык
          • 简中
          • 繁中
          Open Account
          Search
          Products
          Charts Free Forever
          Markets
          News
          Signals

          Copy Rankings Latest Signals Become a signal provider AI Rating
          Contests
          Brokers

          Overview Brokers Assessment Rankings Regulators News Claims
          Broker listing Forex Brokers Comparison Tool Live Spread Comparison Scam
          Q&A Complaint Scam Alert Videos Tips to Detect Scam
          More

          Business
          Events
          Careers About Us Advertising Help Center

          White Label

          Data API

          Web Plug-ins

          Affiliate Program

          Awards Institution Evaluation IB Seminar Salon Event Exhibition
          Vietnam Thailand Singapore Dubai
          Fans Party Investment Sharing Session
          FastBull Summit BrokersView Expo

          Bitcoin Price Could Explode After June 11 CPI Report, Says Analyst

          Glendon

          Economic

          Forex

          Summary:

          Bitcoin could be on the verge of a massive breakout, according to popular crypto analyst Doctor Profit, who predicts a potential price surge of up to 170% in the coming months.

          Bitcoin could be on the verge of a massive breakout, according to popular crypto analyst Doctor Profit, who predicts a potential price surge of up to 170% in the coming months. With a Golden Cross formation, key support near $100K, and a pivotal CPI inflation report just days away, the market may be heading for explosive gains.

          Bitcoin Eyes Breakout as Key Resistance Is Tested

          At the start of June, Bitcoin was trading at $104,588.85, but briefly dipped 4.10% between June 3–5. However, it bounced back sharply from $100,400 on June 6, rising 2.74% in a single day. Since then, BTC has gained another 5.07%, currently sitting around $106,663.68.

          Doctor Profit shared on X (formerly Twitter) that Bitcoin is attempting to break a diagonal resistance line—a move he believes could launch BTC into a new all-time high soon.

          “A confirmed Golden Cross and strong $100K support signal a bullish breakout. BTC could rise 70–170% if macro factors align,” he wrote.

          Why CPI Inflation Data Could Make or Break BTC Rally

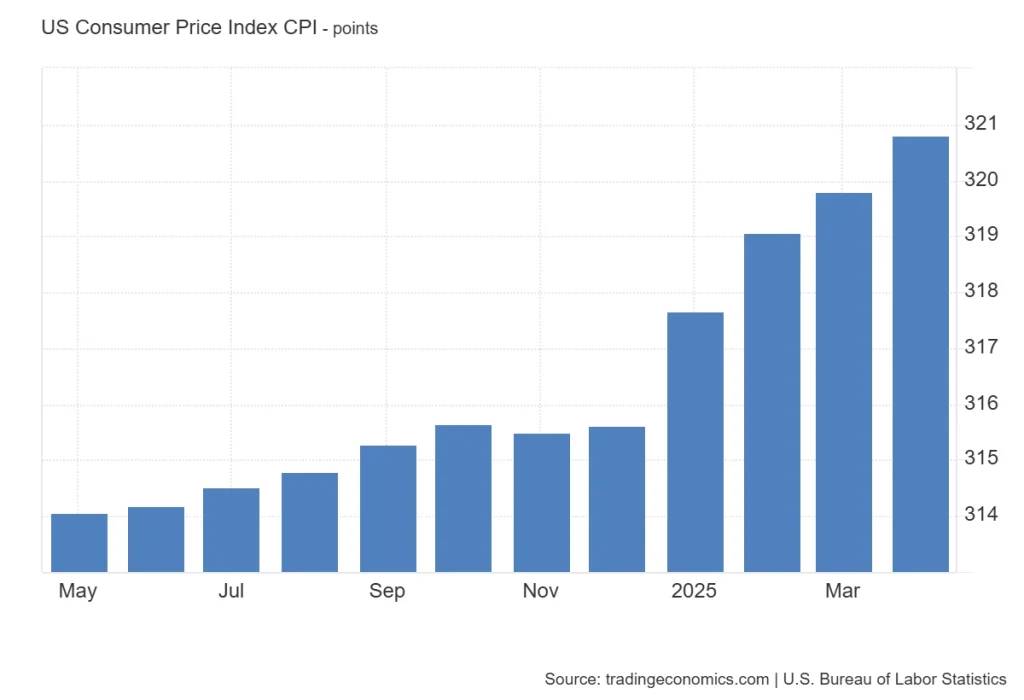
          All eyes are on the U.S. Consumer Price Index (CPI) data release scheduled for June 11, 2025. In April, CPI rose from 319.799 to 320.795 points. This month, it's projected to reach 321.9, according to TEForecast.

          More importantly, the U.S. inflation rate, which dropped to 2.3% in April, is expected by Wall Street to rise slightly to 2.5%. However, Doctor Profit believes the number could surprise to the downside—possibly between 2.1% and 2.3%. A lower-than-expected CPI could spark optimism, increasing chances of a Fed rate cut—a bullish catalyst for Bitcoin.

          Next Bitcoin Price Target: $108K–$110K?

          Doctor Profit also notes a liquidity cluster between $108K and $110K, which may be BTC's next short-term target before a bigger breakout. If Bitcoin pushes through that zone, it could open the path for a sustained rally.

          Source: CryptoSlate

          To stay updated on all economic events of today, please check out our Economic calendar
          Risk Warnings and Disclaimers
          You understand and acknowledge that there is a high degree of risk involved in trading. Following any strategies or investment methods may lead to potential losses. The content on the site is provided by our contributors and analysts for information purposes only. You are solely responsible for determining whether any trading assets, securities, strategy, or any other product is suitable for investing based on your own investment objectives and financial situation.
          Add to Favorites
          Share

          ECB to Continue Cutting Rates in Second Half Of 2025: Barclays

          Michelle

          Economic

          Forex

          The European Central Bank is likely to continue cutting interest rates in the second half of 2025, according to analysts at Barclays.

          Despite President Christine Lagarde’s signal that the current monetary easing cycle may be nearing its end, Barclays expects two additional 25-basis-point reductions at the ECB’s September and December meetings. This would bring the deposit facility rate down to 1.5% by year-end.

          At its June meeting, the ECB lowered policy rates by 25 basis points, citing lower inflation projections.

          However, Lagarde struck a more hawkish tone than expected, stating, “We are getting to the end of the monetary policy cycle,” and dismissed inflation undershoots in 2026 as largely driven by energy prices and currency effects.

          Barclays analysts believe that, despite the rhetoric, a majority on the Governing Council will support further easing based on current economic and inflation data.

          Headline inflation dropped to 1.9% year-on-year in May, below the ECB’s 2% medium-term target. Core inflation also eased, falling to 2.3% from 2.7% the previous month.

          Services inflation saw a notable decline, partly reversing holiday-related price spikes. Barclays’ inflation tracker projects headline inflation will stay below target through 2026, bottoming at 1.4% in early 2026 and settling at 1.7% later that year. This path is broadly consistent with updated ECB staff forecasts.

          On the growth front, euro area GDP expanded 0.6% quarter-on-quarter in the first quarter, but this figure was inflated by a 9.7% surge in Irish GDP, which reflects multinational activity rather than domestic demand.

          Excluding Ireland, the euro area grew 0.3%. Barclays noted that the boost from U.S. firms’ front-loading purchases ahead of tariffs, which temporarily lifted exports, is already fading.

          Recent data suggest a slowdown in activity. April industrial production declined across Germany, France and Spain, while factory orders in Germany rose only on the back of strength in two volatile sectors.

          Services and retail data were more stable, and the unemployment rate fell slightly in April. Still, Barclays sees overall momentum as weak.

          Barclays also questioned the ECB’s baseline growth assumptions, which remain unchanged for 2025 at 0.9% and were revised only slightly downward for 2026.

          Analysts said these appear optimistic in light of persistent economic headwinds and delays in fiscal stimulus, especially in Germany, where tax reforms and infrastructure spending are expected to have more impact after 2027.

          While the ECB maintains a meeting-by-meeting approach, Barclays sees sufficient evidence for continued policy easing.

          Analysts argue that the projected inflation undershoot, combined with fragile growth, supports further rate cuts even if the central bank refrains from signaling them in advance.

          Source: Investing

          To stay updated on all economic events of today, please check out our Economic calendar
          Risk Warnings and Disclaimers
          You understand and acknowledge that there is a high degree of risk involved in trading. Following any strategies or investment methods may lead to potential losses. The content on the site is provided by our contributors and analysts for information purposes only. You are solely responsible for determining whether any trading assets, securities, strategy, or any other product is suitable for investing based on your own investment objectives and financial situation.
          Add to Favorites
          Share

          U.S. Pours Billions into Reviving Shipbuilding to Counter China: 5x the Cost, Less than 1% Output—Is It Too Late?

          Gerik

          Economic

          China–U.S. Trade War

          Strategic Urgency: Why the U.S. is Betting Big on Domestic Shipbuilding

          President Trump and a bipartisan group in Congress are pushing for a full-scale revival of the U.S. shipbuilding industry, aiming to counter China's overwhelming dominance in global ship production. China has delivered nearly half of all commercial ships over the past decade, while the U.S. has built only 37.
          Reviving this sector will require more than policy—it demands a long-term commitment to investment. A key testing ground is the Hanwha Philly Shipyard in Philadelphia, recently acquired by South Korean industrial giant Hanwha. CEO David Kim insists the facility is ready to scale up, but only if it gets consistent orders and government support.

          Policy Moves: Heavy Subsidies, Penalties for Foreign Ships, U.S.-First Mandates

          Trump recently signed an executive order aimed at restoring American shipbuilding, pledging massive spending. The U.S. Trade Representative's office followed up with rules penalizing Chinese-built vessels and requiring certain commercial ships to be built domestically.
          Congress is drafting a major bill to subsidize a 250-vessel “Strategic Commercial Fleet,” built in the U.S. and crewed by Americans, which could be deployed for national defense logistics. The bill also offers financial incentives to offset the high cost of U.S. labor and production, aiming to both stabilize orders and encourage industrial growth.

          David vs. Goliath: America's Late Start Against China's Shipyard Juggernaut

          In sheer numbers, the U.S. is trailing badly. Chinese shipyards delivered 6,765 commercial vessels over the past decade, while the U.S. managed fewer than 40. Even Japan and South Korea remain far ahead. Hanwha’s shipyard in Philadelphia, for example, produces just 1.5 ships a year, while its South Korean facilities build one per week.
          Cost disparities are staggering. A Jones Act-compliant container ship built in the U.S. costs roughly $330 million, versus $70 million in Asia. The Jones Act requires vessels transporting goods between U.S. ports to be American-built, but critics argue this inflates costs without creating competitive scale.

          Revival Dreams Meet Labor Reality

          Even if Hanwha can transfer advanced technology to its U.S. shipyard, finding skilled labor is a major bottleneck. The company hopes to double its workforce from 1,500 in less than 10 years, and increase apprentices to 240 next year. But worker retention remains a serious issue—many leave within their first year.
          Union leaders and defense officials support training programs to build a long-term maritime workforce. Maritime officers on U.S. international routes can earn over $200,000 per year and retire after two decades, making it a potentially lucrative career. Still, attracting and retaining workers in this demanding industry is a hurdle.

          Not Just Business—A National Strategy

          Supporters argue this is more than an economic initiative—it’s a national security imperative. With China subsidizing its shipbuilding at scale, U.S. policymakers see domestic shipyards as critical infrastructure. New Trump-era rules will require an increasing share of LNG carriers to be U.S.-built in the coming years, adding urgency.
          While critics suggest outsourcing to allies like Japan or South Korea would be more cost-effective, Hanwha’s Kim contends that outsourcing has weakened American industry. “This is about more than business,” he said. “It’s about national priorities, labor, and strategic choices.”
          America’s attempt to rebuild its shipbuilding capability from near collapse is a massive undertaking—financially, industrially, and politically. With China advancing at high speed, the U.S. is betting on protectionism, patriotism, and persistence. Whether this strategy pays off remains uncertain, but Washington has made it clear: losing the seas is not an option.

          Source: The New York Times

          To stay updated on all economic events of today, please check out our Economic calendar
          Risk Warnings and Disclaimers
          You understand and acknowledge that there is a high degree of risk involved in trading. Following any strategies or investment methods may lead to potential losses. The content on the site is provided by our contributors and analysts for information purposes only. You are solely responsible for determining whether any trading assets, securities, strategy, or any other product is suitable for investing based on your own investment objectives and financial situation.
          Add to Favorites
          Share

          Rare-Earth Shock Sends Auto Industry into Crisis Mode as Supply Chains Teeter Again

          Gerik

          Economic

          China–U.S. Trade War

          Industry Panic Echoes Pandemic-Era Disruptions

          Global automakers are facing their third major supply chain crisis in five years. After the COVID-19 pandemic and the semiconductor shortage, China’s tightening of rare-earth exports has now sparked what executives describe as full-blown panic. Car factories across Europe are already pausing production due to a shortage of rare-earth magnets—essential components used in electric motors and a wide range of vehicle systems.
          Frank Eckard, CEO of German magnet supplier Magnosphere, reported desperate calls from automakers seeking alternative magnet sources, some warning of factory shutdowns as early as July. With Beijing holding a near-monopoly over global rare-earth refining and magnet production, many fear the industry is once again at the mercy of geopolitics.

          China's Grip on Rare Earths Paralyzes Global Production

          Rare-earth elements like neodymium, praseodymium, and dysprosium are critical for producing permanent magnets, used in everything from EV motors to braking sensors and speakers. China controls about 70% of global mining, 85% of refining, and 90% of magnet production, according to AlixPartners. This dominance leaves the automotive sector extremely exposed.
          Although President Trump claimed a recent agreement with President Xi would allow rare-earth shipments to the U.S. to resume, the global situation remains tense. Hundreds of export permit applications are under review in China, and with limited transparency, many auto suppliers are in the dark about when or whether critical shipments will resume.

          Auto Supply Chains Remain Vulnerable Despite Past Lessons

          Despite lessons from the COVID-19 and chip crises, the sector has not made meaningful structural changes. Just-in-time inventory strategies—while cost-efficient—have left automakers with little buffer. Frank Eckard criticized the industry for its lack of preparedness: “Nobody has learned from the past.”
          The European Association of Automotive Suppliers (CLEPA) confirmed that multiple plants have already been forced offline. CLEPA’s Secretary-General warned that the impact will “confront everyone” as magnet shortages ripple through the broader industry.

          Race for Rare-Earth Alternatives Gains Momentum

          Some manufacturers have accelerated R&D efforts to create rare-earth-free motors and magnets. BMW, GM, ZF, and BorgWarner are developing alternatives, but most are still years away from large-scale, cost-effective production. U.S.-based Niron Magnetics, which raised $250 million from Stellantis, Magna, and GM, plans to launch a rare-earth-free magnet factory in 2029. Warwick Acoustics is introducing rare-earth-free speakers in luxury cars later this year.
          However, these developments won’t solve the immediate crisis. European magnet recycling efforts remain underutilized—Heraeus’ facility is running at just 1% capacity and faces closure next year due to low sales and competition from cheaper Chinese products.

          Short-Term Solutions: Hoarding and Partial Production

          With viable near-term alternatives lacking, automakers are reverting to crisis playbooks developed during the chip shortage. Some companies are considering producing vehicles without certain components and stockpiling them until parts arrive. Mercedes-Benz, among others, is negotiating with suppliers to build magnet stockpiles.
          The European Union’s Critical Raw Materials Act aims to reduce dependency on China, but experts like Noah Barkin of Rhodium Group say efforts have been too slow to respond to current bottlenecks.

          Geopolitical Risk Spills into Broader Raw Materials

          Rare earths are only part of the broader strategic materials problem. The European Commission warns that China controls over 50% of global supply for 19 critical raw materials, including graphite, aluminum, and manganese. Andy Leyland of SC Insights sees China’s actions as a “warning shot” that any of these resources could be used for future leverage.
          The rare-earths crisis exposes the fragile foundation of today’s global auto supply chains. Despite efforts to regionalize or diversify sourcing after the pandemic and chip disruptions, the reliance on Chinese production for key inputs remains alarmingly high. Without accelerated investment in alternative magnet technologies and localized supply chains, the industry risks deeper disruptions in the face of future geopolitical tensions.
          The scramble for rare earths is not just a supply hiccup—it’s a strategic reckoning.

          Source: Reuters

          To stay updated on all economic events of today, please check out our Economic calendar
          Risk Warnings and Disclaimers
          You understand and acknowledge that there is a high degree of risk involved in trading. Following any strategies or investment methods may lead to potential losses. The content on the site is provided by our contributors and analysts for information purposes only. You are solely responsible for determining whether any trading assets, securities, strategy, or any other product is suitable for investing based on your own investment objectives and financial situation.
          Add to Favorites
          Share

          GBPUSD Edges Higher, EURGBP Hits Support

          Blue River

          Forex

          Technical Analysis

          GBP/USD is attempting a fresh increase above the 1.3500 resistance. EUR/GBP declined steadily below the 0.8440 and 0.8430 support levels.

          Important Takeaways for GBP/USD and EUR/GBP Analysis Today

          ● The British Pound is attempting a fresh increase above 1.3515.

          ● There was a break above a key bearish trend line with resistance at 1.3535 on the hourly chart of GBP/USD.

          ● EUR/GBP is trading in a bearish zone below the 0.8450 pivot level.

          ● There is a connecting bullish trend line forming with support at 0.8415 on the hourly chart.

          GBP/USD Technical Analysis

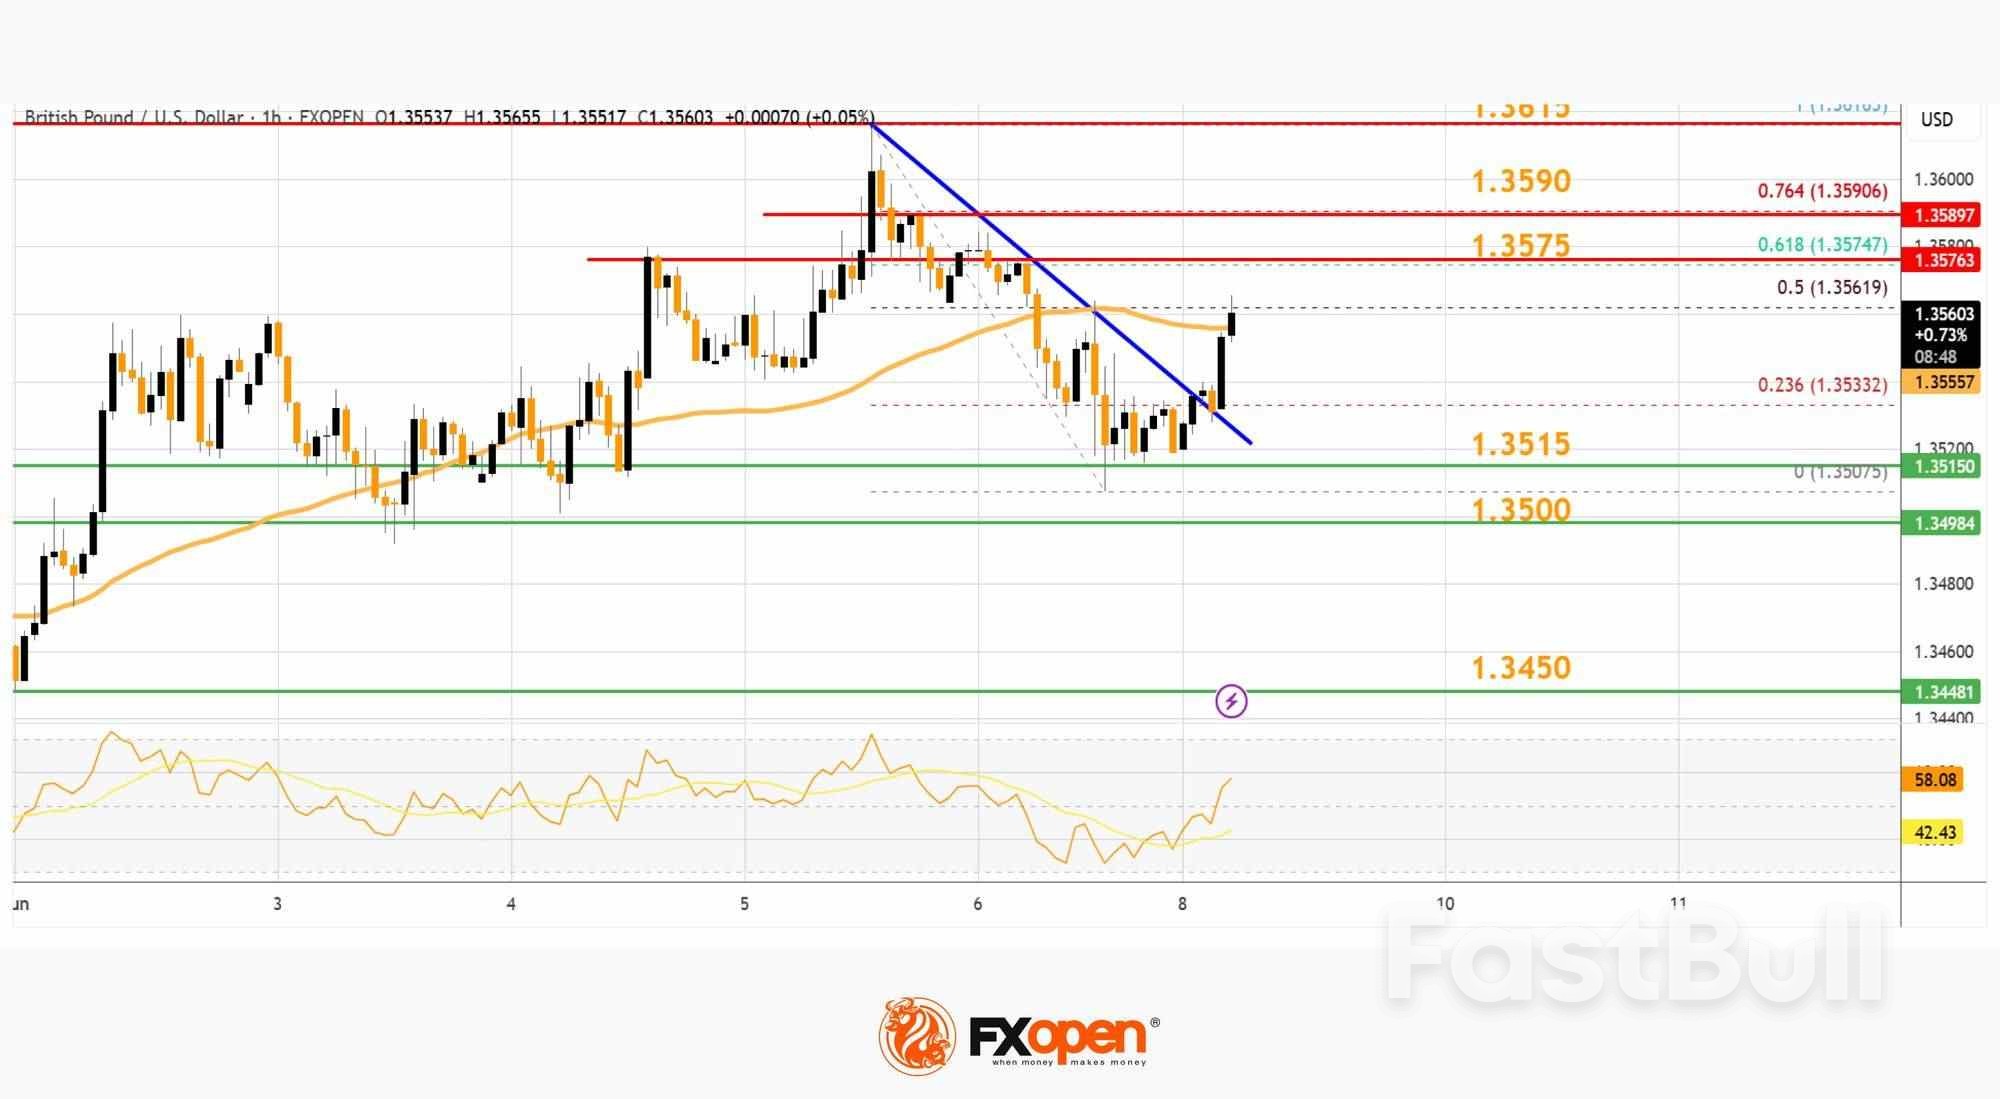
          On the hourly chart of GBP/USD, the pair declined after it failed to clear the 1.3615 resistance. The British Pound even traded below the 1.3575 support against the US Dollar.

          Finally, the pair tested the 1.3500 zone and is currently attempting a fresh increase. The bulls were able to push the pair above the 50-hour simple moving average and 1.3540. There was a break above a key bearish trend line with resistance at 1.3535.

          The pair tested the 50% Fib retracement level of the downward move from the 1.3616 swing high to the 1.3507 low. It is now showing positive signs above 1.3540.

          On the upside, the GBP/USD chart indicates that the pair is facing resistance near 1.3575 and the 61.8% Fib retracement level of the downward move from the 1.3616 swing high to the 1.3507 low.

          The next major resistance is near 1.3590. A close above the 1.3590 resistance zone could open the doors for a move toward 1.3615. Any more gains might send GBP/USD toward 1.3650.

          On the downside, immediate support is near the 1.3515. If there is a downside break below 1.3515, the pair could accelerate lower. The first major support is near the 1.3500 level. The next key support is seen near 1.3450, below which the pair could test 1.3420. Any more losses could lead the pair toward the 1.3350 support.

          EUR/GBP Technical Analysis

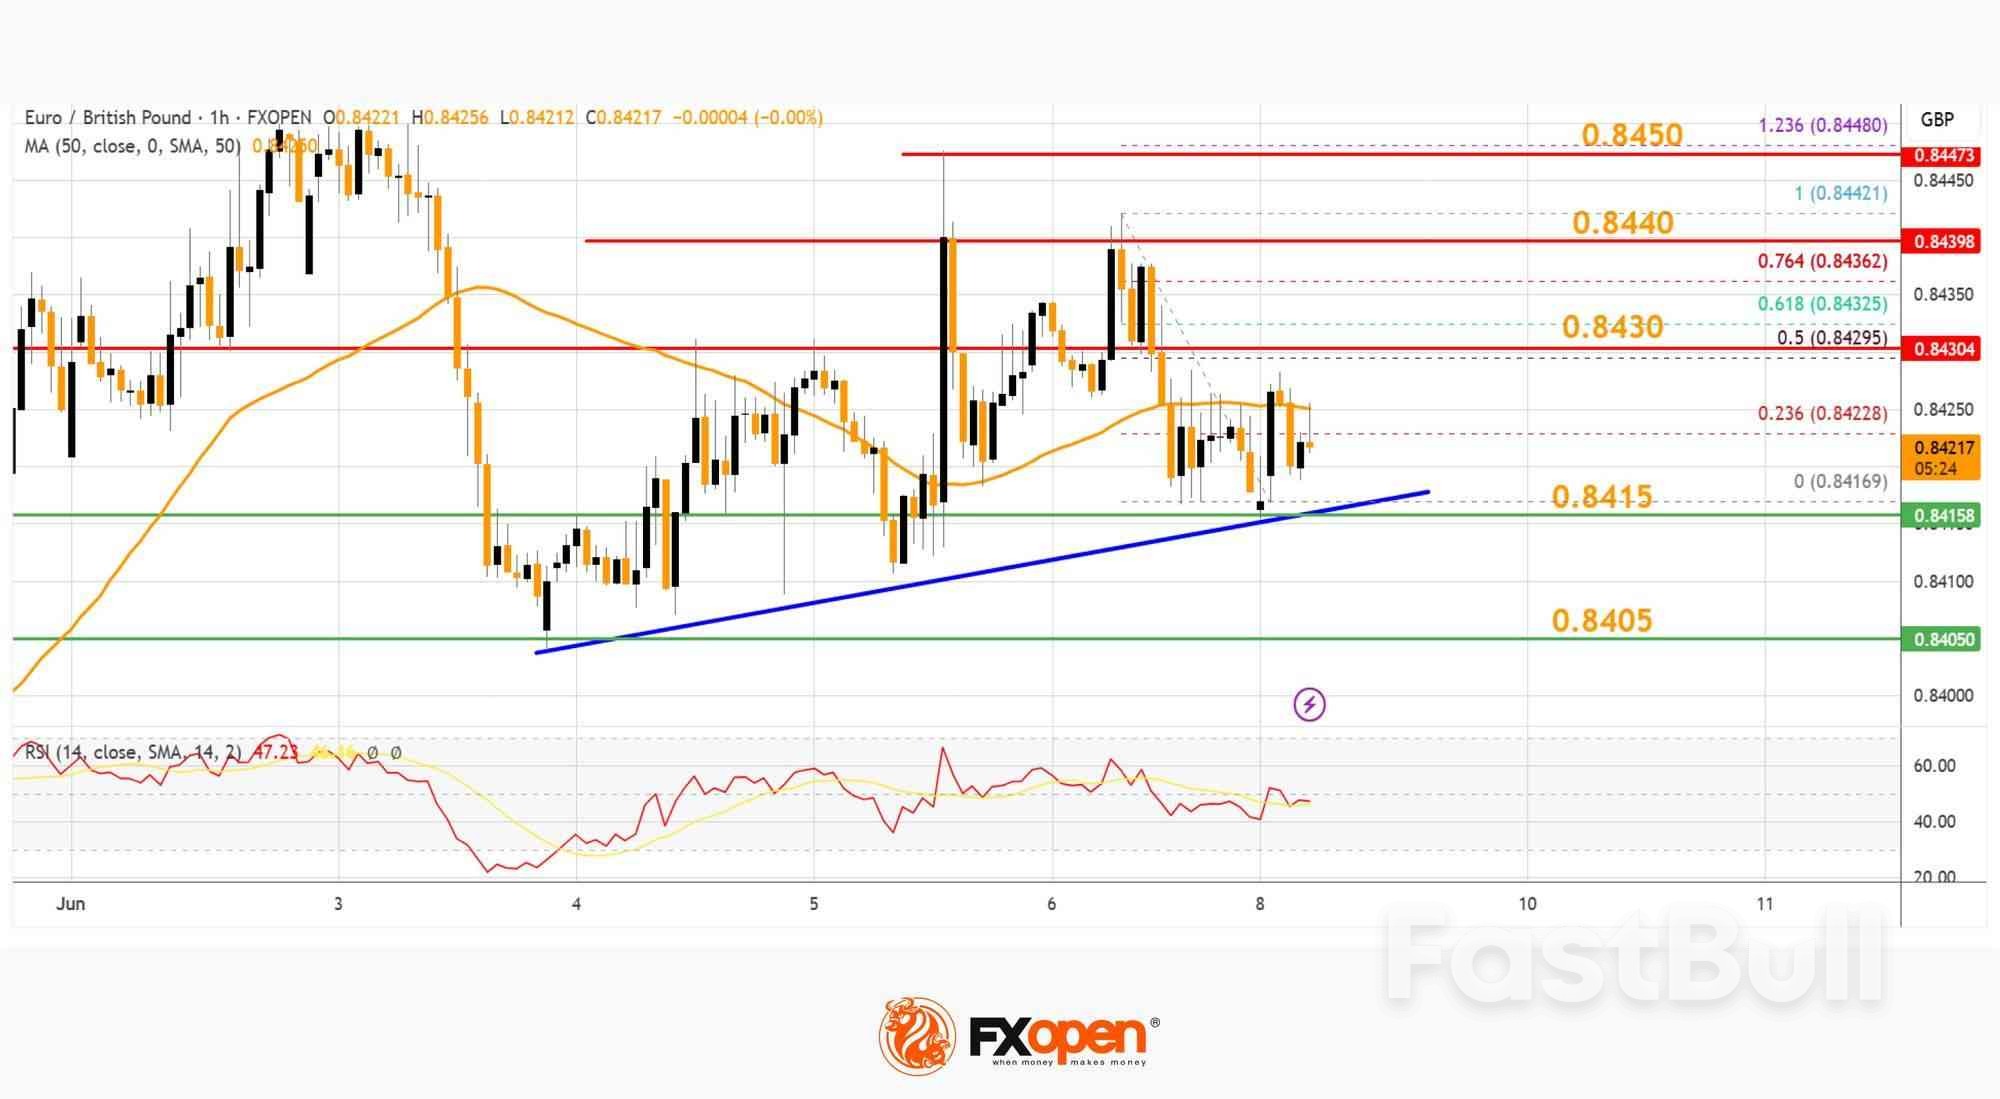
          On the hourly chart of EUR/GBP, the pair started a fresh decline from well above 0.8460. The Euro traded below the 0.8440 and 0.8430 support levels against the British Pound.

          The EUR/GBP chart suggests that the pair even declined below the 0.8420 level and tested 0.8415. It is now consolidating losses and trading below the 50-hour simple moving average. However, there is a connecting bullish trend line forming with support at 0.8415.

          The pair is now facing resistance near the 50% Fib retracement level of the downward move from the 0.8442 swing high to the 0.8416 low at 0.8430.

          The next major resistance could be 0.8440. The main resistance is near the 0.8450 zone. It coincides with the 1.236 Fib extension level of the downward move from the 0.8442 swing high to the 0.8416 low.

          A close above the 0.8450 level might accelerate gains. In the stated case, the bulls may perhaps aim for a test of 0.8480. Any more gains might send the pair toward the 0.8500 level.

          Immediate support sits near 0.8415. The next major support is near 0.8405. A downside break below the 0.8405 support might call for more downsides. In the stated case, the pair could drop toward the 0.8380 support level.

          Source: FXOpen

          Risk Warnings and Disclaimers
          You understand and acknowledge that there is a high degree of risk involved in trading. Following any strategies or investment methods may lead to potential losses. The content on the site is provided by our contributors and analysts for information purposes only. You are solely responsible for determining whether any trading assets, securities, strategy, or any other product is suitable for investing based on your own investment objectives and financial situation.
          Add to Favorites
          Share

          China's May Exports Slow, Deflation Deepens As Tariffs Bite

          Glendon

          Economic

          Forex

          China's export growth slowed to a three-month low in May as U.S. tariffs slammed shipments, while factory-gate deflation deepened to its worst level in two years, heaping pressure on the world's second-largest economy on both the domestic and external fronts.

          U.S. PresidentDonald Trump'sglobaltrade warand the swings in Sino-U.S. trade ties have in the past two months sent Chinese exporters, along with their business partners across the Pacific, on a roller coaster ride and hobbled world growth.

          Underscoring the U.S. tariff impact on shipments, customs data showed that China's exports to the U.S. plunged 34.5% year-on-year in May in value terms, the sharpest drop since February 2020, when the outbreak of the COVID-19 pandemic upended global trade.

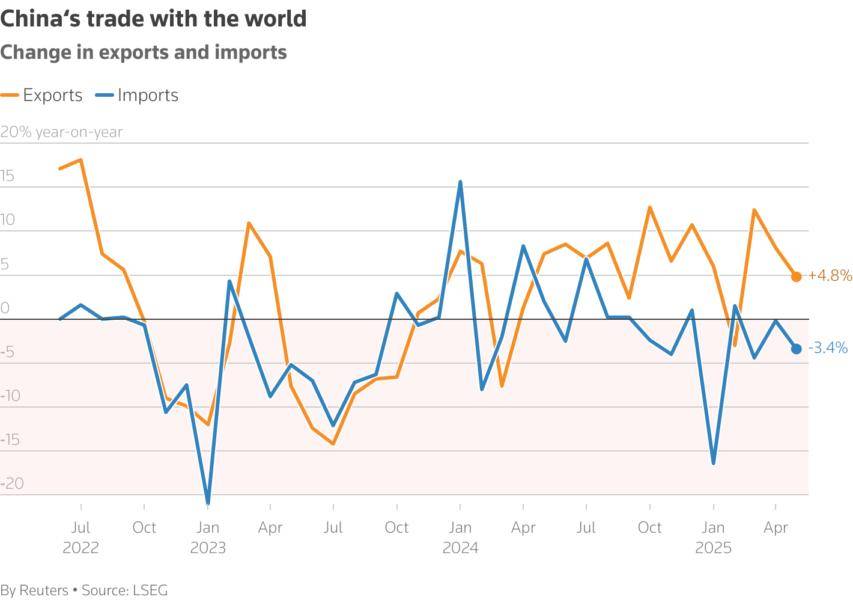
          Total exports from the Asian economic giant expanded 4.8% year-on-year in value terms last month, slowing from the 8.1% jump in April and missing the 5.0% growth expected in a Reuters poll, customs data showed on Monday, despite a lowering of U.S. tariffs on Chinese goods which had taken effect in early April.

          "It's likely that the May data continued to be weighed down by the peak tariff period," said Lynn Song, chief economist for Greater China at ING.

          Song said there was still front-loading of shipments due to the tariff risks, while acceleration of sales to regions other than the United States helped to underpin China's exports.

          Imports dropped 3.4% year-on-year, deepening from the 0.2% decline in April and worse than the 0.9% downturn expected in the Reuters poll.

          Exports had surged 12.4% year-on-year and 8.1% in March and April, respectively, as factories rushed shipments to the U.S. and other overseas manufacturers to avoid Trump's hefty levies on China and the rest of the world.

          While exporters in China found some respite in May as Beijing and Washington agreed to suspend most of their levies for 90 days, tensions between the world's two largest economies remain high and negotiations are underway over issues ranging from China's rare earths controls to Taiwan.

          Trade representatives from China and the U.S. are meeting in London on Monday to resume talks after a phone call between their top leaders on Thursday.

          China's imports from the U.S. also lost further ground, dropping 18.1% from a 13.8% slide in April.

          Zichun Huang, economist at Capital Economics, expects the slowdown in exports growth to "partially reverse this month, as it reflects the drop in U.S. orders before the trade truce," but cautions that shipments will be knocked again by year-end due to elevated tariff levels.

          China's exports of rare earths jumped sharply in May despite export restrictions on certain types of rare earth products causing plant closures across the global auto supply chain.

          The latest figures do not distinguish between the 17 rare earth elements and related products, some of which are not subject to restrictions. A clearer picture of the impact of the curbs on exports will only be available when more detailed data is released on June 20.

          China's May trade surplus came in at $103.22 billion, up from the $96.18 billion the previous month.

          Other data, also released on Monday, showed China's imports of crude oil, coal, and iron ore dropped last month, underlining the fragility of domestic demand at a time of rising external headwinds.

          Beijing in May rolled out a series of monetary stimulus measures, including cuts to benchmark lending rates and a 500 billion yuan low-cost loan program, aimed at cushioning the trade war's blow to the economy.

          China's markets showed muted reaction to the data. The blue-chip CSI300 Indexclimbed 0.29% and the benchmark Shanghai Composite Indexwas up 0.43%.

          DEFLATIONARY PRESSURES

          Producer and consumer price data, released by the National Bureau of Statistics on the same day, showed that deflationary pressures worsened last month.

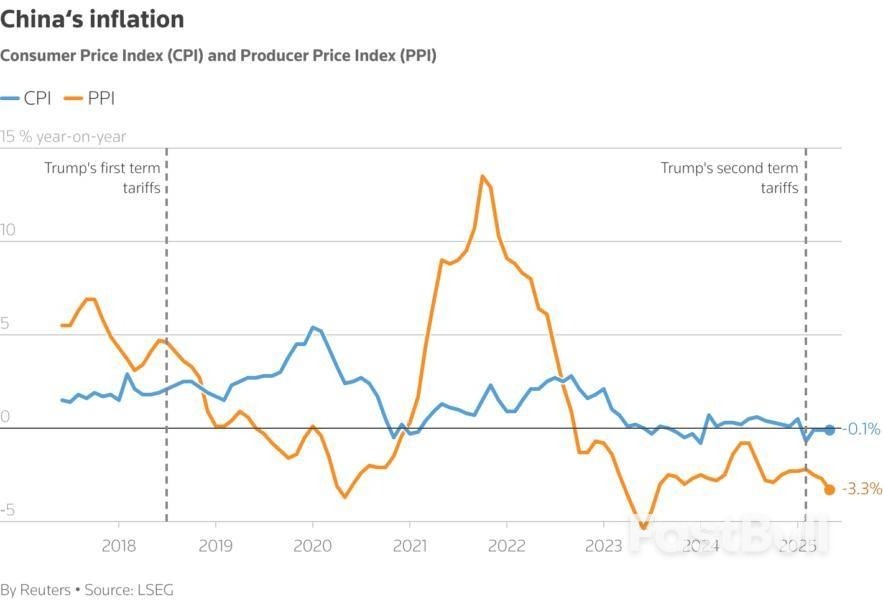
          The producer price index fell 3.3% in May from a year earlier, after a 2.7% decline in April and marked the deepest contraction in 22 months.

          Cooling factory activity also highlights the impact of U.S. tariffs on the world's largest manufacturing hub, dampening faster services growth as suspense lingers over the outcome of U.S.-China trade talks.

          Sluggish domestic demand and weak prices have weighed on China's economy, which has struggled to mount a robust post-pandemic recovery amid a prolonged property slump and has relied on exports to underpin growth.

          Retail sales growth slowed last month as spending continued to lag due to job insecurity and stagnant new home prices.

          Businesses have also had to adapt to the falling prices. U.S. coffee chain Starbuckssaid on Monday it would lower prices of some iced drinks by an average of 5 yuan in China.

          While the core inflation measure, excluding volatile food and fuel prices, registered a slightly faster 0.6% year-on-year rise, from a 0.5% increase in April, Capital Economics' Huang said the improvement looks "fragile".

          She still expects "persistent overcapacity will keep China in deflation both this year and next."

          Source: TradingView

          To stay updated on all economic events of today, please check out our Economic calendar
          Risk Warnings and Disclaimers
          You understand and acknowledge that there is a high degree of risk involved in trading. Following any strategies or investment methods may lead to potential losses. The content on the site is provided by our contributors and analysts for information purposes only. You are solely responsible for determining whether any trading assets, securities, strategy, or any other product is suitable for investing based on your own investment objectives and financial situation.
          Add to Favorites
          Share

          High-Stakes Reset: U.S.-China Trade Talks Resume in London Amid Rare Earth Tensions

          Gerik

          Economic

          China–U.S. Trade War

          Renewed Dialogue Amid Deepening Trade Frictions

          In a pivotal move to de-escalate one of the most consequential trade confrontations of the decade, U.S. President Donald Trump has announced that Treasury Secretary Scott Bessent, Commerce Secretary Howard Lutnick, and U.S. Trade Representative Jamieson Greer will travel to London on Monday to meet with Chinese Vice Premier He Lifeng. This meeting signals a renewed attempt to stabilize economic relations between the world’s two largest economies, whose bilateral trade exceeded $582 billion last year.
          The upcoming negotiations follow a temporary truce in Geneva that saw a rollback of most punitive tariffs. However, that fragile progress has since been overshadowed by escalating disputes—particularly surrounding semiconductor policies and critical mineral exports.

          Rare Earths at the Center of the Clash

          A core flashpoint remains China’s grip on rare earth elements. Despite an agreement in Geneva, Beijing has delayed export permit approvals for shipments to the U.S., prompting Washington to accuse it of backtracking on promises. These materials—vital for defense systems, electric vehicles, and high-tech manufacturing—have become a key lever in the geopolitical tug-of-war.
          Trump's cryptic remark following his recent call with President Xi—“There should no longer be any questions respecting the complexity of Rare Earth products”—suggests intensifying pressure on China to act, though the precise meaning remains unclear. In response, China’s Ministry of Commerce insisted its controls are in line with international norms and promised faster processing of license applications.

          Wider Disputes Undermine Trust

          The trust deficit has been compounded by other provocations. The U.S. Commerce Department’s advisory against the use of Chinese semiconductors and the revocation of certain student visas have reignited Beijing’s accusations of unfair treatment. Meanwhile, Washington remains wary of China's perceived foot-dragging on liberalizing access to key mineral exports and intellectual property commitments.
          Beijing's official statement, released Saturday, confirmed that He Lifeng will lead China’s delegation in London, following his recent participation in Switzerland. His involvement underscores the talks’ significance, as he is the country's top economic policymaker and lead negotiator with Washington.

          Strategic Implications for Global Markets

          This high-level engagement comes at a critical juncture for both economies. China faces persistent deflationary pressure, weak consumer demand, and a struggling real estate sector. In contrast, the U.S. is leveraging relative economic resilience—buoyed by strong job data and financial market optimism—to demand broader market access and security assurances.
          Markets, particularly those dependent on rare earths and global semiconductor supply chains, are watching closely. Auto manufacturers, tech giants, and clean energy firms across the U.S., Europe, and Japan have already begun contingency planning due to ongoing uncertainty around China's export policy.
          The London meeting could prove to be a pivotal recalibration of the U.S.-China trade relationship. If successful, it may not only ease immediate tensions but also lay groundwork for long-term supply chain resilience and rules-based trade. However, the shadow of political mistrust and strategic competition looms large—highlighting that any breakthrough will require not just economic incentives but geopolitical finesse.

          Source: Reuters

          To stay updated on all economic events of today, please check out our Economic calendar
          Risk Warnings and Disclaimers
          You understand and acknowledge that there is a high degree of risk involved in trading. Following any strategies or investment methods may lead to potential losses. The content on the site is provided by our contributors and analysts for information purposes only. You are solely responsible for determining whether any trading assets, securities, strategy, or any other product is suitable for investing based on your own investment objectives and financial situation.
          Add to Favorites
          Share
          FastBull
          Copyright © 2025 FastBull Ltd

          728 RM B 7/F GEE LOK IND BLDG NO 34 HUNG TO RD KWUN TONG KLN HONG KONG

          TelegramInstagramTwitterfacebooklinkedin
          App Store Google Play Google Play
          Products
          Charts

          Chats

          Q&A with Experts
          Screeners
          Economic Calendar
          Data
          Tools
          Membership
          Features
          Function
          Markets
          Copy Trading
          Latest Signals
          Contests
          News
          Analysis
          24/7
          Columns
          Education
          Company
          Careers
          About Us
          Contact Us
          Advertising
          Help Center
          Feedback
          User Agreement
          Privacy Policy
          Business

          White Label

          Data API

          Web Plug-ins

          Poster Maker

          Affiliate Program

          Risk Disclosure

          The risk of loss in trading financial instruments such as stocks, FX, commodities, futures, bonds, ETFs and crypto can be substantial. You may sustain a total loss of the funds that you deposit with your broker. Therefore, you should carefully consider whether such trading is suitable for you in light of your circumstances and financial resources.

          No decision to invest should be made without thoroughly conducting due diligence by yourself or consulting with your financial advisors. Our web content might not suit you since we don't know your financial conditions and investment needs. Our financial information might have latency or contain inaccuracy, so you should be fully responsible for any of your trading and investment decisions. The company will not be responsible for your capital loss.

          Without getting permission from the website, you are not allowed to copy the website's graphics, texts, or trademarks. Intellectual property rights in the content or data incorporated into this website belong to its providers and exchange merchants.

          Not Logged In

          Log in to access more features

          FastBull Membership

          Not yet

          Purchase

          Become a signal provider
          Help Center
          Customer Service
          Dark Mode
          Price Up/Down Colors

          Log In

          Sign Up

          Position
          Layout
          Fullscreen
          Default to Chart
          The chart page opens by default when you visit fastbull.com