


- EURUSD
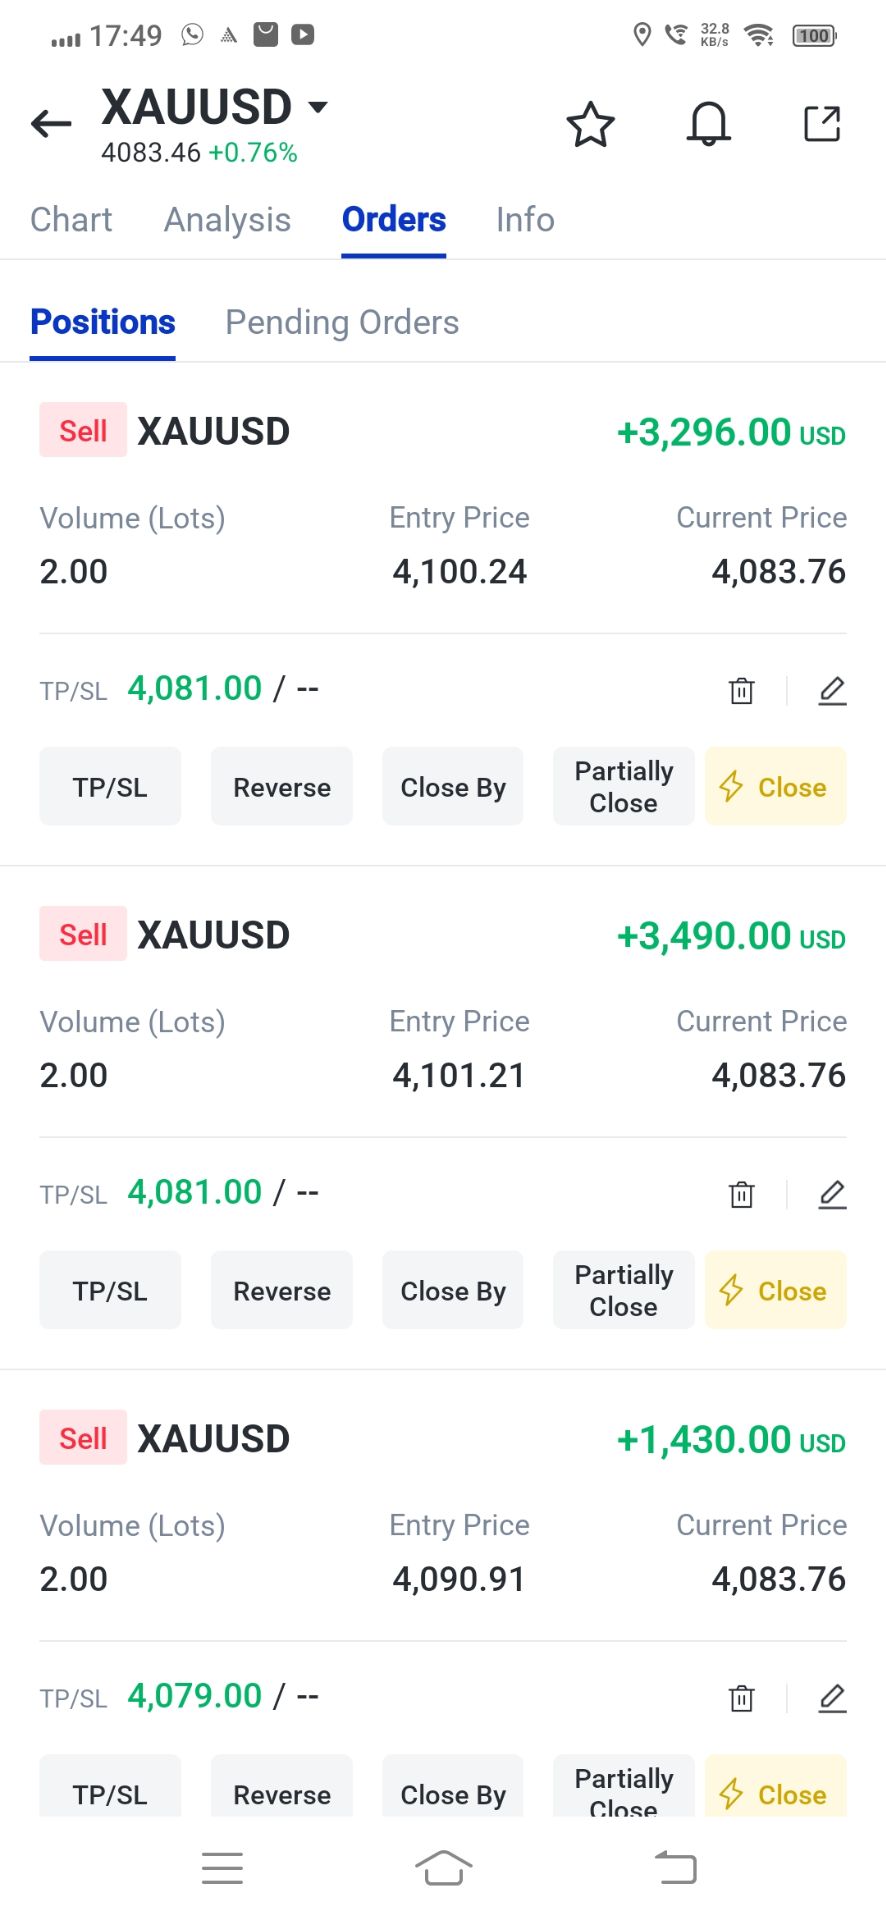
- XAUUSD
- XAGUSD
- WTI
- USDX


Markets
Analysis
User
24/7
Economic Calendar
Education
Data
- Names
- Latest
- Prev


The US dollar has recovered thanks to the Fed chair’s reluctance to signal a rate cut in October, a correction in stock indices, and rising geopolitical risks. Each of the USD’s main competitors has its own Achilles heel.
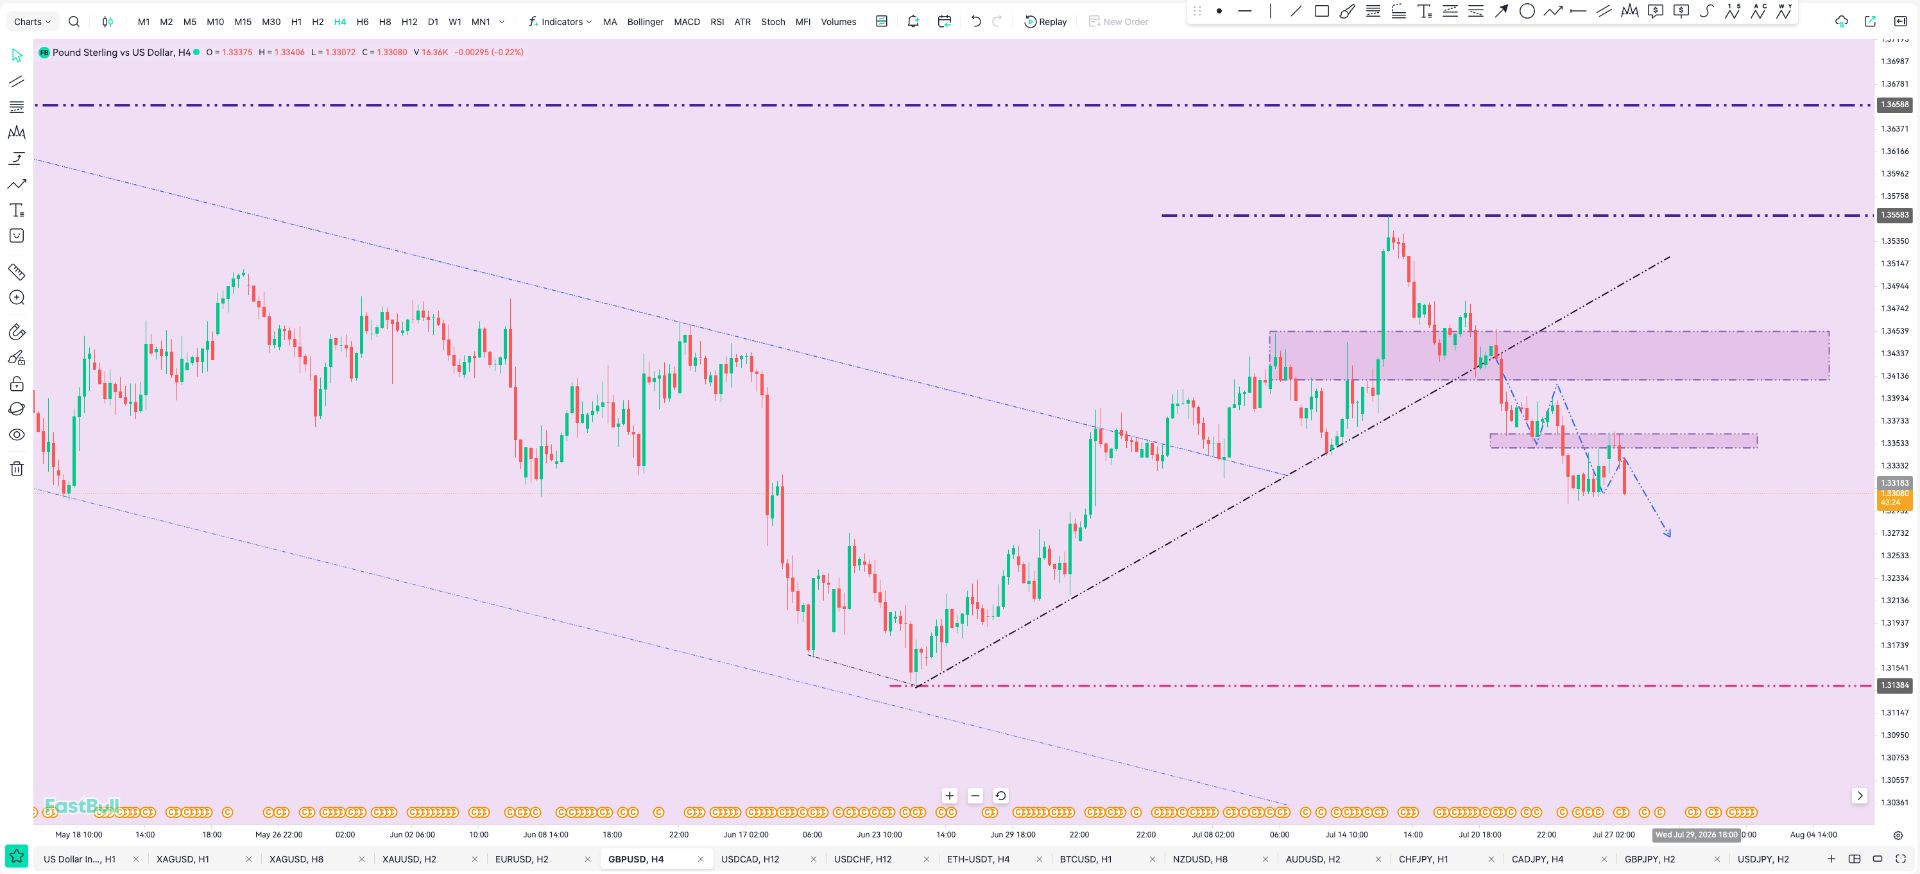
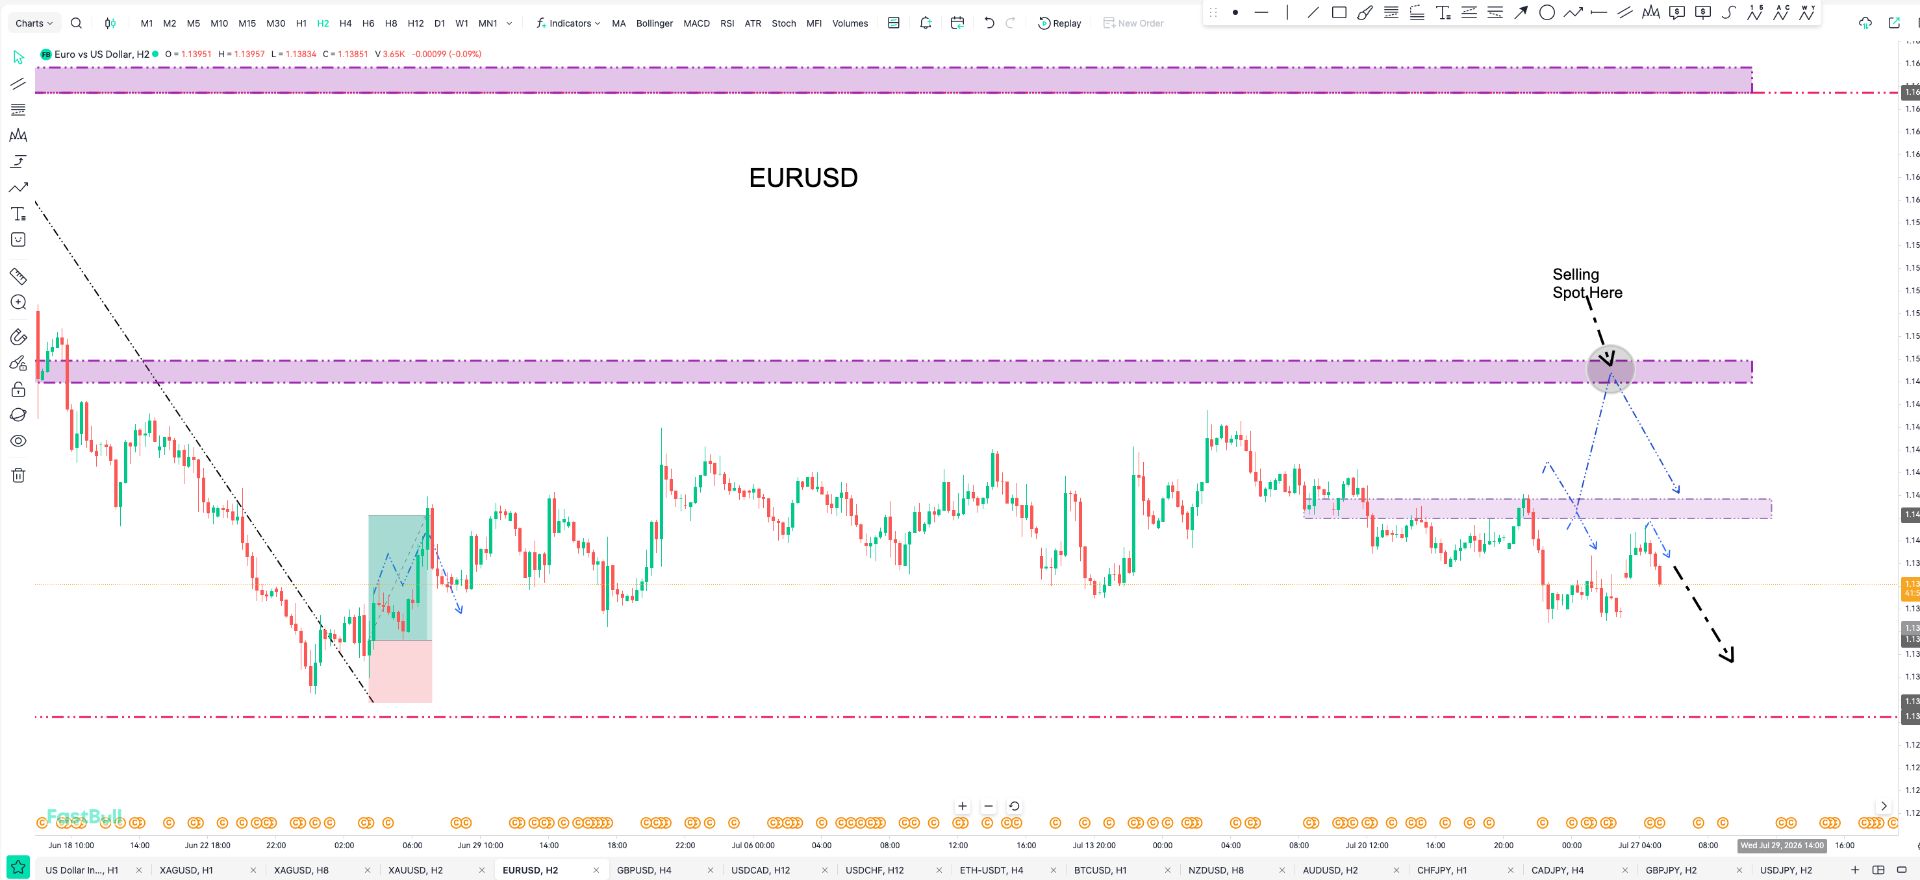
The US dollar has recovered thanks to the Fed chair’s reluctance to signal a rate cut in October, a correction in stock indices, and rising geopolitical risks. Each of the USD’s main competitors has its own Achilles heel. The euro is disappointed by Friedrich Merz’s fiscal stimulus measures. The leadership battle in the Liberal Democratic Party weighs down the yen. The pound is concerned about the Treasury’s ability to plug a £35 billion hole in the budget.
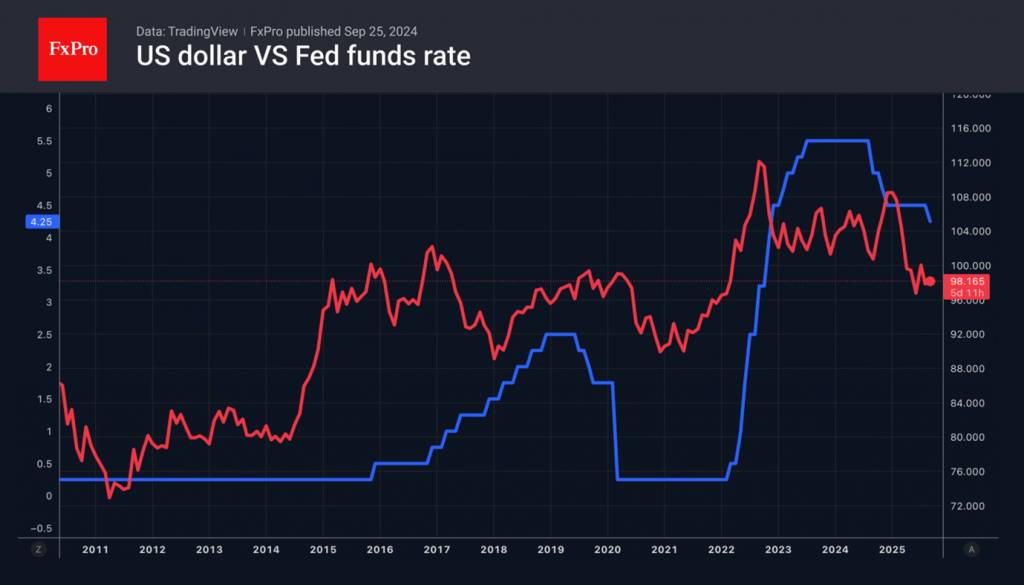
Scott Bessent expressed surprise that Jerome Powell did not signal further rate cuts in October. According to the Treasury Secretary, the federal funds rate should fall by 100-150 basis points before the end of 2025. However, many FOMC members are concerned about the possibility of accelerating inflation. The split within the Fed is playing into the hands of the US currency.
The greenback continues to act as a safe-haven asset, and the United States is a net exporter of energy commodities. Therefore, rising oil prices amid increasing geopolitical risks have provided support for the USD index.
The fall in US stock indices resembles a sell-the-fact after a large-scale buy rumour after the Fed has lowered its rate. After the S&P 500 rose on news of Oracle and NVIDIA’s deals with OpenAI, asset managers bought $58 billion worth of US stocks. This is the largest inflow since the beginning of the year. This seems logical against the backdrop of numerous record highs for the broad stock index.
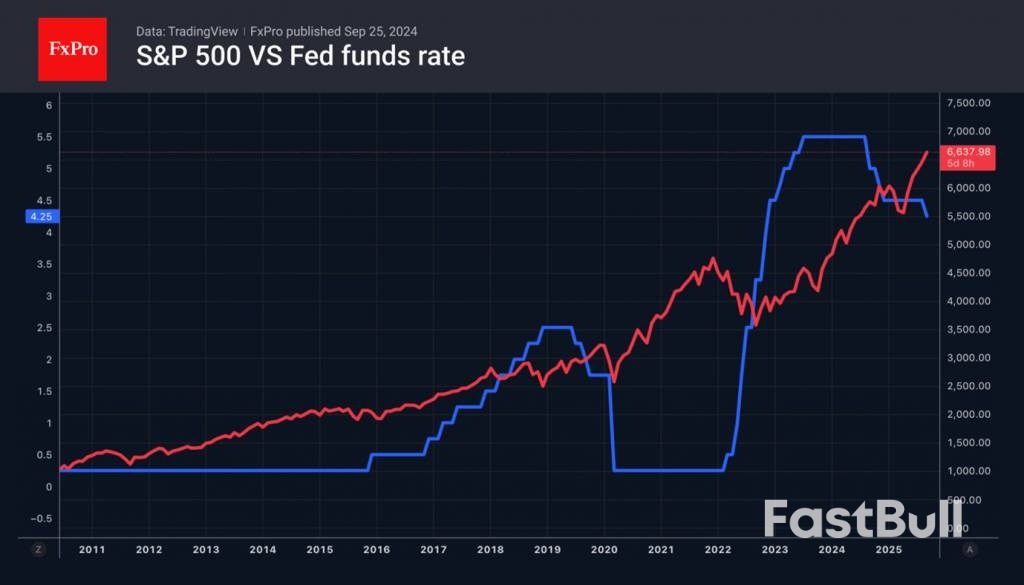
As soon as the S&P 500 took a step back, the bulls became nervous. Jerome Powell contributed to the pullback. The Fed chairman said that US stocks are overvalued. Until then, the markets had not attached any significance to the Price-to-Earnings Ratio rising to 22.9. The broad stock index has only traded above this level twice this century — during the dot-com crisis and the pandemic.
Bank of America notes that 19 out of 20 fundamental valuation metrics for the S&P 500 indicate that the market is overheated. However, corporations’ current positions look much better than in the past, so the current valuations may be justified. This gives investors the opportunity to use the good old strategy of buying on dips.
728 RM B 7/F GEE LOK IND BLDG NO 34 HUNG TO RD KWUN TONG KLN HONG KONG


The risk of loss in trading financial instruments such as stocks, FX, commodities, futures, bonds, ETFs and crypto can be substantial. You may sustain a total loss of the funds that you deposit with your broker. Therefore, you should carefully consider whether such trading is suitable for you in light of your circumstances and financial resources.
No decision to invest should be made without thoroughly conducting due diligence by yourself or consulting with your financial advisors. Our web content might not suit you since we don't know your financial conditions and investment needs. Our financial information might have latency or contain inaccuracy, so you should be fully responsible for any of your trading and investment decisions. The company will not be responsible for your capital loss.
Without getting permission from the website, you are not allowed to copy the website's graphics, texts, or trademarks. Intellectual property rights in the content or data incorporated into this website belong to its providers and exchange merchants.
Not Logged In
Log in to access more features


Log In
Sign Up


