• Trade
  • Markets
  • Copy
  • Contests
  • News
  • 24/7
  • Calendar
  • Q&A
  • Chats
Trending
Screeners
SYMBOL
LAST
BID
ASK
HIGH
LOW
NET CHG.
%CHG.
SPREAD
SPX
S&P 500 Index
6870.39
6870.39
6870.39
6895.79
6858.28
+13.27
+ 0.19%
--
DJI
Dow Jones Industrial Average
47954.98
47954.98
47954.98
48133.54
47871.51
+104.05
+ 0.22%
--
IXIC
NASDAQ Composite Index
23578.12
23578.12
23578.12
23680.03
23506.00
+72.99
+ 0.31%
--
USDX
US Dollar Index
98.940
99.020
98.940
98.960
98.730
-0.010
-0.01%
--
EURUSD
Euro / US Dollar
1.16479
1.16486
1.16479
1.16717
1.16341
+0.00053
+ 0.05%
--
GBPUSD
Pound Sterling / US Dollar
1.33155
1.33164
1.33155
1.33462
1.33136
-0.00157
-0.12%
--
XAUUSD
Gold / US Dollar
4211.46
4211.89
4211.46
4218.85
4190.61
+13.55
+ 0.32%
--
WTI
Light Sweet Crude Oil
59.179
59.209
59.179
60.084
59.160
-0.630
-1.05%
--

Community Accounts

Signal Accounts
--
Profit Accounts
--
Loss Accounts
--
View More

Become a signal provider

Sell trading signals to earn additional income

View More

Guide to Copy Trading

Get started with ease and confidence

View More

Signal Accounts for Members

All Signal Accounts

Best Return
  • Best Return
  • Best P/L
  • Best MDD
Past 1W
  • Past 1W
  • Past 1M
  • Past 1Y

All Contests

  • All
  • Trump Updates
  • Recommend
  • Stocks
  • Cryptocurrencies
  • Central Banks
  • Featured News
Top News Only
Share

India Foreign Ministry: New Deputy USA Trade Representative Will Visit India On Dec 10-11

Share

India Foreign Ministry: Advise Indian Nationals To Exercise Caution While Travelling To Or Transiting Through China

Share

Agrural - Brazil's 2025/26 Total Corn Output Seen At 135.3 Million Tonnes Versus 141.1 Million Tonnes In Previous Season

Share

Agrural - Brazil's 2025/26 Soybean Planting Hits 94% Of Expected Area As Of Last Thursday

Share

SEBI: Modalities For Migration To Ai Only Schemes And Relaxations To Large Value Funds For Accredited Investors

Share

All 6 Bank Of Israel Monetary Policy Committee Members Voted To Lower Benchmark Interest Rate 25 Bps To 4.25% On Nov 24

Share

India Government: Cancellations Are On Account Of Developer Delays And Not Due To Transmission Side Delays

Share

Fitch: We See Moderation Of Export Performance In China In 2026

Share

India Government: Revokes Grid Access Permissions For Renewable Energy Projects

Share

Stats Office - Tanzania Inflation At 3.4% Year-On-Year In November

Share

Temasek CEO Dilhan Pillay: We Are Taking A Conservative Stance On Allocating Capital

Share

Brazil Economists See Brazilian Real At 5.40 Per Dollar By Year-End 2025 Versus 5.40 In Previous Estimate - Central Bank Poll

Share

Brazil Economists See Year-End 2026 Interest Rate Selic At 12.25% Versus 12.00% In Previous Estimate - Central Bank Poll

Share

Brazil Economists See Year-End 2025 Interest Rate Selic At 15.00% Versus 15.00% In Previous Estimate - Central Bank Poll

Share

EU Commission Says Meta Has Committed To Give EU Users Choice On Personalised Ads

Share

Sources Revealed That The Bank Of England Has Invited Employees To Voluntarily Apply For Layoffs

Share

The Bank Of England Plans To Cut Staff Due To Budget Pressures

Share

Traders Believe There Is Less Than A 10% Chance That The European Central Bank Will Cut Interest Rates By 25 Basis Points In 2026

Share

Egypt, European Bank For Reconstruction And Development Sign $100 Million Financing Agreement

Share

Israel Budget Deficit 4.5% Of GDP In November Over Past 12 Months Versus 4.9% Deficit In October

TIME
ACT
FCST
PREV
France Industrial Output MoM (SA) (Oct)

A:--

F: --

P: --
France Trade Balance (SA) (Oct)

A:--

F: --

P: --
Euro Zone Employment YoY (SA) (Q3)

A:--

F: --

P: --
Canada Part-Time Employment (SA) (Nov)

A:--

F: --

P: --

Canada Unemployment Rate (SA) (Nov)

A:--

F: --

P: --

Canada Full-time Employment (SA) (Nov)

A:--

F: --

P: --

Canada Labor Force Participation Rate (SA) (Nov)

A:--

F: --

P: --

Canada Employment (SA) (Nov)

A:--

F: --

P: --

U.S. PCE Price Index MoM (Sept)

A:--

F: --

P: --

U.S. Personal Income MoM (Sept)

A:--

F: --

P: --

U.S. Core PCE Price Index MoM (Sept)

A:--

F: --

P: --

U.S. PCE Price Index YoY (SA) (Sept)

A:--

F: --

P: --

U.S. Core PCE Price Index YoY (Sept)

A:--

F: --

P: --

U.S. Personal Outlays MoM (SA) (Sept)

A:--

F: --

P: --
U.S. 5-10 Year-Ahead Inflation Expectations (Dec)

A:--

F: --

P: --

U.S. Real Personal Consumption Expenditures MoM (Sept)

A:--

F: --

P: --
U.S. Weekly Total Rig Count

A:--

F: --

P: --

U.S. Weekly Total Oil Rig Count

A:--

F: --

P: --

U.S. Consumer Credit (SA) (Oct)

A:--

F: --

P: --
China, Mainland Foreign Exchange Reserves (Nov)

A:--

F: --

P: --

Japan Trade Balance (Oct)

A:--

F: --

P: --

Japan Nominal GDP Revised QoQ (Q3)

A:--

F: --

P: --

China, Mainland Imports YoY (CNH) (Nov)

A:--

F: --

P: --

China, Mainland Exports (Nov)

A:--

F: --

P: --

China, Mainland Imports (CNH) (Nov)

A:--

F: --

P: --

China, Mainland Trade Balance (CNH) (Nov)

A:--

F: --

P: --

China, Mainland Exports YoY (USD) (Nov)

A:--

F: --

P: --

China, Mainland Imports YoY (USD) (Nov)

A:--

F: --

P: --

Germany Industrial Output MoM (SA) (Oct)

A:--

F: --

P: --
Euro Zone Sentix Investor Confidence Index (Dec)

A:--

F: --

P: --

Canada National Economic Confidence Index

--

F: --

P: --

U.K. BRC Like-For-Like Retail Sales YoY (Nov)

--

F: --

P: --

U.K. BRC Overall Retail Sales YoY (Nov)

--

F: --

P: --

Australia Overnight (Borrowing) Key Rate

--

F: --

P: --

RBA Rate Statement
RBA Press Conference
Germany Exports MoM (SA) (Oct)

--

F: --

P: --

U.S. NFIB Small Business Optimism Index (SA) (Nov)

--

F: --

P: --

Mexico 12-Month Inflation (CPI) (Nov)

--

F: --

P: --

Mexico Core CPI YoY (Nov)

--

F: --

P: --

Mexico PPI YoY (Nov)

--

F: --

P: --

U.S. Weekly Redbook Index YoY

--

F: --

P: --

U.S. JOLTS Job Openings (SA) (Oct)

--

F: --

P: --

China, Mainland M1 Money Supply YoY (Nov)

--

F: --

P: --

China, Mainland M0 Money Supply YoY (Nov)

--

F: --

P: --

China, Mainland M2 Money Supply YoY (Nov)

--

F: --

P: --

U.S. EIA Short-Term Crude Production Forecast For The Year (Dec)

--

F: --

P: --

U.S. EIA Natural Gas Production Forecast For The Next Year (Dec)

--

F: --

P: --

U.S. EIA Short-Term Crude Production Forecast For The Next Year (Dec)

--

F: --

P: --

EIA Monthly Short-Term Energy Outlook
U.S. API Weekly Gasoline Stocks

--

F: --

P: --

U.S. API Weekly Cushing Crude Oil Stocks

--

F: --

P: --

U.S. API Weekly Crude Oil Stocks

--

F: --

P: --

U.S. API Weekly Refined Oil Stocks

--

F: --

P: --

South Korea Unemployment Rate (SA) (Nov)

--

F: --

P: --

Japan Reuters Tankan Non-Manufacturers Index (Dec)

--

F: --

P: --

Japan Reuters Tankan Manufacturers Index (Dec)

--

F: --

P: --

Japan Domestic Enterprise Commodity Price Index MoM (Nov)

--

F: --

P: --

Japan Domestic Enterprise Commodity Price Index YoY (Nov)

--

F: --

P: --

China, Mainland PPI YoY (Nov)

--

F: --

P: --

China, Mainland CPI MoM (Nov)

--

F: --

P: --

Q&A with Experts
    • All
    • Chatrooms
    • Groups
    • Friends
    Connecting
    .
    .
    .
    Type here...
    Add Symbol or Code

      No matching data

      All
      Trump Updates
      Recommend
      Stocks
      Cryptocurrencies
      Central Banks
      Featured News
      • All
      • Russia-Ukraine Conflict
      • Middle East Flashpoint
      • All
      • Russia-Ukraine Conflict
      • Middle East Flashpoint

      Search
      Products

      Charts Free Forever

      Chats Q&A with Experts
      Screeners Economic Calendar Data Tools
      Membership Features
      Data Warehouse Market Trends Institutional Data Policy Rates Macro

      Market Trends

      Market Sentiment Order Book Forex Correlations

      Top Indicators

      Charts Free Forever
      Markets

      News

      News Analysis 24/7 Columns Education
      From Institutions From Analysts
      Topics Columnists

      Latest Views

      Latest Views

      Trending Topics

      Top Columnists

      Latest Update

      Signals

      Copy Rankings Latest Signals Become a signal provider AI Rating
      Contests
      Brokers

      Overview Brokers Assessment Rankings Regulators News Claims
      Broker listing Forex Brokers Comparison Tool Live Spread Comparison Scam
      Q&A Complaint Scam Alert Videos Tips to Detect Scam
      More

      Business
      Events
      Careers About Us Advertising Help Center

      White Label

      Data API

      Web Plug-ins

      Affiliate Program

      Awards Institution Evaluation IB Seminar Salon Event Exhibition
      Vietnam Thailand Singapore Dubai
      Fans Party Investment Sharing Session
      FastBull Summit BrokersView Expo
      Recent Searches
        Top Searches
          Markets
          News
          Analysis
          User
          24/7
          Economic Calendar
          Education
          Data
          • Names
          • Latest
          • Prev

          View All

          No data

          Scan to Download

          Faster Charts, Chat Faster!

          Download App
          English
          • English
          • Español
          • العربية
          • Bahasa Indonesia
          • Bahasa Melayu
          • Tiếng Việt
          • ภาษาไทย
          • Français
          • Italiano
          • Türkçe
          • Русский язык
          • 简中
          • 繁中
          Open Account
          Search
          Products
          Charts Free Forever
          Markets
          News
          Signals

          Copy Rankings Latest Signals Become a signal provider AI Rating
          Contests
          Brokers

          Overview Brokers Assessment Rankings Regulators News Claims
          Broker listing Forex Brokers Comparison Tool Live Spread Comparison Scam
          Q&A Complaint Scam Alert Videos Tips to Detect Scam
          More

          Business
          Events
          Careers About Us Advertising Help Center

          White Label

          Data API

          Web Plug-ins

          Affiliate Program

          Awards Institution Evaluation IB Seminar Salon Event Exhibition
          Vietnam Thailand Singapore Dubai
          Fans Party Investment Sharing Session
          FastBull Summit BrokersView Expo

          Oil Prices Could Fall Another 15% By The End of The Year

          FxPro

          Economic

          Commodity

          Summary:

          Oil prices could drop 15% by year-end due to rising supply, slowing demand and shrinking risk premiums, with Brent possibly nearing $50.

          Crude oil prices fell 0.7% on Monday after three consecutive weeks of decline. Global production is growing while global economic growth is slowing, putting pressure on prices. In addition, the risk premium on signing the gas agreement and intensifying efforts to resolve the Ukrainian conflict has begun to decline. At the same time, oil prices are far from oversold, leaving room for further decline in the coming months.

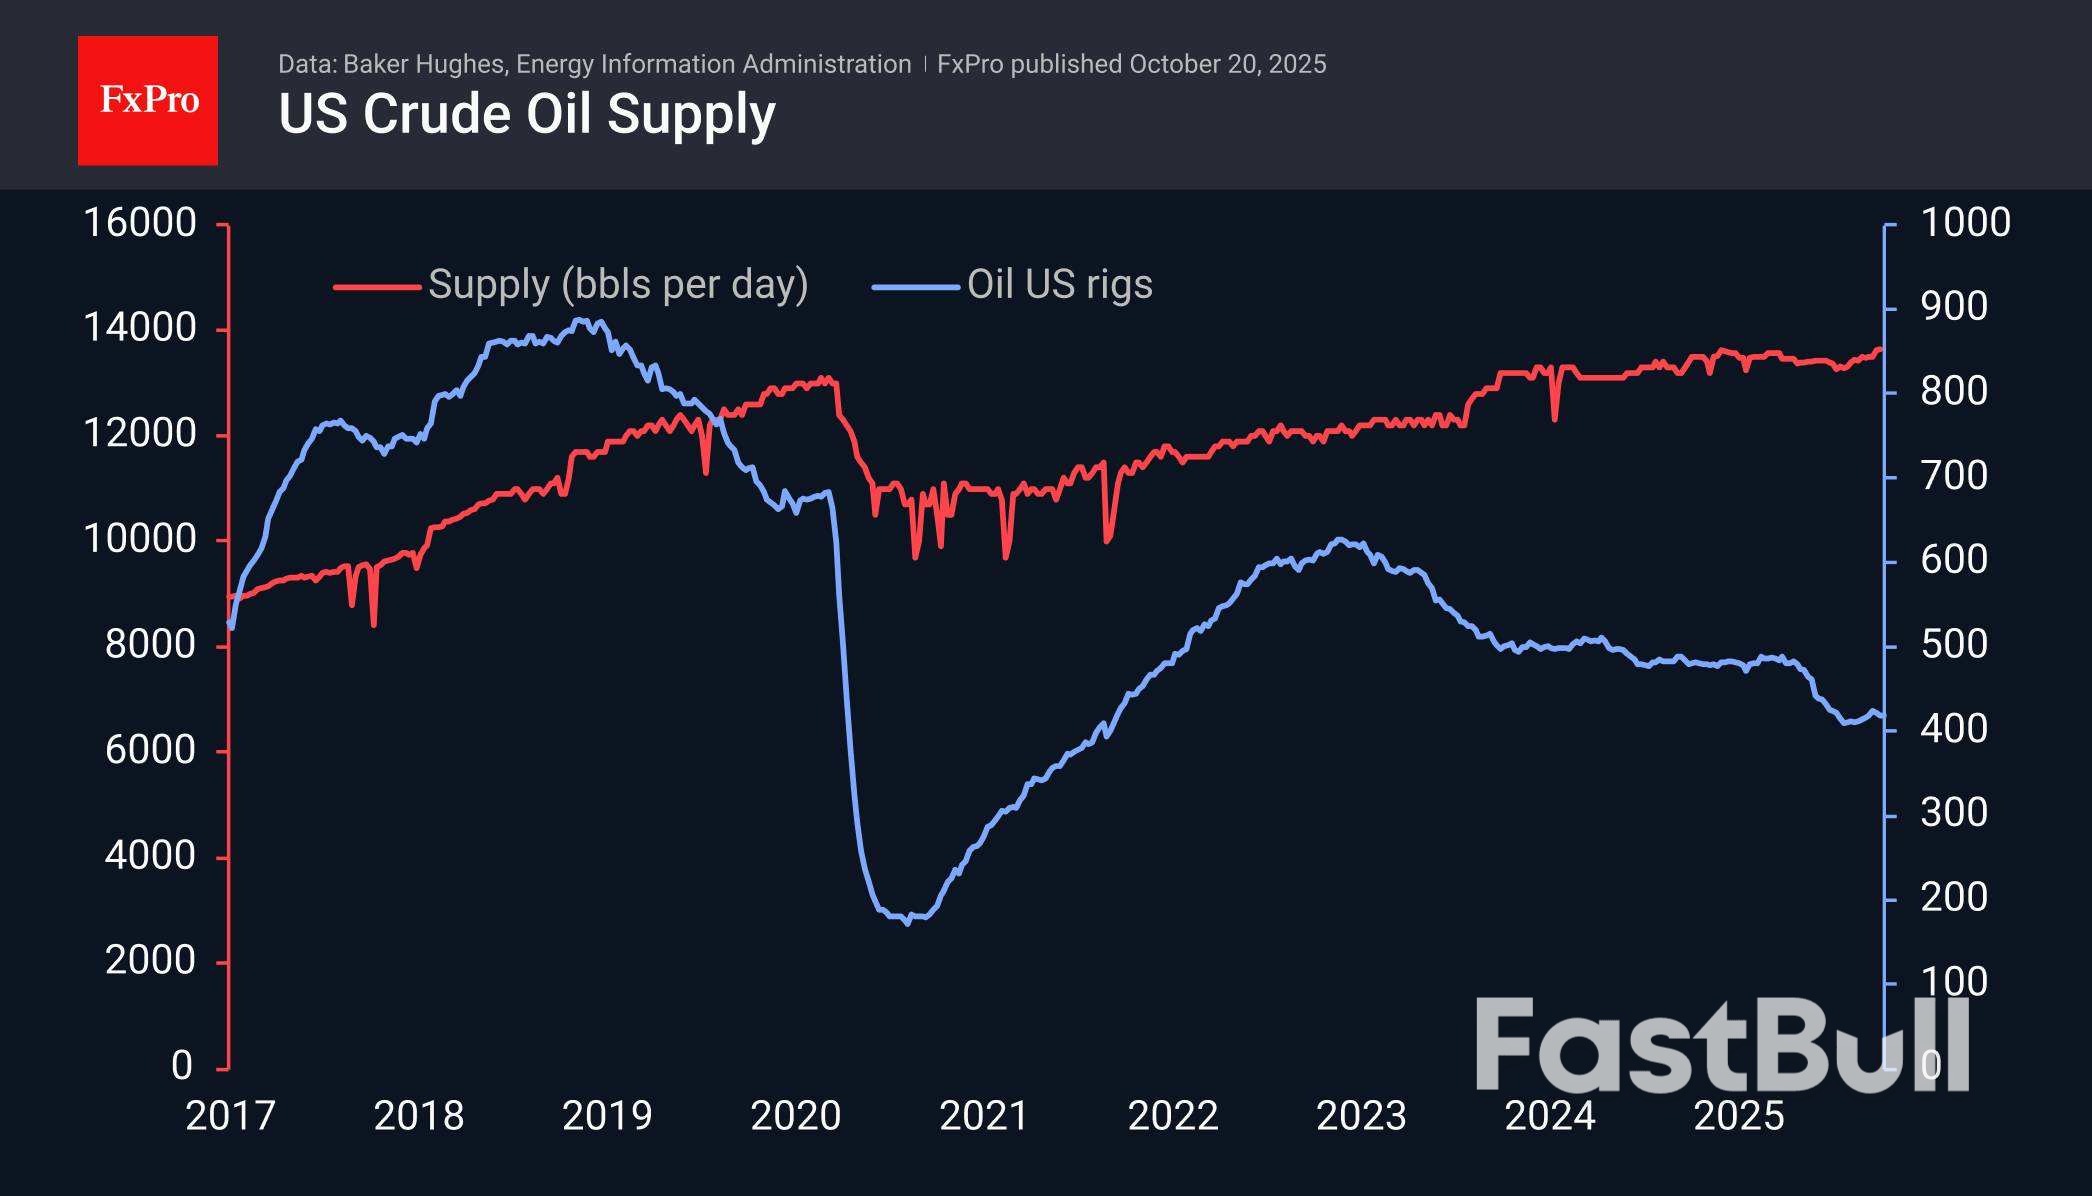
          Baker Hughes reported on Friday that 418 oil rigs are operating in the US, the same as a week earlier, undermining the recovery trend seen since August. However, America is increasing production efficiency, extracting more oil from each well.

          Bloomberg noted that there are now nearly 1.2 billion barrels of oil at sea, a record since the peak in 2020, when US production was at historic highs and Saudi Arabia and Russia were fighting for market share, boasting of their potential.

          The current situation strongly resonates with what happened more than five years ago. The latest weekly data showed a record high in daily production in the US, with supplies of 13.64 million barrels per day.

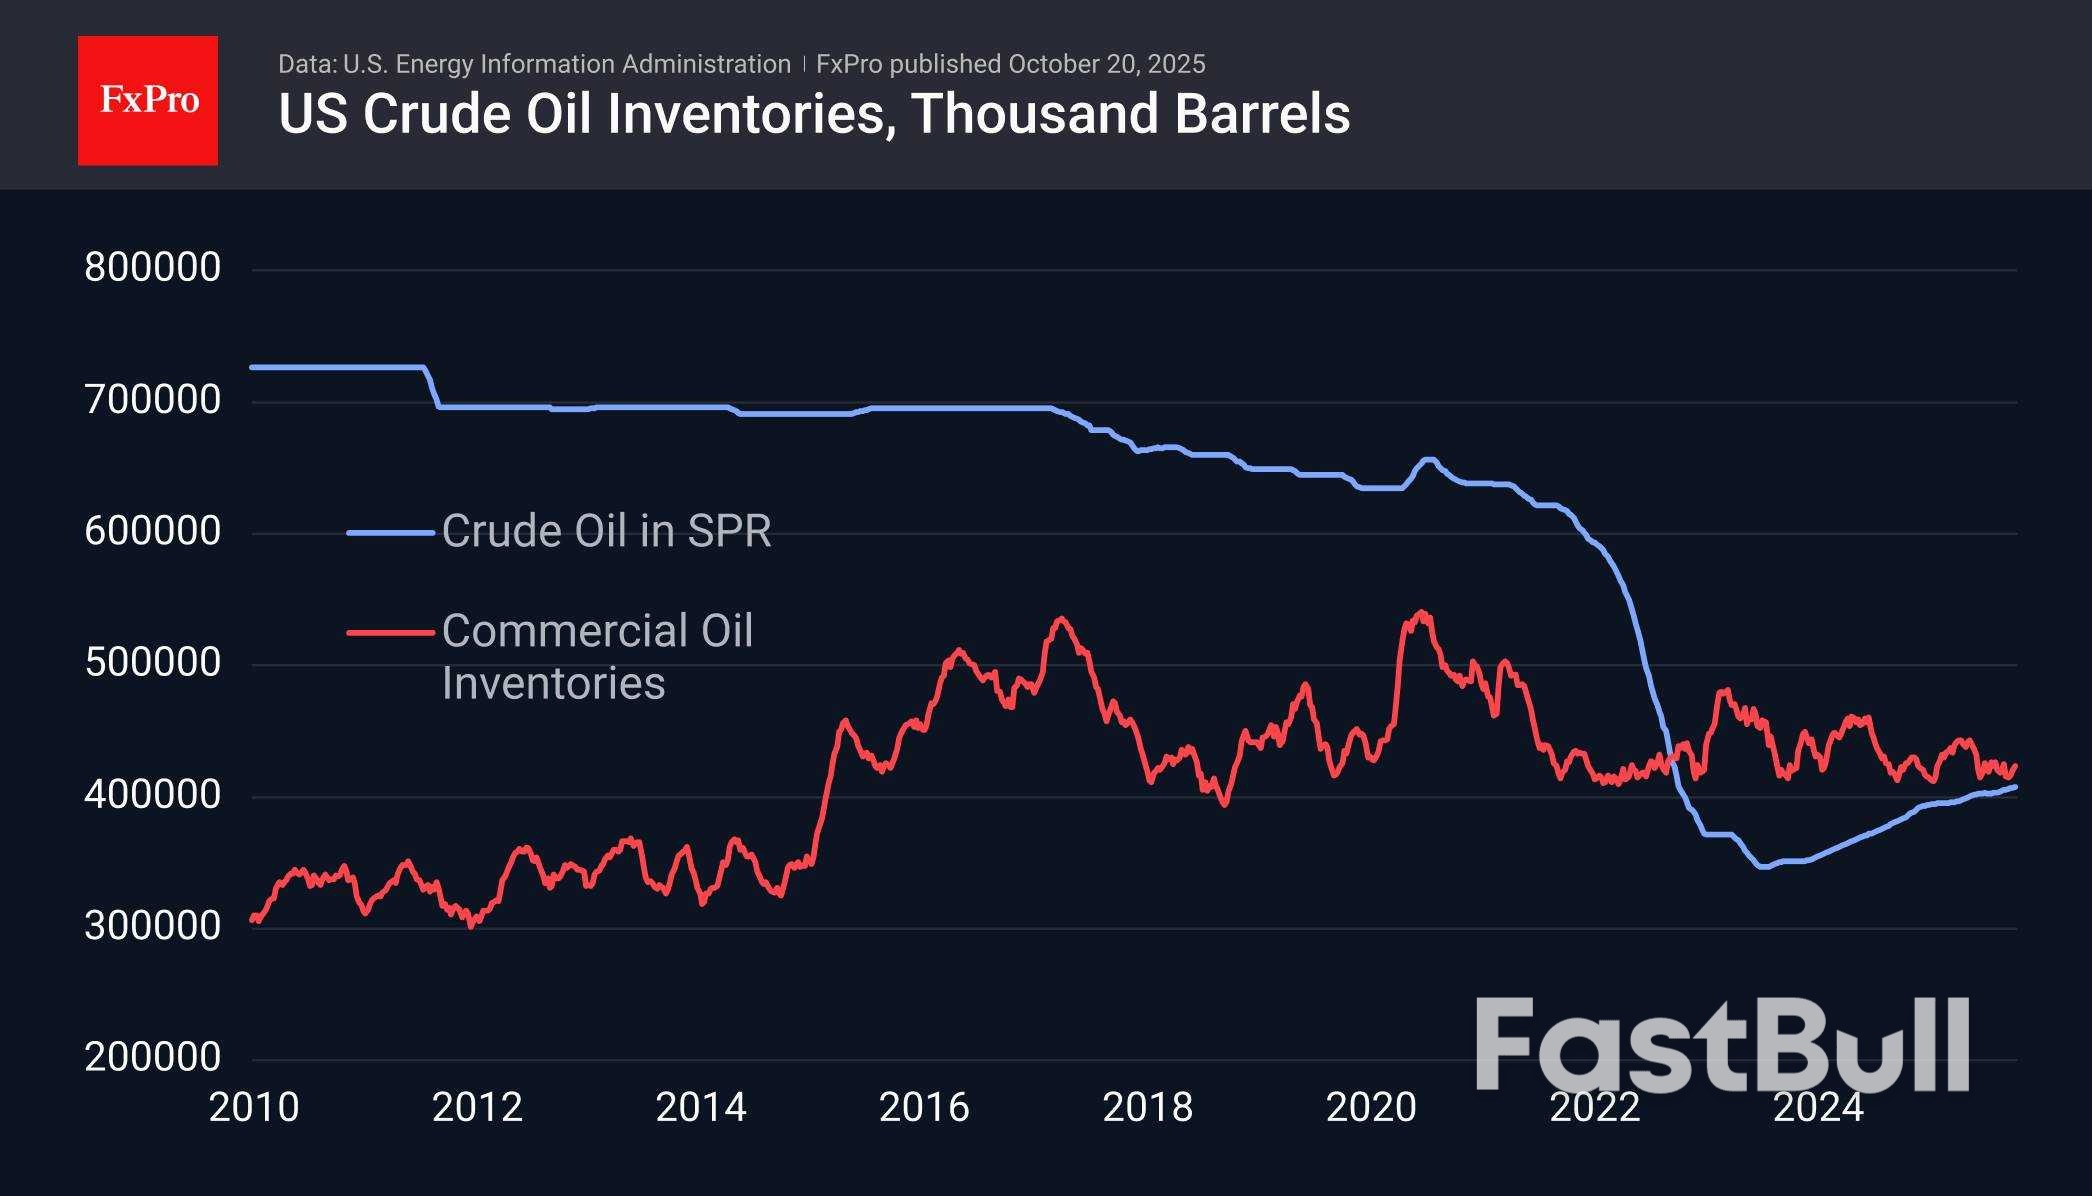
          Inventory figures are a stabilising factor. Commercial inventories in the US are at the lower end of the range for the last decade, but they were about the same in January 2020, and six months later, this figure set a new record. However, without a collapse in consumption, such rapid growth should not be expected. The US government may also move to more actively rebuild the strategic petroleum reserve sold off in 2022.

          The price of oil has been in a downward channel for just over three years, and at the end of September, it accelerated its decline as it approached the 50-week moving average and the upper limit of the range. The lower limit of this range is now close to $53 per barrel of Brent, with a decline towards the end of the year closer to $50.50 against the current $61.00.

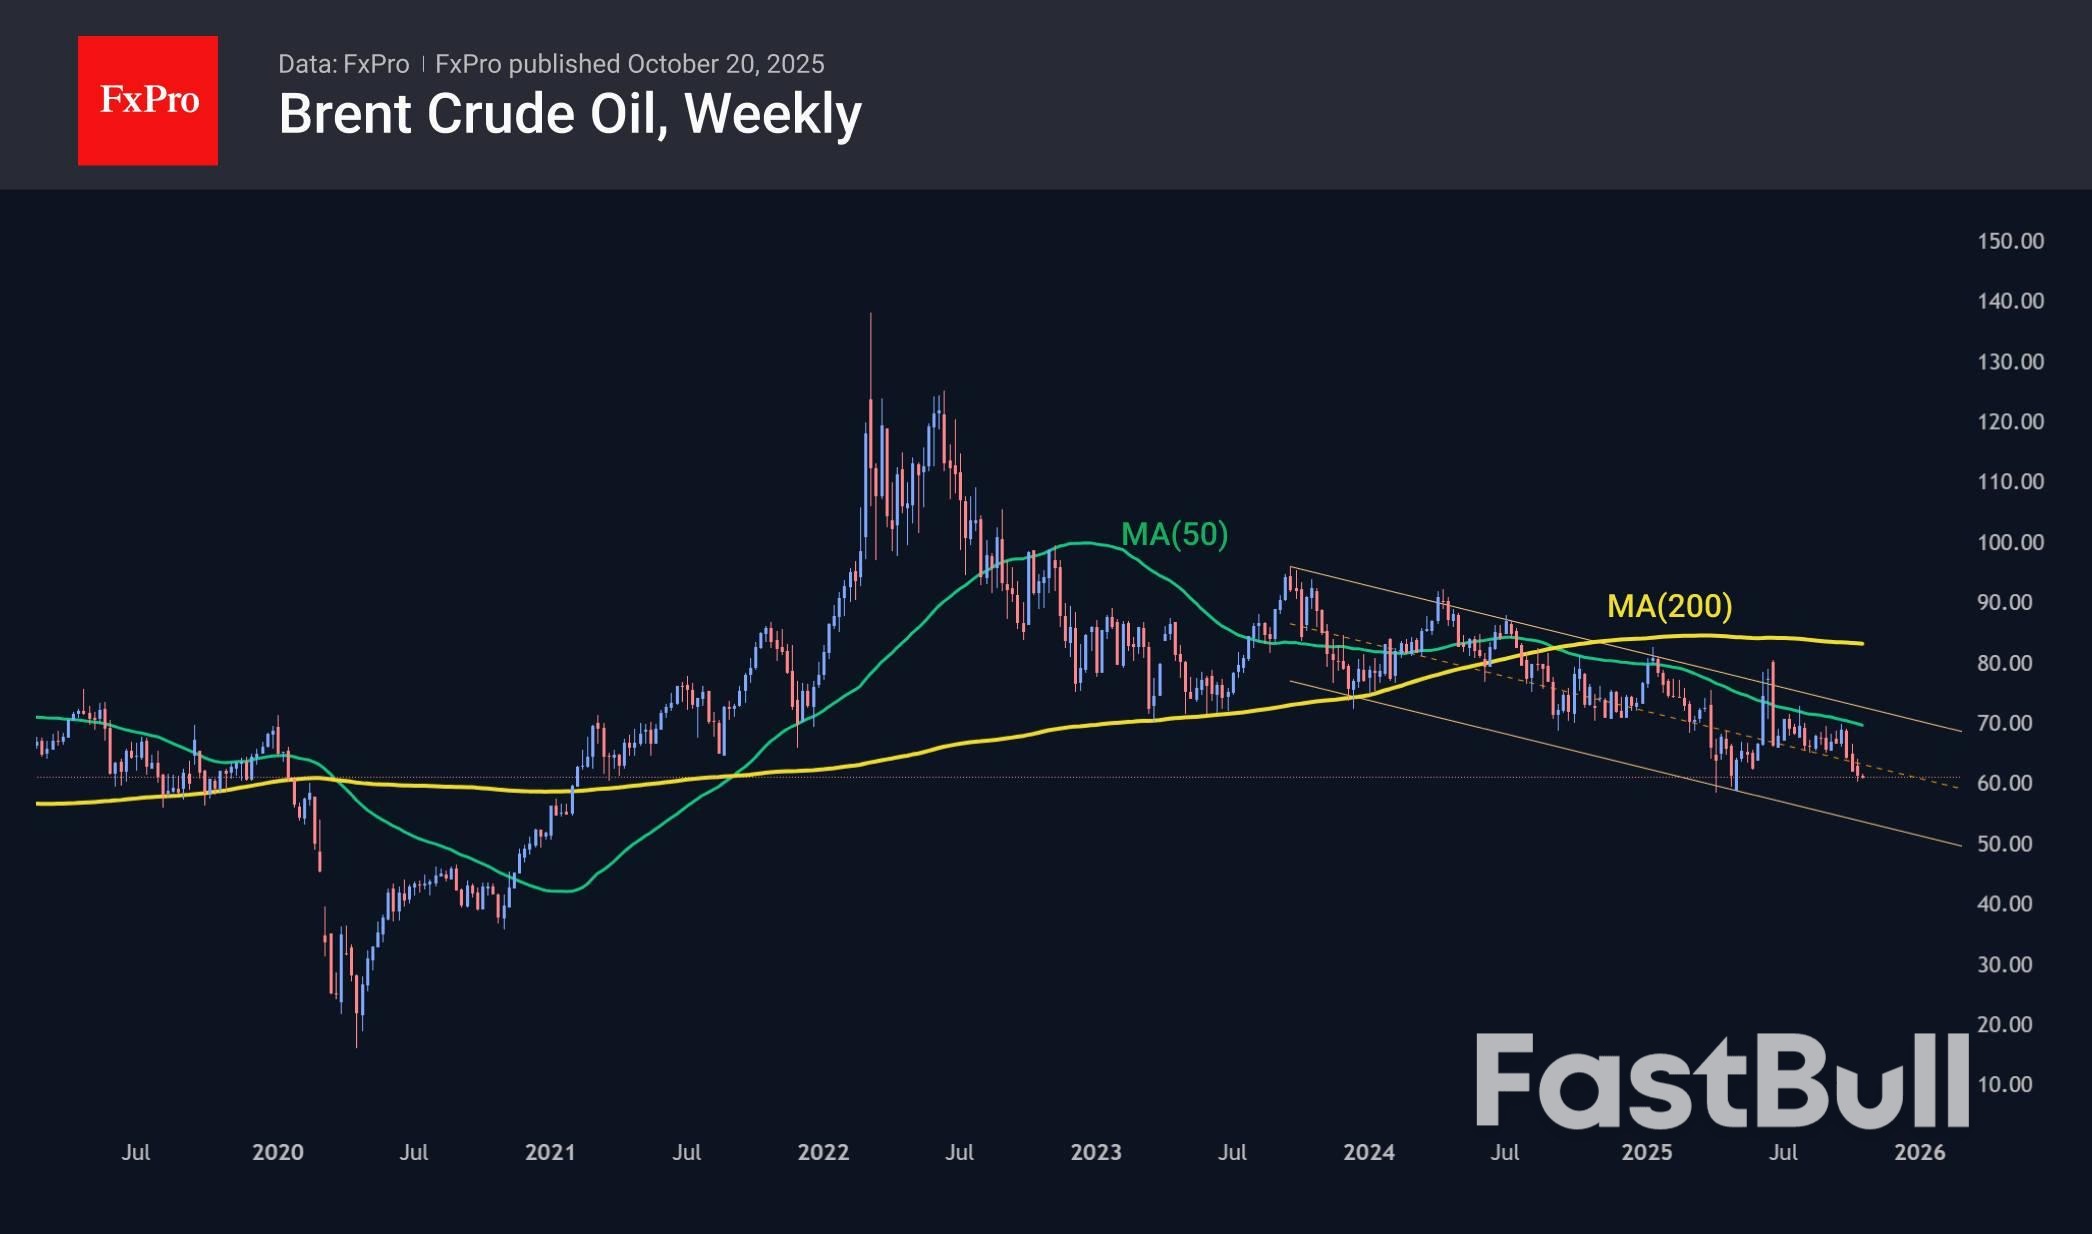
          The main scenario for oil is a decline towards $50 in the next 2-4 months. At the same time, the potential for an increase in US inventories is a potential stabilising factor. We assume that the situation with inventories is roughly similar worldwide, excluding the abundance of oil at sea.

          Source: FxPro

          To stay updated on all economic events of today, please check out our Economic calendar
          Risk Warnings and Disclaimers
          You understand and acknowledge that there is a high degree of risk involved in trading. Following any strategies or investment methods may lead to potential losses. The content on the site is provided by our contributors and analysts for information purposes only. You are solely responsible for determining whether any trading assets, securities, strategy, or any other product is suitable for investing based on your own investment objectives and financial situation.
          Add to Favorites
          Share

          How Does the Stock Market Work? Inside the Mechanics of Trading, Prices, and Investor Behavior

          Winkelmann

          Stocks

          How Does the Stock Market Work in 2025? Key Principles and Market Insights

          The stock market plays a central role in the global economy, allowing investors and companies to trade ownership and raise capital. This article explains how the stock market works, what drives prices, and how investors can participate responsibly.

          Part 1 — Understanding the Basics of the Stock Market

          The stock market is a network of exchanges where shares of publicly listed companies are bought and sold. When investors purchase a company’s stock, they acquire partial ownership and a claim on its future profits. Prices move constantly as buyers and sellers react to news, earnings reports, and economic data.

          Major exchanges include the New York Stock Exchange (NYSE) and the Nasdaq. Each operates under strict regulations to ensure transparency, fair pricing, and investor protection. The market serves two core purposes: helping companies raise capital and giving investors opportunities to grow wealth.

          Part 2 — How the Stock Market Operates

          1. Primary Market: Where Shares Are First Issued

          When a company goes public through an Initial Public Offering (IPO), it sells shares directly to investors for the first time. The funds raised help finance expansion, research, or debt repayment.

          2. Secondary Market: Everyday Buying and Selling

          After the IPO, shares trade on the secondary market between investors. Prices fluctuate based on supply and demand—when more investors want to buy than sell, prices rise, and vice versa.

          3. Market Participants

          • Retail investors — individuals buying and selling for personal portfolios.
          • Institutional investors — large entities like pension funds or mutual funds managing billions in assets.
          • Market makers — firms that provide liquidity by continuously quoting buy and sell prices.
          • Regulators — agencies like the SEC ensure compliance and protect investors from fraud.

          Part 3 — What Determines Stock Prices

          Stock prices reflect investors’ collective expectations about a company’s future performance. Several factors influence these movements:

          • Earnings reports: Profitability and revenue growth directly affect valuation.
          • Economic indicators: Inflation, GDP, and interest rates shape overall sentiment.
          • Market psychology: Fear, optimism, and herd behavior can exaggerate price swings.
          • Global events: Geopolitical tensions, policy changes, or major innovations shift risk appetite.

          In the short term, markets can be volatile. But over time, stock prices tend to follow corporate fundamentals and economic trends.

          Part 4 — How Investors Make Money in the Stock Market

          Investors can earn returns in two main ways:

          • Capital gains: Selling a stock at a higher price than the purchase cost.
          • Dividends: Periodic payments companies distribute from their profits.

          Long-term investors often focus on compounding growth by reinvesting dividends and holding through market cycles. Short-term traders, in contrast, aim to profit from daily price movements.

          Part 5 — Risks and How to Invest Wisely

          All investments carry risk. Market downturns, poor corporate performance, or global crises can reduce portfolio value. To manage risk:

          • Diversify across sectors and asset classes.
          • Invest regularly rather than trying to time the market.
          • Research companies and understand what you own.
          • Maintain a long-term mindset focused on goals, not short-term noise.

          Modern investors also use index funds and ETFs to gain broad exposure while minimizing fees and individual stock risk.

          Conclusion — How the Stock Market Works

          The stock market functions as a global exchange connecting companies seeking capital with investors pursuing growth. Prices move based on fundamentals, sentiment, and macroeconomic forces. Understanding these mechanisms helps investors participate more confidently and make informed, disciplined decisions for the long term.

          Risk Warnings and Disclaimers
          You understand and acknowledge that there is a high degree of risk involved in trading. Following any strategies or investment methods may lead to potential losses. The content on the site is provided by our contributors and analysts for information purposes only. You are solely responsible for determining whether any trading assets, securities, strategy, or any other product is suitable for investing based on your own investment objectives and financial situation.
          Add to Favorites
          Share

          Germany's Merz Calls For A "Wall Street" For Europe

          Samantha Luan

          Forex

          Political

          Economic

          In the German Bundestag, Friedrich Merz appealed to the EU to integrate the fragmented European capital market more deeply and reduce bureaucratic hurdles. His vision for the next step: a kind of Wall Street for Europe.German Chancellor Friedrich Merz used his government statement on Thursday to take a strategic look at what he called the “fragmented and over-bureaucratized” European stock and capital market landscape. His stated goal: the completion of the Capital Markets Union.“We need a kind of European Stock Exchange, so that successful companies like BionTech from Germany don’t have to go to the New York Stock Exchange,” Merz said. “Our companies need a sufficiently broad and deep capital market to fund themselves faster and more efficiently.”

          Keeping Value Creation in Europe

          The Chancellor linked this call to a strong appeal to the European Commission for consistent de-bureaucratization of the fragmented European capital market. Only in this way, he stressed, will the value created from German and European research truly remain in Europe. Only then can societal wealth grow via the capital market, Merz argued.The debate is fueled by the growing trend of European innovative companies raising capital on U.S. exchanges. Recent examples include Linde, Birkenstock Holding, and BioNTech – firms that chose Wall Street listings over domestic options.

          This discussion fits into a broader financial context: the integration of European financial and capital markets. A far-reaching harmonization of financial hubs and access to capital would not be a mistake. Currently, there are around 15 securities exchanges in the Eurozone. The two largest operators – Euronext N.V. and Deutsche Börse AG – together handle about 80 percent of the annual €8 trillion equity trading volume.

          Ending Capital Flight

          Merz’ initiative stands not only for institutional reform but also as an attempt to free Europe’s financial markets from self-imposed regulatory constraints.The Chancellor emphasized the importance of better financing for innovative startups in high-tech future industries. Experience shows, however, that these companies tend to rely on venture capital – and they have no difficulty listing on international exchanges like Frankfurt or London.

          The real question for Brussels and Berlin is whether focusing on a new financial hub alone is enough to prevent visible capital flows from Europe to the United States.Germany alone lost around €64.5 billion last year due to capital flight – a symptom of deeper issues: an overbearing regulatory framework from Brussels and EU capitals, excessive fiscal burdens, and an escalating energy cost crisis.

          The Real Target

          These are fundamental economic imbalances that cannot be resolved simply by creating a European mega-exchange. They are homegrown design flaws – at the heart of today’s economic crisis.In reality, the debate over the Capital Markets Union is about something else entirely: the European Commission’s strategic goal to consolidate member state debt under its roof. This would give Brussels greater financial clout through regular EU bond issuances. More centralization in Brussels, less national oversight – the dream of the Brussels power center.

          The EU is gradually moving toward a paradigm shift in debt financing. Originally, the Commission was strictly prohibited from financing itself via market issuances. That red line has long been crossed.The COVID lockdowns provided a lever to launch NextGenerationEU, an unprecedented €800 billion debt program. This money largely financed national deficits, with the Commission acting as a market borrower, backed by the European Central Bank.

          Brussels Is Already Active in the Market

          It is no secret that Brussels wants to expand this model. The Ukraine conflict serves as a convenient pretext to issue new joint debt under the media-amplified threat of Russian aggression. Chancellor Merz has already indicated this spring that EU-wide borrowing for defense purposes is not off the table – but only for “absolute exceptional cases.”

          Merz deliberately avoided the term “Eurobonds,” just like Ursula von der Leyen, who in her State of the Union speech on September 10 circumnavigated the term, instead proposing a common European budget for “European goods.”The signal is clear: we are in a transitional phase where old debt rules are being gradually loosened, and the centralization of debt issuance in Brussels is systematically advanced.

          Euroclear as an Anchor

          This aligns seamlessly with thinking about a shared European exchange – potentially hosted by Euroclear in Brussels, the central player in the safekeeping and settlement of Eurozone securities. A serious move would also consider relocating the European Central Bank to Brussels for fast debt issuance.The EU’s response to the looming debt crisis is obvious: a much higher degree of centralization. Activating capital that can be leveraged to expand debt becomes strategic; the exchange consolidation is just a secondary concern.

          This also ties into the debate over using frozen Russian assets at Euroclear. The goal: collateralize a portfolio worth around €200 billion, largely expired European sovereign bonds, to finance reparations loans to Ukraine. Brussels is searching for credit collateral, regardless of origin.

          Source: Zero Hedge

          To stay updated on all economic events of today, please check out our Economic calendar
          Risk Warnings and Disclaimers
          You understand and acknowledge that there is a high degree of risk involved in trading. Following any strategies or investment methods may lead to potential losses. The content on the site is provided by our contributors and analysts for information purposes only. You are solely responsible for determining whether any trading assets, securities, strategy, or any other product is suitable for investing based on your own investment objectives and financial situation.
          Add to Favorites
          Share

          Why Did the Stock Market Drop? Main Reasons, Reactions, and What Comes Next (2025 Update)

          Winkelmann

          Stocks

          Why Did the Stock Market Drop? Analyzing the Causes and Investor Reactions in 2025

          In 2025, global markets experienced a notable decline that raised concerns among investors. This article explores the main reasons behind the stock market drop—from economic pressures to investor sentiment shifts—and examines what these developments could mean for the future.

          Part 1 — Overview: What Happened in the Stock Market

          The first quarter of 2025 saw sharp declines across major indices. The S&P 500 dropped nearly 8%, the Nasdaq lost around 10%, and the Dow Jones slipped by 6%. These movements reflected a combination of macroeconomic uncertainty, rising rates, and profit-taking after a strong 2024 rally.

          Analysts noted that while the drop was significant, it resembled a market correction rather than a long-term crash. The pullback was fueled by valuation adjustments and investor caution toward sectors with stretched earnings multiples.

          Part 2 — Key Reasons Why the Stock Market Dropped

          1. Rising Interest Rates and Inflation Pressure

          Central banks continued tightening monetary policy to combat persistent inflation. Higher borrowing costs reduced corporate profits and made equities less appealing compared to bonds. Growth stocks, particularly in technology, were hit hardest as future earnings were discounted more aggressively.

          2. Slowing Economic Growth and Recession Fears

          Global manufacturing and consumer spending data began to soften. Economists warned of potential stagflation, where growth slows while prices remain high. This combination eroded confidence and led investors to rebalance toward defensive sectors like healthcare and utilities.

          3. Corporate Earnings Disappointments

          Several major companies reported weaker-than-expected earnings. Profit margins compressed due to higher input costs and sluggish demand. Disappointing forecasts from technology and retail firms triggered broad-based selling across related sectors.

          4. Geopolitical and Policy Uncertainty

          Ongoing geopolitical tensions, trade disputes, and policy changes amplified volatility. Energy prices spiked after new supply disruptions, while investor sentiment turned risk-averse amid uncertainty around global alliances and fiscal debates.

          5. Sector Rotation and Valuation Correction

          After two years of strong gains in AI, semiconductor, and fintech stocks, valuations reached unsustainable levels. Institutional investors began rotating into lower-risk assets, sparking a wave of profit-taking that accelerated the overall market decline.

          Part 3 — Market and Investor Reactions

          Investor behavior shifted rapidly during the selloff. Volatility indexes such as the VIX surged, and trading volumes spiked as hedge funds unwound leveraged positions. At the same time, demand for safe-haven assets like gold, Treasury bonds, and the U.S. dollar increased sharply.

          Despite short-term losses, many analysts viewed the correction as a healthy reset. The market had grown overly concentrated in high-valuation stocks, and a pullback was seen as necessary for long-term stability.

          Part 4 — What It Means for Investors

          • Stay diversified: Avoid overexposure to single sectors or regions.
          • Focus on fundamentals: Favor companies with stable cash flow, low debt, and pricing power.
          • Embrace defensive positioning: Allocate to assets less sensitive to economic cycles.
          • Think long term: Corrections often create attractive entry points for disciplined investors.

          Investors who maintain perspective and avoid panic selling are more likely to benefit when market sentiment eventually improves.

          Conclusion — Why the Stock Market Dropped

          The stock market’s decline in 2025 was driven by a mix of rising interest rates, slowing growth, and valuation corrections after years of strong gains. While unsettling, the drop reflected a natural adjustment to shifting economic conditions rather than a systemic failure. Understanding these dynamics helps investors make informed decisions and prepare for the market’s eventual recovery.

          Risk Warnings and Disclaimers
          You understand and acknowledge that there is a high degree of risk involved in trading. Following any strategies or investment methods may lead to potential losses. The content on the site is provided by our contributors and analysts for information purposes only. You are solely responsible for determining whether any trading assets, securities, strategy, or any other product is suitable for investing based on your own investment objectives and financial situation.
          Add to Favorites
          Share

          USDCAD Rebounds After Positive US News

          Blue River

          Economic

          Forex

          Technical Analysis

          The USDCAD pair starts the week with a recovery attempt after last week’s decline, currently trading at 1.4023. Find more details in our analysis for 20 October 2025.

          USDCAD forecast: key trading points

          • President Donald Trump expressed confidence in the further development of trade relations with China
          • Foreign investors increased their holdings of Canadian securities
          • Growth was primarily driven by investments in Canadian debt instruments
          • USDCAD forecast for 20 October 2025: 1.4115

          Fundamental analysis

          The USDCAD rate is strengthening after Friday’s sharp drop. The US dollar is attempting to rise thanks to investors’ positive reaction to comments from President Donald Trump, which eased fears of a possible escalation in the US-China trade conflict. Trump voiced confidence in the continued development of trade relations between the two countries, emphasising the need for a fair and mutually beneficial agreement.

          Meanwhile, foreign investors invested 25.9 billion CAD in Canadian securities in August 2025, compared to 26.7 billion CAD a month earlier. The main driver of this inflow was investment in Canadian debt instruments, which rose to 32.6 billion CAD, the highest level since April 2024.

          USDCAD technical analysis

          The USDCAD pair continues to move within an ascending channel despite sellers’ attempts to trigger a correction.

          After a short-term decline, the price is testing the lower boundary of the channel, indicating that buying interest remains intact. The Stochastic Oscillator shows a rebound from oversold territory, with a potential upward crossover forming, confirming the market’s readiness to resume growth.

          Today’s USDCAD forecast expects bullish movement to continue, with a near-term target at 1.4115. A firm consolidation above 1.4045 would confirm a breakout above the upper boundary of the corrective downtrend channel and signal further upside potential.

          Summary

          With the US dollar strengthening and steady investor interest in Canadian assets, the short-term USDCAD outlook remains bullish. Technical analysis suggests that the pair retains upward momentum, with the next upside target near 1.4115.

          Source: RoboForex

          To stay updated on all economic events of today, please check out our Economic calendar
          Risk Warnings and Disclaimers
          You understand and acknowledge that there is a high degree of risk involved in trading. Following any strategies or investment methods may lead to potential losses. The content on the site is provided by our contributors and analysts for information purposes only. You are solely responsible for determining whether any trading assets, securities, strategy, or any other product is suitable for investing based on your own investment objectives and financial situation.
          Add to Favorites
          Share

          China Eyes 5% Growth Despite Sharp Slowdown and Structural Risks

          Gerik

          Economic

          Diverging Growth Masks China’s Underlying Economic Fragility

          China’s economy is navigating a complex balancing act in 2025 grappling with internal weakness even as external demand continues to provide a temporary cushion. According to the National Bureau of Statistics, the economy grew by 4.8% in Q3 compared to the same period last year, marking the weakest pace since Q3 2024. While the figure slightly exceeded analysts’ expectations, it underscores the growing divergence in sectoral performance a trend that casts doubts over the sustainability of Beijing’s 5% annual growth target.
          Policymakers, however, remain optimistic. Officials emphasized that the 5.2% growth achieved across the first nine months offers a “solid foundation” for hitting the full-year target. But behind this confidence lies a stark contrast in performance between strong industrial output and faltering consumption and investment.

          Booming Exports Buffer Domestic Weakness

          China's export resilience continues to anchor growth despite heightened trade tensions with the United States. In fact, record demand for Chinese goods abroad has helped maintain headline growth even as the domestic economy wrestles with deflation, sluggish consumer recovery, and excess capacity. This global demand especially from emerging markets pivoting away from U.S.-centric supply chains has kept factories humming.
          September’s industrial output surprised to the upside, growing 6.5% and surpassing all forecasts. This suggests that China’s manufacturing engine remains robust though increasingly dependent on external markets.

          Trouble at Home: Consumption and Investment Slump

          On the domestic front, signs of strain are growing more visible. Retail sales rose at the slowest pace since November 2024, reflecting tepid consumer sentiment a byproduct of continued weakness in the housing market and labor insecurity.
          Fixed-asset investment declined year-to-date for the first time since 2020. This was primarily driven by a deepening crisis in real estate, but even infrastructure and manufacturing saw marked slowdowns. Manufacturing investment growth has cooled from nearly 10% earlier in the year to just 4%, while infrastructure investment rose only 1.1% the weakest in five years.
          The nominal GDP growth of just 3.7% in Q3 unadjusted for deflation further highlights the pressure on corporate revenues, wage growth, and real purchasing power. The GDP deflator declined for the 10th consecutive quarter, marking China’s longest deflation streak in recent history.

          Policy Response: Fiscal Stimulus Over Monetary Easing

          Rather than rushing into further monetary easing, Chinese authorities appear to be leaning more heavily on fiscal levers. On Friday, the Ministry of Finance unlocked 500 billion yuan (~US$70 billion) in unused local government bond quotas. These funds aim to repay corporate arrears, reduce off-balance-sheet debt, and inject capital into productive investments.
          BNP Paribas economist Jacqueline Rong believes this fiscal pivot may lift infrastructure investment in Q4, counteracting the sharp dip from July to September. Similarly, Standard Chartered’s Ding Shuang suggests that planned interest rate cuts may now be delayed given the recent fiscal momentum and moderate recovery signals.

          Political Context: Fourth Plenum and Global Watchfulness

          The timing of this economic data release coincides with the high-level Fourth Plenum in Beijing, where China’s leadership is mapping out its 15th Five-Year Plan. Investors and foreign governments alike are closely watching whether President Xi Jinping will commit to rebalancing China’s growth model toward domestic consumption, which would address structural imbalances and reduce dependency on volatile exports.
          International dialogue is also ramping up. Ahead of the anticipated Trump-Xi meeting later this month, U.S. Treasury Secretary Scott Bessent is meeting with Vice Premier He Lifeng to address issues including rare earths, fentanyl exports, and trade barriers. Despite renewed tensions, markets responded positively to signs of potential de-escalation: the CSI 300 Index gained 1.3%, and Chinese stocks in Hong Kong jumped 2.5%.

          Slower Growth, Sharper Contrasts

          China’s 4.8% Q3 growth reveals an economy at a crossroads slowing overall but with sharply contrasting sectoral dynamics. Industrial production and exports remain buoyant, but weak consumer spending, a deflating property sector, and falling investment point to deeper structural issues.
          As policymakers prepare for long-term planning, the challenge is no longer just reaching a growth target, but ensuring the quality and sustainability of that growth. Without significant efforts to restore consumer confidence and address the imbalance between supply and demand, China’s economic resilience may prove increasingly fragile in the years ahead.

          Source: Bloomberg

          To stay updated on all economic events of today, please check out our Economic calendar
          Risk Warnings and Disclaimers
          You understand and acknowledge that there is a high degree of risk involved in trading. Following any strategies or investment methods may lead to potential losses. The content on the site is provided by our contributors and analysts for information purposes only. You are solely responsible for determining whether any trading assets, securities, strategy, or any other product is suitable for investing based on your own investment objectives and financial situation.
          Add to Favorites
          Share

          UBS Maintains EUR/CHF Forecast at 0.94 Amid Swiss Franc Safe-haven Demand

          Glendon

          Forex

          Economic

          UBS has maintained its EUR/CHF forecast at 0.94 for the period spanning the fourth quarter of 2025 through the third quarter of 2026, despite recent downward pressure on the currency pair.

          The EURCHF exchange rate has experienced sustained downward pressure recently due to global political events and the ongoing rally in gold prices, which has bolstered the Swiss franc’s position as a safe-haven currency, according to UBS.

          Safe-haven demand for the Swiss franc currently remains elevated, but UBS expects this to change in the medium term as U.S. political and trade uncertainties resolve, potentially making the CHF less attractive and allowing the EUR/CHF to gradually rise toward the 0.94 target.

          With Swiss interest rates at zero, UBS analysts believe the euro offers better total returns than the Swiss franc, supporting their maintained forecast for the currency pair.

          The bank’s outlook suggests a stabilization of the EUR/CHF exchange rate in the coming quarters, despite current market pressures that have strengthened the Swiss currency against the euro.

          Source: Investing

          To stay updated on all economic events of today, please check out our Economic calendar
          Risk Warnings and Disclaimers
          You understand and acknowledge that there is a high degree of risk involved in trading. Following any strategies or investment methods may lead to potential losses. The content on the site is provided by our contributors and analysts for information purposes only. You are solely responsible for determining whether any trading assets, securities, strategy, or any other product is suitable for investing based on your own investment objectives and financial situation.
          Add to Favorites
          Share
          FastBull
          Copyright © 2025 FastBull Ltd

          728 RM B 7/F GEE LOK IND BLDG NO 34 HUNG TO RD KWUN TONG KLN HONG KONG

          TelegramInstagramTwitterfacebooklinkedin
          App Store Google Play Google Play
          Products
          Charts

          Chats

          Q&A with Experts
          Screeners
          Economic Calendar
          Data
          Tools
          Membership
          Features
          Function
          Markets
          Copy Trading
          Latest Signals
          Contests
          News
          Analysis
          24/7
          Columns
          Education
          Company
          Careers
          About Us
          Contact Us
          Advertising
          Help Center
          Feedback
          User Agreement
          Privacy Policy
          Business

          White Label

          Data API

          Web Plug-ins

          Poster Maker

          Affiliate Program

          Risk Disclosure

          The risk of loss in trading financial instruments such as stocks, FX, commodities, futures, bonds, ETFs and crypto can be substantial. You may sustain a total loss of the funds that you deposit with your broker. Therefore, you should carefully consider whether such trading is suitable for you in light of your circumstances and financial resources.

          No decision to invest should be made without thoroughly conducting due diligence by yourself or consulting with your financial advisors. Our web content might not suit you since we don't know your financial conditions and investment needs. Our financial information might have latency or contain inaccuracy, so you should be fully responsible for any of your trading and investment decisions. The company will not be responsible for your capital loss.

          Without getting permission from the website, you are not allowed to copy the website's graphics, texts, or trademarks. Intellectual property rights in the content or data incorporated into this website belong to its providers and exchange merchants.

          Not Logged In

          Log in to access more features

          FastBull Membership

          Not yet

          Purchase

          Become a signal provider
          Help Center
          Customer Service
          Dark Mode
          Price Up/Down Colors

          Log In

          Sign Up

          Position
          Layout
          Fullscreen
          Default to Chart
          The chart page opens by default when you visit fastbull.com