


- WTI
- XAUUSD
- XAGUSD
- USDX


Markets
Analysis
User
24/7
Economic Calendar
Education
Data
- Names
- Latest
- Prev


Since last Thursday, gold has seen a rapid and sharp pullback. Prices fell from near the $5,600 all-time high, with a maximum decline of over $1,000 in just three trading days, amplifying volatility.
Since last Thursday, gold has seen a rapid and sharp pullback. Prices fell from near the $5,600 all-time high, with a maximum decline of over $1,000 in just three trading days, amplifying volatility.
The immediate trigger was Trump's nomination of Kevin Warsh as the next Fed Chair. The news quickly prompted a market repricing of Fed policy, boosting hawkish expectations. At the same time, frequent increases in CME futures margins and easing geopolitical tensions further heightened de-leveraging pressure on long positions.
Looking ahead to this week, traders are focused on a series of key U.S. economic data, including the nonfarm payroll report, to gauge gold's direction after the recent swings.
After long positions were further stretched at the start of last week, XAUUSD briefly spiked to $5,598 on Thursday, just shy of the $5,600 mark. What traders had long feared—a sharp correction—quickly unfolded, with prices dipping to $5,100 that same day.
On Friday, gold's intraday drawdown exceeded 12%, breaching the key $5,000 psychological level. The RSI fell sharply from extreme overbought levels near 90 back to neutral, reflecting a concentrated unwinding of previously overcrowded long positions.

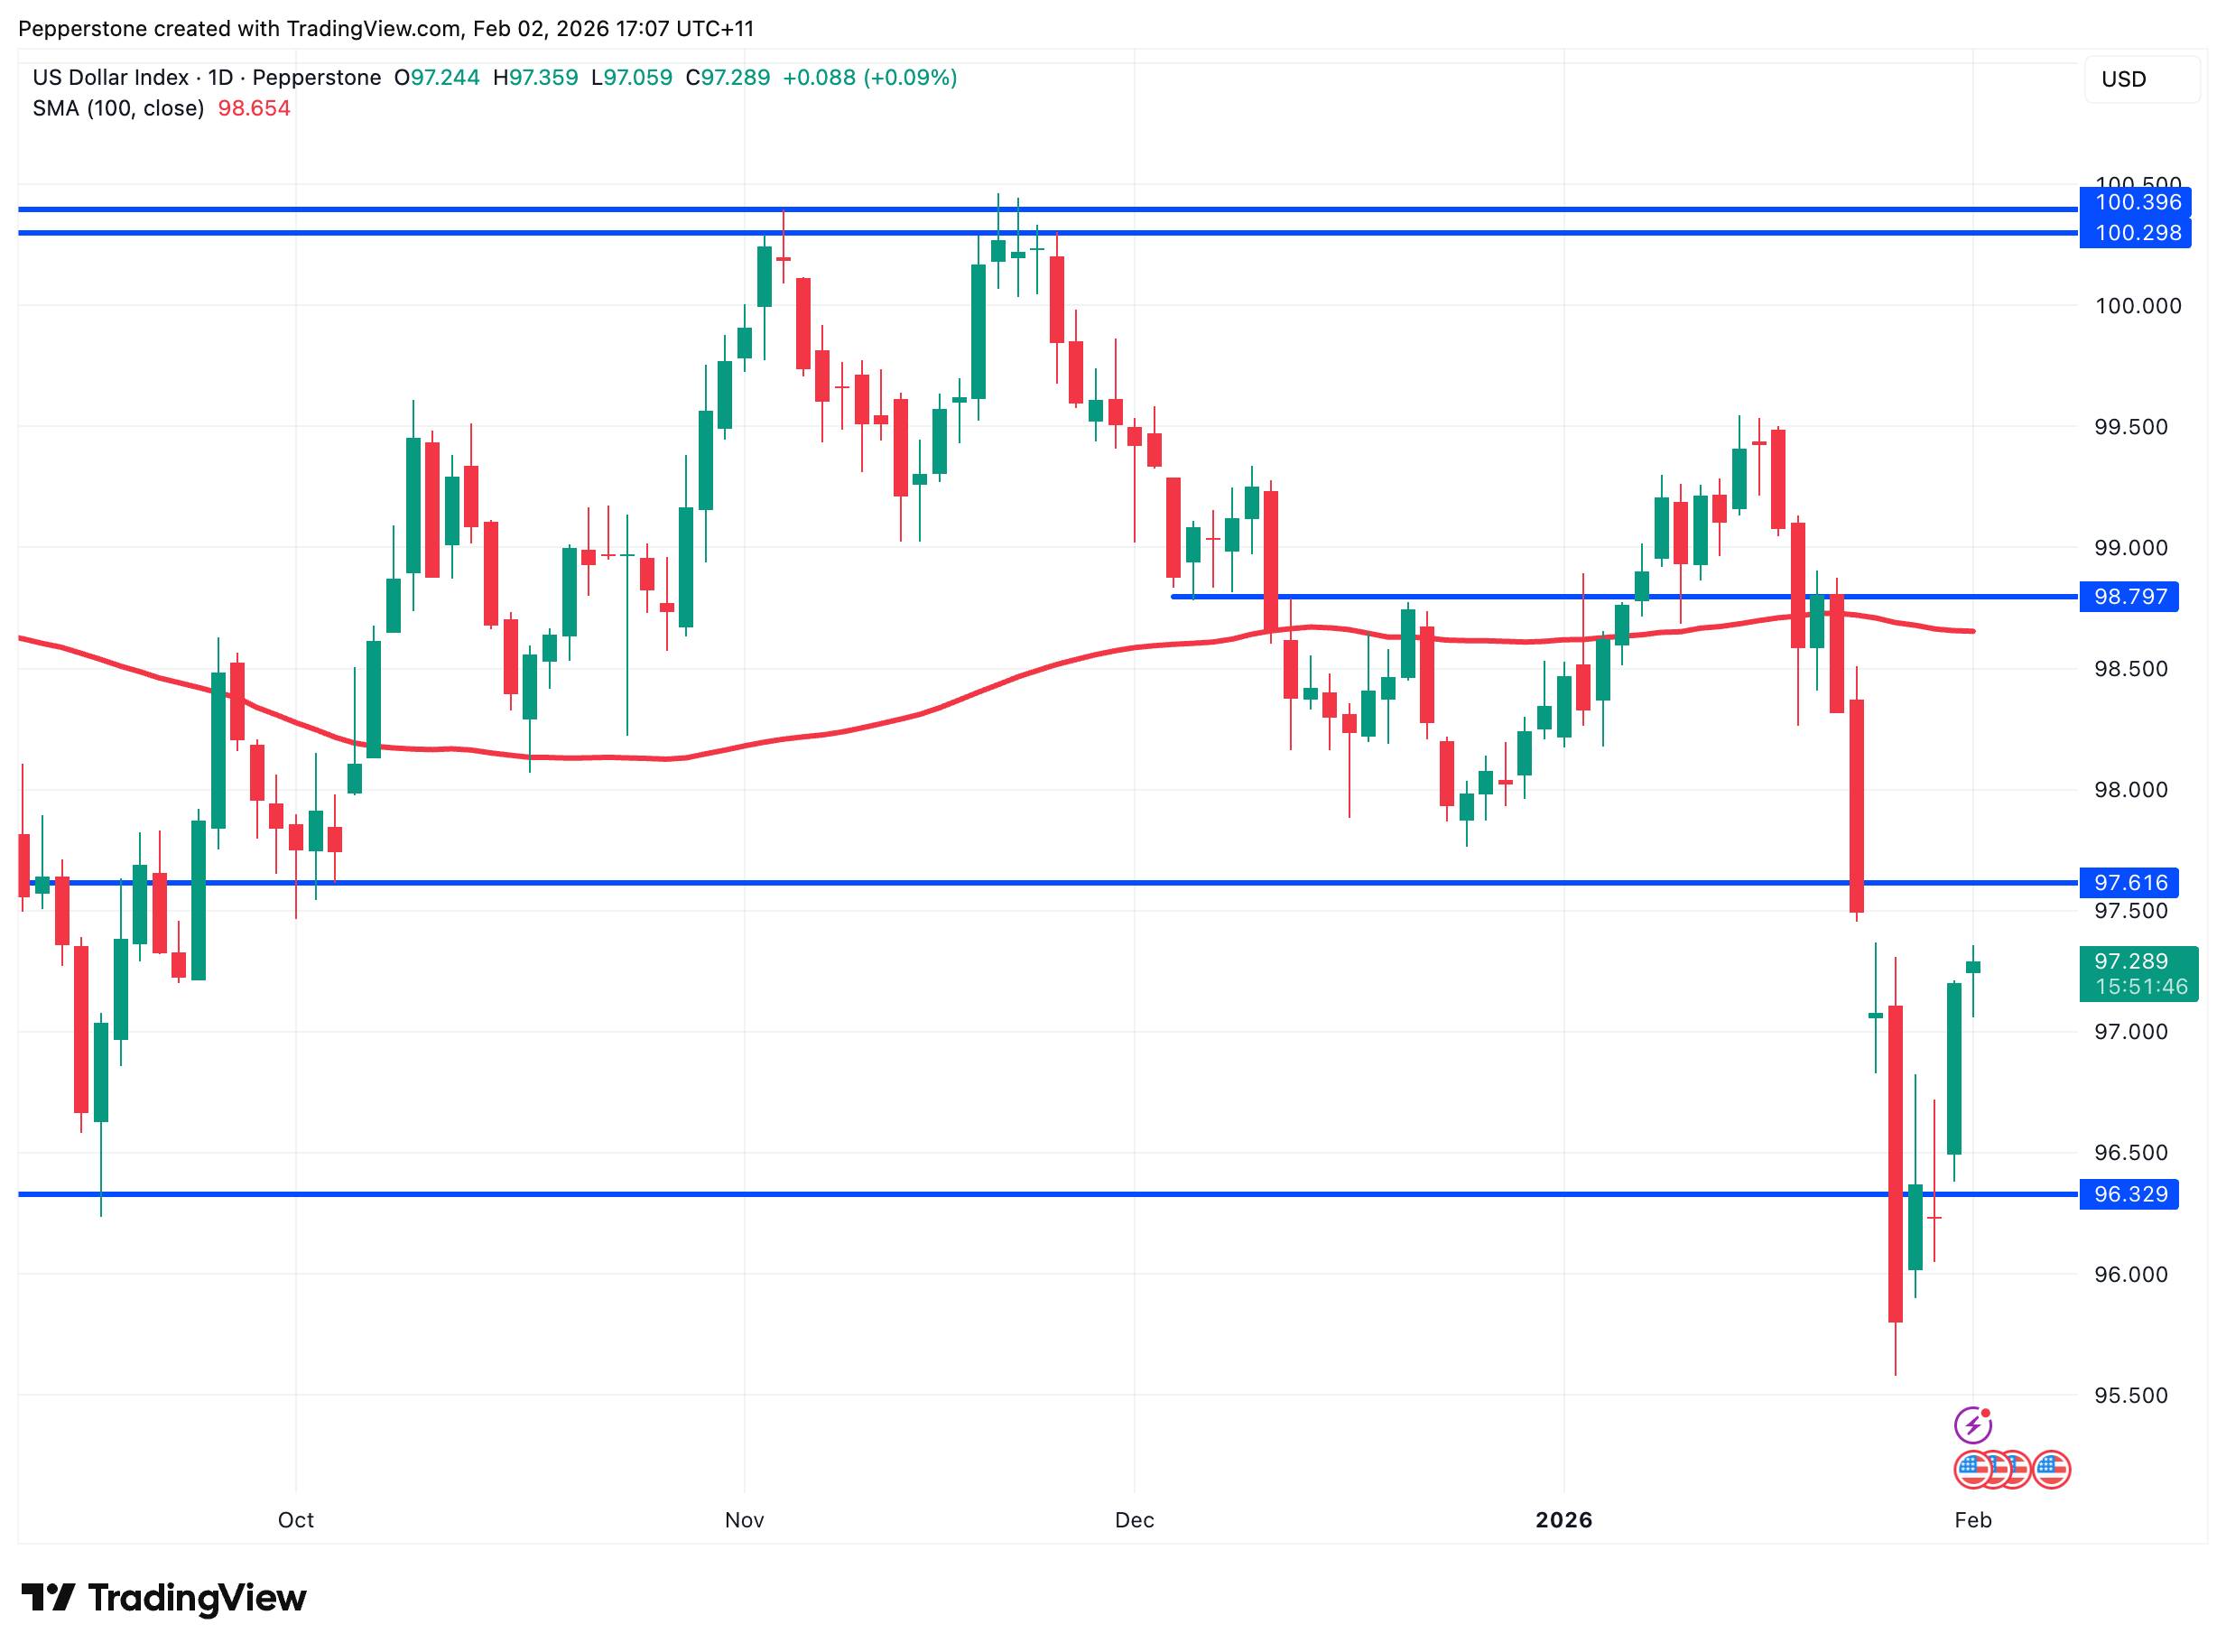
Bearish momentum has continued into this week, with prices down more than $1,000 from the record highs, currently testing December's high at $4,550. If selling pressure persists, support may be found near $4,300 and the 100-day moving average.
Conversely, if $4,550 holds and buyers step back in, resistance may emerge around $4,630 and Friday's close near $4,880, with $4,980–$5,000 remaining the key range for a retest. A sustained move above $5,100 would help confirm the re-establishment of a bullish trend.
Last week, Trump officially nominated Kevin Warsh as the next Fed Chair, triggering gold's pullback from record highs.
Compared with other potential candidates, Warsh is viewed as both policy credible and politically flexible: he may support rate cuts in coordination with Trump under the right conditions but has a low tolerance for inflation and has long advocated shrinking the Fed's balance sheet.
Markets quickly interpreted his nomination as a hawkish tilt for the Fed. The DXY rebounded sharply from four-year lows, pressuring dollar-denominated gold. Warsh's perceived ability to preserve Fed independence also reduced gold's appeal as a hedge against policy uncertainty.
Importantly, gold's pullback wasn't solely about the news itself but reflected over-concentrated long positions, which made the market extremely sensitive to any negative catalyst. Warsh's nomination ultimately became the "final straw" for high-position longs.
Combined with Friday night's extreme moves, some quantitative and programmatic strategies likely triggered stop-losses in a highly leveraged, volatile environment, amplifying the selloff.
Higher Margins and Easing Geopolitics Accelerate De-leveraging
Beyond the Fed nomination, two additional factors magnified gold's retreat.
First, since mid-January, CME changed its precious metals margin calculation from a fixed dollar amount to a percentage of contract size. On top of this, CME raised maintenance margins five times over nine trading days as of last week, sharply increasing margin calls and forced liquidations, prompting some participants to exit positions.
Second, easing geopolitical tensions reduced gold's safe-haven demand. News of renewed U.S.–Iran engagement and plans for an early February Russia–Ukraine trilateral meeting helped cool risk pricing, acting as a short-term headwind for gold.
Despite significant near-term selling, gold's three core medium- to long-term drivers remain intact: rising global sovereign credit risk, the Fed's ongoing rate-cut, and policy/geopolitical uncertainty driving safe-haven demand.
Developed economies continue to face mounting debt pressures, from the U.S.'s "One Big Beautiful Bill" push, Takaichi's fiscal expansion proposals, to Eurozone's increasing spending plans. Compared with fiscal discipline, the "debt competition" trend is intensifying.
Against this backdrop, concerns over fiscal sustainability and institutional credibility keep central banks purchasing gold, providing long-term support.
From the Fed rate path perspective, structural weakness remains in the U.S. labor market, while tariff-driven inflation effects are more likely one-off. Even with Warsh's hawkish tilt, the market still prices in two rate cuts by year-end, meaning this pullback reflects sentiment and positioning more than a fundamental shift.
Additionally, intermittent geopolitical developments, the Fed transition, and the upcoming U.S. midterms add to policy uncertainty, potentially reigniting safe-haven demand.
After such volatility, gold's medium-term bullish case remains, and the price base is likely to rise gradually amid ongoing fluctuations.
Next for Gold: Watch Nonfarm Payrolls
Overall, the recent plunge in gold reflects profit-taking, policy repricing, and forced de-leveraging. Concerns over sovereign credit, Fed rate-cut prospects, and policy/geopolitical uncertainty remain the market consensus.
While the medium-term path of least resistance for gold is still upward, the market is in a pronounced "mechanical de-leveraging" phase.
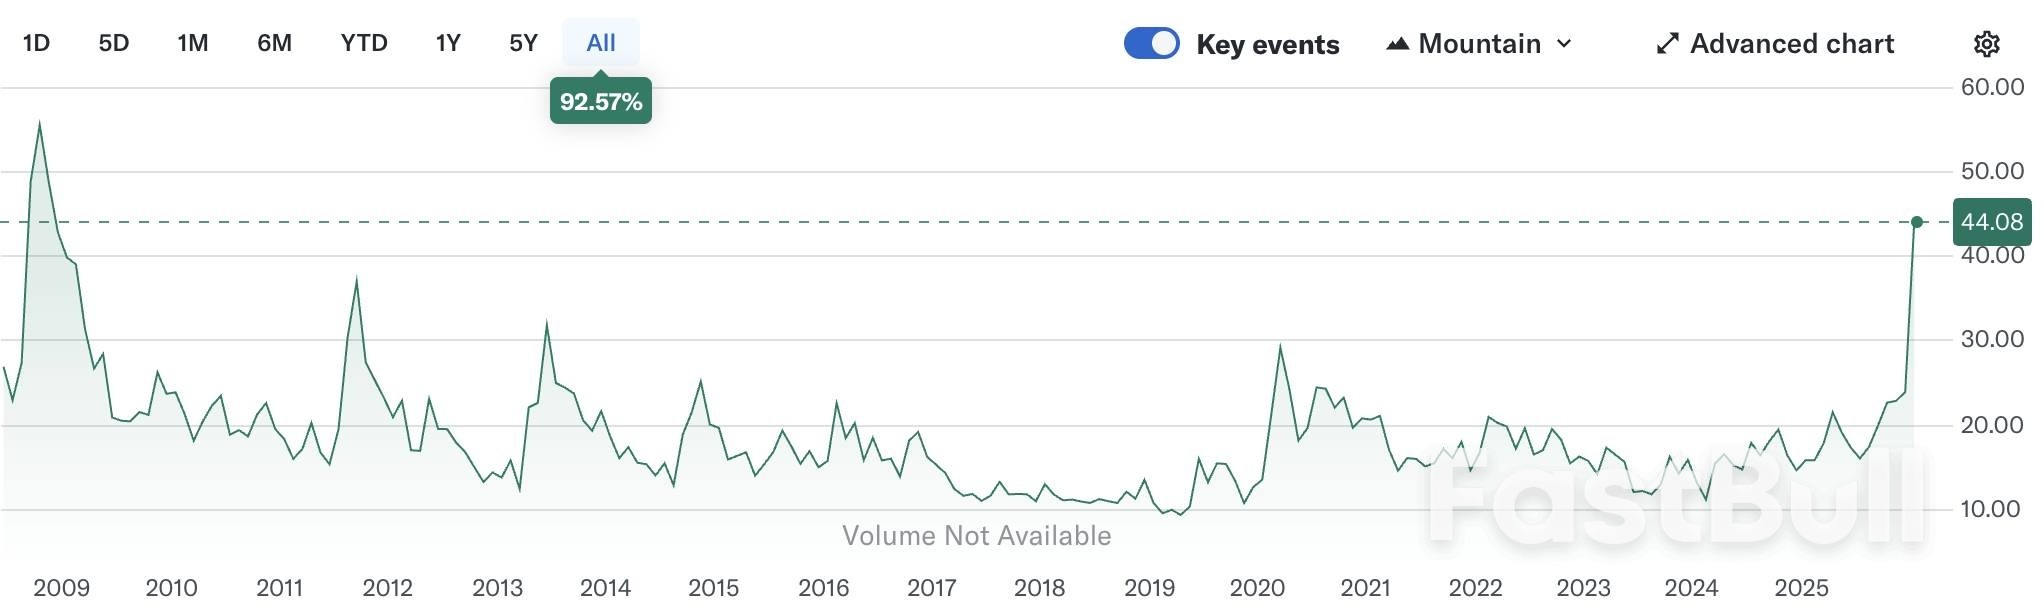
Gold implied volatility (GVZ) is far above historical averages, approaching levels last seen during the 2008 GFC, making short-term bottom-fishing risky. Traders are likely waiting for clearer trend confirmation.
This week, several key U.S. economic data points will be released, with the January nonfarm payroll report as the highlight. The market is expecting 68,000 new jobs, up from 50,000 previously, with the unemployment rate steady at 4.4%.
If the results meet expectations, labor market resilience may keep pressure on gold. If the data significantly undershoot—say, 30,000–50,000 new jobs and unemployment rises to 4.5%—gold may receive support.
That said, with Powell's term ending in May, the chances of an earlier rate cut remain slim, so any impact on gold is likely to be short-lived and driven mainly by volatility.
728 RM B 7/F GEE LOK IND BLDG NO 34 HUNG TO RD KWUN TONG KLN HONG KONG


The risk of loss in trading financial instruments such as stocks, FX, commodities, futures, bonds, ETFs and crypto can be substantial. You may sustain a total loss of the funds that you deposit with your broker. Therefore, you should carefully consider whether such trading is suitable for you in light of your circumstances and financial resources.
No decision to invest should be made without thoroughly conducting due diligence by yourself or consulting with your financial advisors. Our web content might not suit you since we don't know your financial conditions and investment needs. Our financial information might have latency or contain inaccuracy, so you should be fully responsible for any of your trading and investment decisions. The company will not be responsible for your capital loss.
Without getting permission from the website, you are not allowed to copy the website's graphics, texts, or trademarks. Intellectual property rights in the content or data incorporated into this website belong to its providers and exchange merchants.
Not Logged In
Log in to access more features


Log In
Sign Up


