• Trade
  • Markets
  • Copy
  • Contests
  • News
  • 24/7
  • Calendar
  • Q&A
  • Chats
Trending
Screeners
SYMBOL
LAST
BID
ASK
HIGH
LOW
NET CHG.
%CHG.
SPREAD
SPX
S&P 500 Index
6863.49
6863.49
6863.49
6873.88
6858.27
+28.99
+ 0.42%
--
DJI
Dow Jones Industrial Average
48274.73
48274.73
48274.73
48373.89
48201.93
+139.85
+ 0.29%
--
IXIC
NASDAQ Composite Index
23412.92
23412.92
23412.92
23476.50
23385.31
+105.29
+ 0.45%
--
USDX
US Dollar Index
97.900
97.980
97.900
98.350
97.850
-0.430
-0.44%
--
EURUSD
Euro / US Dollar
1.17610
1.17617
1.17610
1.17660
1.17058
+0.00542
+ 0.46%
--
GBPUSD
Pound Sterling / US Dollar
1.34473
1.34482
1.34473
1.34570
1.33679
+0.00744
+ 0.56%
--
XAUUSD
Gold / US Dollar
4418.11
4418.52
4418.11
4428.92
4337.85
+79.58
+ 1.83%
--
WTI
Light Sweet Crude Oil
57.800
57.830
57.800
58.074
56.610
+1.407
+ 2.49%
--

Community Accounts

Signal Accounts
--
Profit Accounts
--
Loss Accounts
--
View More

Become a signal provider

Sell trading signals to earn additional income

View More

Guide to Copy Trading

Get started with ease and confidence

View More

Signal Accounts for Members

All Signal Accounts

Best Return
  • Best Return
  • Best P/L
  • Best MDD
Past 1W
  • Past 1W
  • Past 1M
  • Past 1Y

All Contests

  • All
  • Trump Updates
  • Recommend
  • Stocks
  • Cryptocurrencies
  • Central Banks
  • Featured News
Top News Only
Share

J&J: European Commission Approves Tremfya For Treatment Of Children With Plaque Psoriasis

Share

Russian Central Bank: Sets Official Rouble Rate For December 23 At 79.3146 Roubles Per USA Dollar (Previous Rate - 80.7220)

Share

CEO: Daiwa To Raise M&A Revenue Target To 100 Billion Yen By 2031

Share

Russell 2000 Index Up 1.1%

Share

White House Official - Trump, Hegseth To Make Shipbuilding Announcement On Monday

Share

S&P 500 Utilities Sector Hits Over Three-Month Low, Last Down 0.6%

Share

S&P 500 Materials Sector Hits Three-Month High, Last Up 0.7%

Share

[New York Cocoa Prices Rebound As Traders Focus On Buying Driven By Index Rebalancing] New York Cocoa Futures Rebounded From Near Two-week Lows As Markets Anticipated An Impending Surge In Index-related Buying And Continued Supply Uncertainty. Prices Rose As Much As 2.7% On Monday After Hitting Their Lowest Level Since December 9. With Cocoa's Inclusion In The Bloomberg Commodity Index, Citigroup Expects The Index Rebalancing To Attract Up To $2 Billion In Buying In Early January. Peak Trading Research Estimates This Could Trigger Buying Of Approximately 31,190 Contracts. Peak Trading Research Founder Dave Whitcomb Noted That Cocoa Futures Are Among The Most Oversold Commodities In The Agricultural Market, Making Them Highly Susceptible To Rebounds

Share

The Euro/dollar Pair Extended Its Gains To 0.50% On The Day, Currently Trading At 1.1766

Share

U.S. Securities And Exchange Commission (SEC): Edgar Will Be Closed From December 24-26

Share

The Pound Rose To 1.3457 Against The Dollar, A New High Since October 17

Share

The US Dollar Index Fell 0.50% On The Day, Currently Trading At 98.24

Share

Dominion Energy Shares Fall 3.8% After Trump Administration Pauses Leases For Offshore Wind Projects

Share

Clearwater Analytics Shares Gain 8.4% After Permira, Warburg Pincus To Buy Co For $8.4 Billion

Share

The Nasdaq Golden Dragon China Index Rose About 0.4% In Early Trading

Share

Velo3D Shares Jump 25% After Securing $32.6 Million Contract With US Department Of War

Share

SPDR Gold Shares ETF Up 1.9%

Share

UK Government: Spring Forecast Will Not Make An Assessment Of The Government's Performance Against The Fiscal Mandate And Instead Provide An Interim Update On The Economy And Public Finances

Share

UK Government: Chancellor Has Asked The Office For Budget Responsibility To Prepare Forecast For 3 March

Share

Turkish End-Nov Central Government Debt Stock 13325 Billion Lira

TIME
ACT
FCST
PREV
Euro Zone Current Account (Not SA) (Oct)

A:--

F: --

P: --

Euro Zone Current Account (SA) (Oct)

A:--

F: --

P: --

Russia Key Rate

A:--

F: --

P: --

U.K. CBI Distributive Trades (Dec)

A:--

F: --

P: --

U.K. CBI Retail Sales Expectations Index (Dec)

A:--

F: --

P: --

Brazil Current Account (Nov)

A:--

F: --

P: --

Canada Retail Sales MoM (SA) (Oct)

A:--

F: --

P: --
Canada New Housing Price Index MoM (Nov)

A:--

F: --

P: --

Canada Core Retail Sales MoM (SA) (Oct)

A:--

F: --

P: --
U.S. Existing Home Sales Annualized MoM (Nov)

A:--

F: --

P: --
U.S. UMich Consumer Sentiment Index Final (Dec)

A:--

F: --

P: --

U.S. Conference Board Employment Trends Index (SA) (Nov)

A:--

F: --

P: --
Euro Zone Consumer Confidence Index Prelim (Dec)

A:--

F: --

P: --

U.S. UMich 1-Year-Ahead Inflation Expectations Final (Dec)

A:--

F: --

P: --

U.S. UMich Consumer Expectations Index Final (Dec)

A:--

F: --

P: --

U.S. UMich Current Economic Conditions Index Final (Dec)

A:--

F: --

P: --

U.S. Existing Home Sales Annualized Total (Nov)

A:--

F: --

P: --
U.S. Weekly Total Rig Count

A:--

F: --

P: --

U.S. Weekly Total Oil Rig Count

A:--

F: --

P: --

China, Mainland 5-Year Loan Prime Rate

A:--

F: --

P: --

China, Mainland 1-Year Loan Prime Rate (LPR)

A:--

F: --

P: --

U.K. Current Account (Q3)

A:--

F: --

P: --
U.K. GDP Final YoY (Q3)

A:--

F: --

P: --

U.K. GDP Final QoQ (Q3)

A:--

F: --

P: --
Italy PPI YoY (Nov)

A:--

F: --

P: --

Mexico Economic Activity Index YoY (Oct)

A:--

F: --

P: --

Canada National Economic Confidence Index

A:--

F: --

P: --

Canada Industrial Product Price Index YoY (Nov)

A:--

F: --

P: --
U.S. Chicago Fed National Activity Index (Nov)

A:--

F: --

P: --
Canada Industrial Product Price Index MoM (Nov)

A:--

F: --

P: --
RBA Monetary Policy Meeting Minutes
Euro Zone Total Reserve Assets (Nov)

--

F: --

P: --

Mexico Trade Balance (Nov)

--

F: --

P: --

Canada GDP YoY (Oct)

--

F: --

P: --

Canada GDP MoM (SA) (Oct)

--

F: --

P: --

U.S. Core PCE Price Index Prelim YoY (Q3)

--

F: --

P: --

U.S. PCE Price Index Prelim YoY (Q3)

--

F: --

P: --

U.S. Annualized Real GDP Prelim (Q3)

--

F: --

P: --

U.S. Non-Defense Capital Durable Goods Orders MoM (Excl. Aircraft) (Oct)

--

F: --

P: --

U.S. PCE Price Index Prelim QoQ (SA) (Q3)

--

F: --

P: --

U.S. Core PCE Price Index Annualized QoQ Prelim (SA) (Q3)

--

F: --

P: --

U.S. GDP Deflator Prelim QoQ (SA) (Q3)

--

F: --

P: --

U.S. Durable Goods Orders MoM (Excl. Defense) (SA) (Oct)

--

F: --

P: --

U.S. Durable Goods Orders MoM (Excl.Transport) (Oct)

--

F: --

P: --

U.S. Real Personal Consumption Expenditures Prelim QoQ (Q3)

--

F: --

P: --

U.S. Real GDP Annualized QoQ Prelim (SA) (Q3)

--

F: --

P: --

U.S. Durable Goods Orders MoM (Oct)

--

F: --

P: --

U.S. Weekly Redbook Index YoY

--

F: --

P: --

U.S. Manufacturing Output MoM (SA) (Nov)

--

F: --

P: --

U.S. Manufacturing Capacity Utilization (Nov)

--

F: --

P: --

U.S. Industrial Output YoY (Nov)

--

F: --

P: --

U.S. Industrial Output MoM (SA) (Nov)

--

F: --

P: --

U.S. Capacity Utilization MoM (SA) (Nov)

--

F: --

P: --

U.S. Richmond Fed Manufacturing Shipments Index (Dec)

--

F: --

P: --

U.S. Richmond Fed Services Revenue Index (Dec)

--

F: --

P: --

U.S. Conference Board Consumer Expectations Index (Dec)

--

F: --

P: --

U.S. Conference Board Present Situation Index (Dec)

--

F: --

P: --

U.S. Richmond Fed Manufacturing Composite Index (Dec)

--

F: --

P: --

Q&A with Experts
    • All
    • Chatrooms
    • Groups
    • Friends
    Connecting
    .
    .
    .
    Type here...
    Add Symbol or Code

      No matching data

      All
      Trump Updates
      Recommend
      Stocks
      Cryptocurrencies
      Central Banks
      Featured News
      • All
      • Russia-Ukraine Conflict
      • Middle East Flashpoint
      • All
      • Russia-Ukraine Conflict
      • Middle East Flashpoint

      Search
      Products

      Charts Free Forever

      Chats Q&A with Experts
      Screeners Economic Calendar Data Tools
      Membership Features
      Data Warehouse Market Trends Institutional Data Policy Rates Macro

      Market Trends

      Market Sentiment Order Book Forex Correlations

      Top Indicators

      Charts Free Forever
      Markets

      News

      News Analysis 24/7 Columns Education
      From Institutions From Analysts
      Topics Columnists

      Latest Views

      Latest Views

      Trending Topics

      Top Columnists

      Latest Update

      Signals

      Copy Rankings Latest Signals Become a signal provider AI Rating
      Contests
      Brokers

      Overview Brokers Assessment Rankings Regulators News Claims
      Broker listing Forex Brokers Comparison Tool Live Spread Comparison Scam
      Q&A Complaint Scam Alert Videos Tips to Detect Scam
      More

      Business
      Events
      Careers About Us Advertising Help Center

      White Label

      Data API

      Web Plug-ins

      Affiliate Program

      Awards Institution Evaluation IB Seminar Salon Event Exhibition
      Vietnam Thailand Singapore Dubai
      Fans Party Investment Sharing Session
      FastBull Summit BrokersView Expo
      Recent Searches
        Top Searches
          Markets
          News
          Analysis
          User
          24/7
          Economic Calendar
          Education
          Data
          • Names
          • Latest
          • Prev

          View All

          No data

          Scan to Download

          Faster Charts, Chat Faster!

          Download App
          English
          • English
          • Español
          • العربية
          • Bahasa Indonesia
          • Bahasa Melayu
          • Tiếng Việt
          • ภาษาไทย
          • Français
          • Italiano
          • Türkçe
          • Русский язык
          • 简中
          • 繁中
          Open Account
          Search
          Products
          Charts Free Forever
          Markets
          News
          Signals

          Copy Rankings Latest Signals Become a signal provider AI Rating
          Contests
          Brokers

          Overview Brokers Assessment Rankings Regulators News Claims
          Broker listing Forex Brokers Comparison Tool Live Spread Comparison Scam
          Q&A Complaint Scam Alert Videos Tips to Detect Scam
          More

          Business
          Events
          Careers About Us Advertising Help Center

          White Label

          Data API

          Web Plug-ins

          Affiliate Program

          Awards Institution Evaluation IB Seminar Salon Event Exhibition
          Vietnam Thailand Singapore Dubai
          Fans Party Investment Sharing Session
          FastBull Summit BrokersView Expo

          Gold Breaches $4400/oz, Silver Up 2.75%, Nikkei Rises 1.9% & FTSE 100 Eyes Short-Term Pullback

          MarketPulse by OANDA Group

          Forex

          Stocks

          Commodity

          Summary:

          Stock markets around the world are rising as investors feel optimistic about a strong finish to the year, encouraged by recent gains in the US.

          Asia Market Wrap – Nikkei Rises 1.9% as Global Equities Rise

          Stock markets around the world are rising as investors feel optimistic about a strong finish to the year, encouraged by recent gains in the US.A key index that tracks global stocks has gone up for three days in a row, reaching its highest level since mid-December, and is predicted to grow nearly 20% in 2025.

          In Asia, Japan's Nikkei climbed 1.9% because a cheaper currency is expected to help companies that sell goods abroad make more money. Similarly, Chinese stocks saw gains, while Singapore's market reached a new record high.

          European Session – European Shares On Course to Open Lower

          European stock markets are expected to open with small losses on Monday, pausing after last week's rally as trading slows down for the short Christmas holiday week.

          Even with lighter trading activity expected, investor confidence remains high due to renewed excitement about AI companies and hopes that the US Federal Reserve will lower interest rates next year. Traders are also less worried about the European Central Bank raising rates in the future.

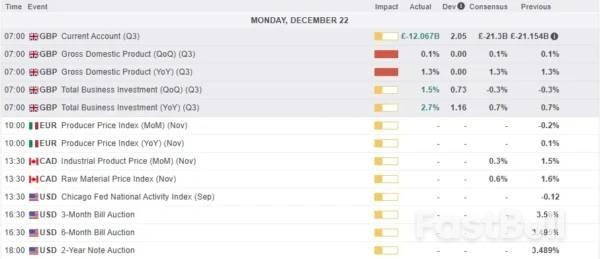
          However, there is still some caution as investors watch the war in Ukraine, following comments from Russia that recent peace proposals haven't improved the situation. In economic news, the UK is set to release its final growth figures later today, while early trading shows major European indexes down by roughly 0.1% to 0.2%.

          On the FX front, the Japanese yen remained very weak on Monday, hovering near record lows against the Euro and Swiss Franc.

          Traders feel confident betting against the yen because the Bank of Japan hasn't signaled any plans to raise interest rates, even though government officials have warned they might step in to support the currency.

          The yen also sat near an 11-month low against the US dollar and a 17-month low against the Australian dollar. While the US dollar dipped slightly to 157.37 yen, it remains close to recent highs.

          Meanwhile, the Swiss franc reached a new record against the yen, and the Australian dollar climbed to its strongest level since last July.

          Currency Power Balance

          Source: OANDA Labs

          Silver was the standout performer in commodities, hitting a new record high of $69.44/oz, which brings its total gains for the year to nearly 140%. Gold also increased in value, rising 1.5% to breach $4400/oz.

          In the energy market, oil prices went up after the US stopped a Venezuelan oil tanker and began chasing another, marking the third such incident in under two weeks. As a result, Brent crude rose 0.8% to $60.96 a barrel, and US crude increased by the same percentage to $56.99 a barrel.

          Economic Calendar and Final Thoughts

          It is a quiet day on the calendar for European data releases but there are a few ECB policymakers who will be speaking during the session.

          The US session is equally quiet from a data perspective with Canadian PPI the only major data release during the session. Markets may focus on rising geopolitical risk as the US ramps up pressure on Venezuela.

          For all market-moving economic releases and events, see the MarketPulse Economic Calendar. (click to enlarge)

          Chart of the Day – FTSE 100

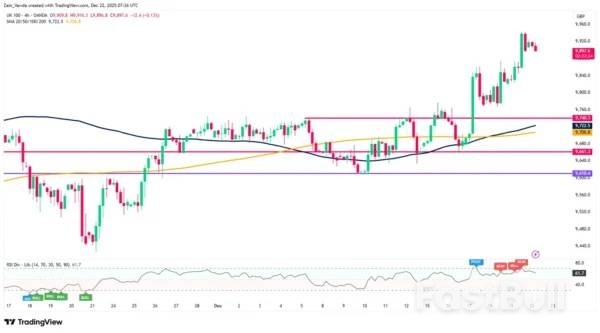
          From a technical standpoint, the FTSE 100 index is eyeing a pullback this morning.

          However, given the mood around global equity futures in the Asian session, i wonder whether such a move will prove sustainable?

          The index is approaching support at the 9850-9860 area with a break below opening up a deeper correction toward the 9800 and 9760 support areas.

          The period-14 RSI does remain comfortably above the 50 neutral level which hints at bullish momentum remaining strong at the present time.

          FTSE 100 Index Daily Chart, December 22. 2025

          Source: TradingView.com (click to enlarge)

          Source: MarketPulse by OANDA Group

          Risk Warnings and Disclaimers
          You understand and acknowledge that there is a high degree of risk involved in trading. Following any strategies or investment methods may lead to potential losses. The content on the site is provided by our contributors and analysts for information purposes only. You are solely responsible for determining whether any trading assets, securities, strategy, or any other product is suitable for investing based on your own investment objectives and financial situation.
          Add to Favorites
          Share

          India And New Zealand Announce Trade Pact Making Majority Of Goods Trade Duty Free

          Daniel Carter

          Economic

          Prime Minister Narendra Modi meets Prime Minister of New Zealand Christopher Luxon at Hyderabad House in New Delhi on March 17, 2025.

          The trade pact, which will be reviewed after one year, will be signed in the first half of next year.
          "This historic agreement eliminates and reduces tariffs on 95% of New Zealand's exports," New Zealand Trade and Investment Minister Todd McClay said in a statement, adding that nearly 57% of exports from the country will become duty-free in India "from day one."
          The pacific island nation will also invest $20 billion in India over next 15 years and allow mobility of professionals, skilled labor and students from India to New Zealand, according to a statement from India.
          India has also secured a "zero duty market" on all its exports to New Zealand that includes textiles, apparel, leather, footwear, marine products, gems and jewelry, handicrafts, engineering goods and automobiles.
          "Today this Free Trade Agreement is about building trade around people and launching opportunities," India's Commerce Minister Piyush Goyal said.
          The deal will give Indian businesses and youth an opportunity to "learn, work and grow on a global stage," he added.
          India will eliminate tariff on sheep meat, wool, coal and nearly all of forestry and wood exports. New Delhi will also allow duty-free access for dairy and other food ingredients for re-exports.
          However, to ensure protection to farmers and the domestic industry, New Delhi has said the market access excludes dairy, coffee, milk, cream, cheese, yoghurts, whey, caseins, onions, sugar, spices, edible oils, rubber.
          India's trade pact with New Zealand "provides policy certainty and lowers input costs for manufacturing, creating a vision for long-term economic resilience," said Ranjeet Mehta, chief executive officer and secretary general, of Indian industry body PHDCCI.
          Bilateral merchandise trade between the two countries stood at $1.3 billion in 2024–25 while total trade in goods and services was $2.4 billion in 2024. "The FTA provides a stable and predictable framework to unlock the full potential of this relationship," India's commerce ministry said.
          The FTA marks India's third deal this year following a free trade agreement with the UK in July and another pact with Oman earlier this month.
          The deals comes at a time when the U.S., New Delhi's largest trading partner, has levied 50% tariffs on its goods exports, that includes 25% duties for India's purchases of Russian oil.
          India, which has ambitions to become an export powerhouse, has been looking to diversify its exports to make up for the impact of U.S. tariffs.

          Source: CNBC

          To stay updated on all economic events of today, please check out our Economic calendar
          Risk Warnings and Disclaimers
          You understand and acknowledge that there is a high degree of risk involved in trading. Following any strategies or investment methods may lead to potential losses. The content on the site is provided by our contributors and analysts for information purposes only. You are solely responsible for determining whether any trading assets, securities, strategy, or any other product is suitable for investing based on your own investment objectives and financial situation.
          Add to Favorites
          Share

          The Fed Pushes Gold Higher: XAUUSD Updates Its All-time High

          Winkelmann

          Forex

          Commodity

          The Fed's interest rate cut continues to support gold. XAUUSD has updated its all-time high and is trading near the 4,395 USD level.

          XAUUSD forecast: key takeaways

          · XAUUSD price has updated its historical maximum
          · Current trend: moving upwards
          · XAUUSD forecast for 22 December 2025: 4,450 or 4,340

          Fundamental analysis

          The forecast for XAUUSD today indicates that gold prices continue to follow an upward trend. At this stage, quotes have updated their all-time high and are trading around 4,395 USD per ounce.

          Factors driving XAUUSD higher:

          · Gold prices rose following the Fed's interest rate cut. Expectations of further rate reductions by the US Federal Reserve are strengthening, and against this backdrop the USD continues to lose ground
          · Pressure on the US dollar further supports gold, making it more attractive for foreign buyers and reinforcing its value as a safe-haven asset
          · Amid market uncertainty and ongoing geopolitical risks, precious metals are becoming increasingly attractive to investors
          · Central banks continue to build up gold reserves, while expectations of monetary easing by the Fed and sustained structural demand create a solid foundation for potentially persistently high gold prices in 2026

          The upside potential for XAUUSD remains high. Weak US economic indicators continue to weigh on the USD and support higher gold prices.

          XAUUSD technical analysis

          On the H4 chart, XAUUSD formed a Hammer reversal pattern near the middle Bollinger Band. At this stage, the price continues its upward wave as part of the pattern's realization. Given that XAUUSD quotes remain within an ascending channel, the next upside target may be the 4,450 USD level.

          At the same time, today's technical analysis of XAUUSD also considers an alternative scenario, which includes a corrective pullback toward the 4,340 USD level before renewed growth.

          The possibility of further upside remains in place, and in the near term XAUUSD prices may move toward the next psychological level at 4,500 USD.

          Summary

          The XAUUSD forecast for December 22, 2025 is fully bullish for gold. Technical analysis suggests further price growth toward the 4,450 USD level.

          EURUSD 2026-2027 forecast: key market trends and future predictions

          This article provides the EURUSD forecast for 2026 and 2027 and highlights the main factors determining the direction of the pair's movements. We will apply technical analysis, take into account the opinions of leading experts, large banks, and financial institutions, and study AI-based forecasts. This comprehensive insight into EURUSD predictions should help investors and traders make informed decisions.

          Gold (XAUUSD) forecast 2026 and beyond: expert insights, price predictions, and analysis

          Dive deep into the Gold (XAUUSD) price outlook for 2026 and beyond, combining technical analysis, expert forecasts, and key macroeconomic factors. It explains the drivers behind gold's recent surge, explores potential scenarios including a move toward 4,500 to 5,000 USD per ounce, and highlights why the metal remains a strong hedge during global uncertainty.

          Source: RoboForex

          Risk Warnings and Disclaimers
          You understand and acknowledge that there is a high degree of risk involved in trading. Following any strategies or investment methods may lead to potential losses. The content on the site is provided by our contributors and analysts for information purposes only. You are solely responsible for determining whether any trading assets, securities, strategy, or any other product is suitable for investing based on your own investment objectives and financial situation.
          Add to Favorites
          Share

          Moore Threads Takes Aim At Nvidia’s H200

          Swissquote

          Political

          Stocks

          Friday's rally in technology stocks came as a much-needed relief for global financial markets and was sparked by a single, straightforward piece of news: Oracle will host TikTok's US user data under a new US–China arrangement that allows the app to continue operating in the United States. The deal is yet to be approved.

          But if it does, under the deal, Oracle will store and secure US user data on its cloud infrastructure and help oversee cybersecurity and algorithm-safety measures. It is a big responsibility given that roughly half of the US population uses TikTok. In return, Oracle is expected to take a meaningful equity stake of around 15% in the newly structured US TikTok business, while the broader investor consortium secures majority control. But above all, Oracle gains – with this deal – a strategic foothold in a high-growth digital platform via its cloud services — and that's a golden narrative for its growth profile.

          Oracle shares rebounded more than 6% on Friday, after having fallen over 45% from their September peak. The rally spread across the broader AI and tech complex, as investors reassessed the monetisation potential of data-centre infrastructure and computing power. Nvidia rose nearly 4%, while the Nasdaq gained 1.3%, reclaiming its 50-day moving average.

          That said, the pressure on tech stocks is unlikely to be over. First, the TikTok deal remains modest relative to the scale of Oracle's business, its heavy debt load and ongoing investment needs. On its own, it is unlikely to reverse the recent deterioration in appetite for leveraged debt, nor does it fully answer the question of how revenues will grow fast enough to justify rising leverage and capital spending.

          Second, developments in China highlight how quickly competitive dynamics can shift. Chinese chipmaker Moore Threads, founded by a former Nvidia executive and recently listed, announced plans to release new AI chips aimed at competing with Nvidia's Hopper-generation products. The company claims its upcoming chips rival Nvidia's H20 and H200, and narrow the gap with the Nvidia's next-generation Blackwell platform. This is an important development in the context of the US–China chip war.

          Only weeks ago, Nvidia received approval to resume sales of its H200 chips to China, at a time when those chips were widely seen as being well ahead of domestic Chinese alternatives. Moore Threads now says it could begin producing these chips as early as next year and claims energy-efficiency gains of up to 10× versus its own previous GPU generation. If realised, this would reduce Chinese buyers' dependence on Nvidia hardware — particularly as Beijing weighs how much to encourage domestic alternatives. The closer Chinese chips move toward US peers in performance and efficiency, the stronger the incentive for state support.

          Still, several red flags remain. First, designing advanced chips is one challenge; manufacturing them at scale is another. Moore Threads cannot go to TSMC after being placed on the US Entity List in 2023, meaning it must turn to domestic foundries. SMIC, China's leading chip manufacturer, has the capability to produce such chips using the country's most advanced available processes, but those technologies remain one to two generations behind TSMC, implying potential limits on performance, yields and efficiency. Second, much of the AI ecosystem is built around Nvidia's software stack, and switching to Moore Threads' platform would involve transition costs, integration challenges and reliability risks that are yet to be fully tested.

          Nevertheless, if Beijing decides this is the strategic path forward, Chinese companies may ultimately have little choice but to adapt. On Monday, Moore Threads shares rose 1.9% in Shanghai, while SMIC gained more than 6% in Hong Kong.

          The broader message is clear: China has not said its last word in the global tech race.

          Elsewhere in Asia, tech-heavy indices started the week higher. South Korea's Kospi gained more than 2%, while Japan's Nikkei initially advanced before giving back gains amid a sharp sell-off in Japanese government bonds that briefly pushed the 10-year yield to 2.10%. The USDJPY retreated as Japanese officials warned that positioning against the yen remains heavy and one-sided, reviving the risk of intervention — even if such action would not necessarily reverse the broader trend.

          The yen's strength weighed on the US dollar, while gold surged to a fresh all-time high above $4'400 per ounce, supported by rising geopolitical tensions involving the US and Venezuela. Oil prices also moved higher, with WTI crude above $57pb and Brent clearing $60pb, though the move may prove short-lived.

          Looking ahead, the week will be shortened by the Christmas holiday in Western markets. Before liquidity fades, the US will release its latest GDP update, expected to confirm 3.2% growth in Q3, alongside signs that price pressures may have firmed.

          After that, markets are likely to slow as investors head into year-end mode.

          Source: Swissquote Bank SA

          Risk Warnings and Disclaimers
          You understand and acknowledge that there is a high degree of risk involved in trading. Following any strategies or investment methods may lead to potential losses. The content on the site is provided by our contributors and analysts for information purposes only. You are solely responsible for determining whether any trading assets, securities, strategy, or any other product is suitable for investing based on your own investment objectives and financial situation.
          Add to Favorites
          Share

          Vietnam’s Agricultural Exports Hit Record $70 Billion in 2025 Amid Quality-Led Growth Shift

          Gerik

          Economic

          Value-Driven Transformation Powers Export Record

          Vietnam’s agricultural sector closed 2025 on a high note, with total exports projected to reach nearly $70 billion far surpassing the government’s $65 billion target. This record marks not only quantitative success but also a qualitative shift in strategy. Deputy Minister of Agriculture and Environment Phùng Đức Tiến noted that in the first 11 months alone, export turnover hit $64.01 billion. If December performs on par with recent months, the final figure will cement a new historic high.
          This surge underscores a broader transformation: key industries are moving away from traditional volume-based growth toward value-added development. The results are evident across core export categories such as coffee, fruits, seafood, and timber products, where a mix of technological innovation, international compliance, and market expansion strategies have reshaped Vietnam’s agricultural export profile.

          Coffee Leads with High Value Despite Stable Volume

          Coffee was the standout performer of 2025. For the first time, Vietnam’s coffee export value exceeded $8 billion, despite a stable output of approximately 1.5 million tonnes. The average export price rose by around 40% year-on-year, highlighting a clear shift toward value enhancement rather than volume scaling. This indicates a causal relationship between quality improvements and revenue expansion, as global buyers responded positively to premium-grade offerings and processed coffee products.
          Robusta continues to be the backbone of Vietnam’s coffee trade due to its scale and reliability, while processed coffee exports saw rapid growth, validating national efforts to deepen participation in the global value chain. In major growing regions like Đắk Lắk, Gia Lai, Lâm Đồng, and Quảng Ngãi, smart farming practices and digital traceability systems are helping producers meet increasingly rigorous international standards.

          Seafood Sector Capitalizes on Trade Timing and Regulatory Readiness

          Vietnam’s seafood industry also reached new heights, with 2025 exports expected to total between $11.2 and $11.3 billion, according to VASEP. November alone recorded nearly $990 million in shipments, up 6.6% year-on-year. Exporters took advantage of favorable trade windows, particularly ahead of stricter U.S. import regulations and ongoing anti-dumping litigation involving shrimp.
          Shrimp exports are forecast to break through the $4.6 billion mark, setting a new benchmark. Pangasius catfish exports are estimated at over $2.1 billion, buoyed by renewed demand from China and other Asian markets. Tuna exports are also nearing $1 billion. These achievements reflect the sector’s ability to align export timing with policy cycles and market readiness.
          However, 2026 poses new regulatory hurdles, particularly from the U.S., requiring transparency in supply chains, compliance with labor standards, and prevention of IUU (Illegal, Unreported, and Unregulated) fishing. This will force a shift from cost-based competition to value-based resilience.

          Fruit Exports Surpass Ambitious Goals Thanks to Durian Surge

          Vietnam’s fruit and vegetable exports far exceeded expectations in 2025. Initially targeting $5 billion in exports, the sector is now projected to reach $8.5 billion a nearly 20% year-on-year increase. Durian was the star performer, benefiting immensely from formalized trade routes into China. Although technical barriers from China and tariff pressures from the U.S. created headwinds early in the year, flexible policymaking and enterprise-level adaptability helped reverse the trend.
          Vietnam’s success in fruit exports is also tied to market access breakthroughs. Five new protocols were signed with China, enabling official exports of passion fruit, fresh jackfruit, and others. Additionally, fresh pomelo gained entry into the Australian market. According to Vinafruit, these developments not only generated immediate revenue but also compelled farmers to embrace food safety, traceability, and quality compliance.

          Timber Industry Lays Foundation for $25 Billion Goal

          Forestry products continued to form a critical pillar of the export economy. While the 2025 performance was not quantified in the same granular detail, the sector’s long-term strategy remains clear: to reach $25 billion in exports by 2030. To achieve this, stakeholders are focusing on three main pillars: a tightly integrated supply ecosystem, national branding for Vietnamese wood products, and diversified export markets.
          According to the Vietnam Timber and Forest Products Association, building a resilient and green supply chain will require investment in technology, sustainability practices, and workforce development. The sector is also moving toward greater brand identity through a model built on four strategic themes: sustainability, quality, adaptability, and competitiveness.

          Policy Support and Global Integration Drive Momentum

          The 2025 export record is closely tied to proactive policy execution. Authorities have promoted market access, expanded trade diplomacy, and facilitated technical upgrades across sectors. These include tax and tariff management, environmental compliance, and digital innovation for monitoring and certification.
          Looking ahead to 2026, the Ministry of Agriculture and Environment aims to consolidate gains through improved domestic market development and external market diversification. Plans include new scientific research, updated regulatory frameworks, and increased financial and technical support for businesses entering high-demand export segments.
          Vietnam’s agri-forestry-fishery exports in 2025 reflect not only a numerical milestone but a deeper transition toward a value-oriented, innovation-driven economy. The rise in export revenue achieved amid global volatility demonstrates Vietnam’s increasing competitiveness in premium markets and its ability to adapt to stricter international standards. However, sustaining this trajectory will require continued investment in quality, compliance, and resilience as global expectations evolve.
          To stay updated on all economic events of today, please check out our Economic calendar
          Risk Warnings and Disclaimers
          You understand and acknowledge that there is a high degree of risk involved in trading. Following any strategies or investment methods may lead to potential losses. The content on the site is provided by our contributors and analysts for information purposes only. You are solely responsible for determining whether any trading assets, securities, strategy, or any other product is suitable for investing based on your own investment objectives and financial situation.
          Add to Favorites
          Share

          Russia LNG Exports To China Rise To Record, Surpassing Australia

          Daniel Carter

          Economic

          Commodity

          Russia's liquefied natural gas exports to China surged to a record in November, as buyers shrugged off the risk of western sanctions to access the cheaper fuel.
          Deliveries of the super-chilled gas from Russia more than doubled from a year earlier to 1.6 million metric tons last month, customs data released over the weekend showed. The jump saw Russia overtake Australia to become China's biggest supplier after Qatar.
          Russia has turned to Asia's biggest gas market to offset declining shipments to Europe, which was Moscow's biggest buyer for decades until the invasion of Ukraine. It has had to cut prices to increase its appeal — its LNG was the cheapest among the 12 suppliers to China and about 10% below the average at $9.85 a million British thermal units in November, the customs data showed.
          Total imports had an annual increase for the first time in more than a year, after weak demand tempered requirements.
          China in August started importing shipments from Russa's sanctioned Arctic LNG 2 plant through its remote Beihai terminal. Nevertheless, the Russian facility has had to cut output as winter ice complicates exports.
          China hasn't imported US LNG since February, partly because of trade conflicts and weak demand. Major domestic companies are also increasingly diversifying their sources, while trying to sell contracted volumes on global markets, which is easier for American contracts that don't tend to have destination clauses.

          Source: Bloomberg Europe

          To stay updated on all economic events of today, please check out our Economic calendar
          Risk Warnings and Disclaimers
          You understand and acknowledge that there is a high degree of risk involved in trading. Following any strategies or investment methods may lead to potential losses. The content on the site is provided by our contributors and analysts for information purposes only. You are solely responsible for determining whether any trading assets, securities, strategy, or any other product is suitable for investing based on your own investment objectives and financial situation.
          Add to Favorites
          Share

          Coffee Market Sees Modest Recovery as Domestic Prices Rebound by 1,000 VND/kg

          Gerik

          Economic

          Commodity

          Price Stabilization Amid Strategic Buying

          Coffee prices across Vietnam’s Central Highlands showed a modest rebound on December 22, rising by 1,000 VND/kg compared to the previous day. Current market levels range between 89,500 and 90,500 VND/kg, signaling a mild recovery after prices plunged from above 100,000 VND/kg to below 90,000 VND/kg in recent weeks.
          At the provincial level, Đắk Lắk recorded coffee purchase prices around 90,300 VND/kg, while Đắk Nông and Lâm Đồng saw prices at 89,500 VND/kg. Gia Lai and parts of Đắk Nông reported the highest figures, between 90,000 and 90,500 VND/kg. The upward movement has been attributed to renewed interest from speculators and exporters, who are beginning to replenish stocks for contracts slated for early 2026. This anticipatory demand is a direct cause of the short-term price increase.

          Supply Discipline Among Farmers Boosts Market Sentiment

          A key supporting factor behind the price recovery is the strategic behavior of Vietnamese farmers during the final stages of the harvest. Instead of selling aggressively, many are holding back supplies, either in anticipation of higher prices or releasing only partial volumes to meet immediate Tet holiday expenses. This withholding of supply has helped limit downward pressure and introduces an element of scarcity in the short term.
          Although harvest volumes are high with projections suggesting a 6–10% year-over-year increase, reaching approximately 1.76 million metric tons farm-level sales discipline has delayed the full impact of the supply surge. This behavioral trend, rather than an actual shortage, is exerting influence on market pricing. The relationship here is not causal but correlational, as the expectation of restrained selling temporarily tightens available supply.

          Global Supply Outlook and Regulatory Headwinds Create a Tug-of-War

          The coffee market remains caught in a tense equilibrium between bearish and bullish forces. On the bearish side, the harvest season in Vietnam is peaking with solid output forecasts, and weather conditions in Brazil the world’s largest producer have improved significantly, increasing the likelihood of a bumper 2026 crop. These developments suggest potential oversupply in the coming months, which would ordinarily pressure prices further.
          On the other hand, ongoing geopolitical risks, such as tensions in the Red Sea region, continue to drive up global logistics costs. New regulatory compliance pressures from the European Union, particularly the EUDR (Deforestation Regulation), though currently postponed, are still increasing the administrative and operational burdens for exporters. These factors are contributing to elevated input costs, which in turn provide a cushion for coffee prices. These cost-related influences exhibit a direct causal impact on price floors, even in the face of improving harvest prospects.
          Additionally, global coffee stockpiles are at their lowest in five years, according to the USDA. This historically low inventory level has created a critical support zone in international pricing, preventing a freefall in prices despite broader supply concerns. The relative weakness of the US dollar has also made USD-denominated commodities like coffee more attractive to investors, further bolstering the price recovery.

          Exporters Urged to Stay Realistic Despite Price Lift

          Analysts advise that while the current rebound to around 90,000 VND/kg offers decent profit margins especially when compared to previous years farmers and traders should not overestimate the possibility of a return to the recent highs above 120,000 VND/kg. As global supply chains normalize and exports pick up pace, especially in Brazil and Southeast Asia, prices could face renewed downward pressure in the months ahead.
          From a risk management perspective, partial profit-taking is recommended. Locking in gains progressively helps mitigate exposure to sudden market corrections driven by global supply news or macroeconomic developments such as currency fluctuations and interest rate shifts.

          International Market Shows Mixed Signals

          On the London exchange, Robusta futures presented a mixed picture. The January 2026 contract rose by $4 per ton to $3,778, while the May 2026 contract declined by $5 to $3,613. This divergence suggests uncertainty over short-term demand versus longer-term supply confidence.
          Meanwhile, New York’s Arabica futures showed broader weakness. The March 2025 contract dropped by 4.45 cents/lb to 340.65 cents, while the December 2026 contract fell 1.7 cents to 303.6 cents/lb. However, further down the curve, the March 2026 Arabica contract plummeted 8.25 cents to 406.5 cents/lb, while May 2026 rebounded slightly to 410.05 cents/lb an indication of repositioning amid long-term market recalibration.
          The Vietnamese coffee market is showing signs of a fragile recovery, supported by strategic buying, cautious selling by farmers, and underlying global supply concerns. However, structural pressures from strong harvests in both Vietnam and Brazil, coupled with external regulatory and logistical disruptions, create a highly volatile backdrop. Stakeholders are encouraged to manage expectations and remain vigilant, as the market may continue to fluctuate sharply depending on both domestic behavior and international developments.
          To stay updated on all economic events of today, please check out our Economic calendar
          Risk Warnings and Disclaimers
          You understand and acknowledge that there is a high degree of risk involved in trading. Following any strategies or investment methods may lead to potential losses. The content on the site is provided by our contributors and analysts for information purposes only. You are solely responsible for determining whether any trading assets, securities, strategy, or any other product is suitable for investing based on your own investment objectives and financial situation.
          Add to Favorites
          Share
          FastBull
          Copyright © 2025 FastBull Ltd

          728 RM B 7/F GEE LOK IND BLDG NO 34 HUNG TO RD KWUN TONG KLN HONG KONG

          TelegramInstagramTwitterfacebooklinkedin
          App Store Google Play Google Play
          Products
          Charts

          Chats

          Q&A with Experts
          Screeners
          Economic Calendar
          Data
          Tools
          Membership
          Features
          Function
          Markets
          Copy Trading
          Latest Signals
          Contests
          News
          Analysis
          24/7
          Columns
          Education
          Company
          Careers
          About Us
          Contact Us
          Advertising
          Help Center
          Feedback
          User Agreement
          Privacy Policy
          Personal Information Protection Statement
          Business

          White Label

          Data API

          Web Plug-ins

          Poster Maker

          Affiliate Program

          Risk Disclosure

          The risk of loss in trading financial instruments such as stocks, FX, commodities, futures, bonds, ETFs and crypto can be substantial. You may sustain a total loss of the funds that you deposit with your broker. Therefore, you should carefully consider whether such trading is suitable for you in light of your circumstances and financial resources.

          No decision to invest should be made without thoroughly conducting due diligence by yourself or consulting with your financial advisors. Our web content might not suit you since we don't know your financial conditions and investment needs. Our financial information might have latency or contain inaccuracy, so you should be fully responsible for any of your trading and investment decisions. The company will not be responsible for your capital loss.

          Without getting permission from the website, you are not allowed to copy the website's graphics, texts, or trademarks. Intellectual property rights in the content or data incorporated into this website belong to its providers and exchange merchants.

          Not Logged In

          Log in to access more features

          FastBull Membership

          Not yet

          Purchase

          Become a signal provider
          Help Center
          Customer Service
          Dark Mode
          Price Up/Down Colors

          Log In

          Sign Up

          Position
          Layout
          Fullscreen
          Default to Chart
          The chart page opens by default when you visit fastbull.com