Markets
Analysis
User
24/7
Economic Calendar
Education
Data
- Names
- Latest
- Prev


Signal Accounts for Members
All Signal Accounts
All Contests


The Styrene (EB) Futures Contract Fell 603.00 Yuan During The Day, Currently Trading At 10,038.00 Yuan/ton, A Decrease Of 5.67%. The Paraxylene (PX) Futures Contract Fell 4.00% During The Day, Currently Trading At 9,392 Yuan/ton
The Main Contract For The Container Shipping Index (European Route) Fell 302.7 Points During The Day, Currently Trading At 2122.0 Points, A Drop Of 12.48%
The Styrene (EB) Futures Contract Fell Below 10,300 Yuan/ton, Down 3.24% On The Day. The Glass Futures Contract Fell 2.00% On The Day, Currently Trading At 1,004.00 Yuan/ton
A Senior Israeli General Stated That There Are Virtually No Restrictions On Operations In Iranian Airspace
A Senior Israeli General Stated That Iran's Missile Launch Capability Has Been Weakened. Much Of Iran's Command Chain Has Been Destroyed. The Military Operation In Lebanon Will Continue As Needed
The Main Contract Of The SSE 50 Index Futures (IH) Rose By 2.00% During The Day, And Is Currently Trading At 2865.2 Points
The Most Active Japanese Rubber Futures Contract Rose More Than 2.00% Intraday, Currently Trading At 384.50 Yen Per Kilogram
A-share Computing Hardware Concept Stocks Strengthened In The Afternoon, With Zhilifang Hitting The 20cm Daily Limit, Yongding Shares And Tianfu Communication Both Rising By More Than 9%, And Changguang Huaxin, Dekeli And Yuanjie Technology Following Suit
The CSI 500 Index Futures (IC) Main Contract Broke Through 7600 Points, Rising 2.19% On The Day
The Main Hog Futures Contract Fell 2.00% During The Day, Currently Trading At 9695.00 Yuan/ton
According To The Jerusalem Post: On Wednesday Morning Local Time, Cluster Munitions Fired By Iran Injured Several People In Central Israel
The SSE 50 Index Rose By More Than 2%, With Cambricon Leading The Gains Among Its Constituent Stocks, Rising By More Than 7%
India's Ministry Of Petroleum: Commercial Gas Cylinder Prices Have Been Raised As Saudi Contract Prices Surged 44% From $542 Per Ton In March To $780 Per Ton In April

U.S. S&P/CS 20-City Home Price Index MoM (Not SA) (Jan)A:--
F: --
P: --
U.S. FHFA House Price Index (Jan)A:--
F: --
P: --
U.S. Chicago PMI (Mar)A:--
F: --
P: --
U.S. JOLTS Job Openings (SA) (Feb)A:--
F: --
U.S. Conference Board Consumer Expectations Index (Mar)A:--
F: --
P: --
U.S. Conference Board Present Situation Index (Mar)A:--
F: --
P: --
U.S. Conference Board Consumer Confidence Index (Mar)A:--
F: --
Brazil CAGED Net Payroll Jobs (Feb)A:--
F: --
P: --
U.S. API Weekly Refined Oil StocksA:--
F: --
P: --
U.S. API Weekly Gasoline StocksA:--
F: --
P: --
U.S. API Weekly Cushing Crude Oil StocksA:--
F: --
P: --
U.S. API Weekly Crude Oil StocksA:--
F: --
P: --
Japan Tankan Small Manufacturing Outlook Index (Q1)A:--
F: --
P: --
Japan Tankan Large-Enterprise Capital Expenditure YoY (Q1)A:--
F: --
P: --
Japan Tankan Large Non-Manufacturing Outlook Index (Q1)A:--
F: --
P: --
Japan Tankan Large Manufacturing Outlook Index (Q1)A:--
F: --
P: --
Japan Tankan Large Non-Manufacturing Diffusion Index (Q1)A:--
F: --
P: --
Japan Tankan Small Manufacturing Diffusion Index (Q1)A:--
F: --
P: --
Japan Tankan Large Manufacturing Diffusion Index (Q1)A:--
F: --
P: --
South Korea Trade Balance Prelim (Mar)A:--
F: --
South Korea IHS Markit Manufacturing PMI (SA) (Mar)A:--
F: --
P: --
Australia Building Permits YoY (SA) (Feb)A:--
F: --
P: --
Australia Building Permits MoM (SA) (Feb)A:--
F: --
P: --
Australia Private Building Permits MoM (SA) (Feb)A:--
F: --
P: --
Indonesia IHS Markit Manufacturing PMI (Mar)A:--
F: --
P: --
China, Mainland Caixin Manufacturing PMI (SA) (Mar)A:--
F: --
P: --
Indonesia Core Inflation YoY (Mar)A:--
F: --
P: --
Indonesia Inflation Rate YoY (Mar)A:--
F: --
P: --
Indonesia Trade Balance (Feb)A:--
F: --
P: --
Australia Commodity Price YoYA:--
F: --
P: --
Russia IHS Markit Manufacturing PMI (Mar)--
F: --
P: --
Turkey Manufacturing PMI (Mar)--
F: --
P: --
Italy Manufacturing PMI (SA) (Mar)--
F: --
P: --
Italy Unemployment Rate (SA) (Feb)--
F: --
P: --
South Africa Manufacturing PMI (Mar)--
F: --
P: --
Euro Zone Unemployment Rate (Feb)--
F: --
P: --
U.S. MBA Mortgage Application Activity Index WoW--
F: --
P: --
U.S. ADP Employment (Mar)--
F: --
P: --
U.S. Retail Sales YoY (Feb)--
F: --
P: --
U.S. Retail Sales MoM (Feb)--
F: --
P: --
U.S. Core Retail Sales MoM (Feb)--
F: --
P: --
U.S. Core Retail Sales (Feb)--
F: --
P: --
U.S. Retail Sales (Feb)--
F: --
P: --
Brazil IHS Markit Manufacturing PMI (Mar)--
F: --
P: --
Canada Manufacturing PMI (SA) (Mar)--
F: --
P: --
U.S. ISM Inventories Index (Mar)--
F: --
P: --
U.S. ISM Manufacturing Employment Index (Mar)--
F: --
P: --
U.S. Commercial Inventory MoM (Jan)--
F: --
P: --
U.S. ISM Output Index (Mar)--
F: --
P: --
U.S. ISM Manufacturing PMI (Mar)--
F: --
P: --
U.S. ISM Manufacturing New Orders Index (Mar)--
F: --
P: --
U.S. EIA Weekly Crude Stocks Change--
F: --
P: --
U.S. EIA Weekly Gasoline Stocks Change--
F: --
P: --
U.S. EIA Weekly Crude Oil Imports Changes--
F: --
P: --
U.S. EIA Weekly Crude Demand Projected by Production--
F: --
P: --
U.S. EIA Weekly Heating Oil Stock Changes--
F: --
P: --
U.S. EIA Weekly Cushing, Oklahoma Crude Oil Stocks Change--
F: --
P: --
Mexico Manufacturing PMI (Mar)--
F: --
P: --
Russia Retail Sales YoY (Feb)--
F: --
P: --
Russia Unemployment Rate (Feb)--
F: --
P: --


No matching data
Charts show that the euro strengthened against the Canadian dollar on Thursday, with the pair climbing above 1.6460 for the first time since spring 2009, when the world was still reeling from the global financial crisis.
The current weakness of the Canadian dollar is being influenced by several factors:
→ Trade relations with the United States – according to media reports, some Canadian industries such as steel and automotive manufacturing are facing competitive disadvantages under the current agreement.
→ Oil prices have fallen to a five-month low, partly due to expectations surrounding a potential meeting between the US and Russian presidents. As we noted on 13 October, the XTI/USD exchange rate could drift towards $55 per barrel.
Meanwhile, the euro has benefited from the softening of the US dollar. Notably, the DXY index has turned lower from a key resistance level — the upper boundary of the channel identified in our 9 October analysis.
However, an examination of the EUR/CAD chart suggests that the current upward momentum may be losing steam.

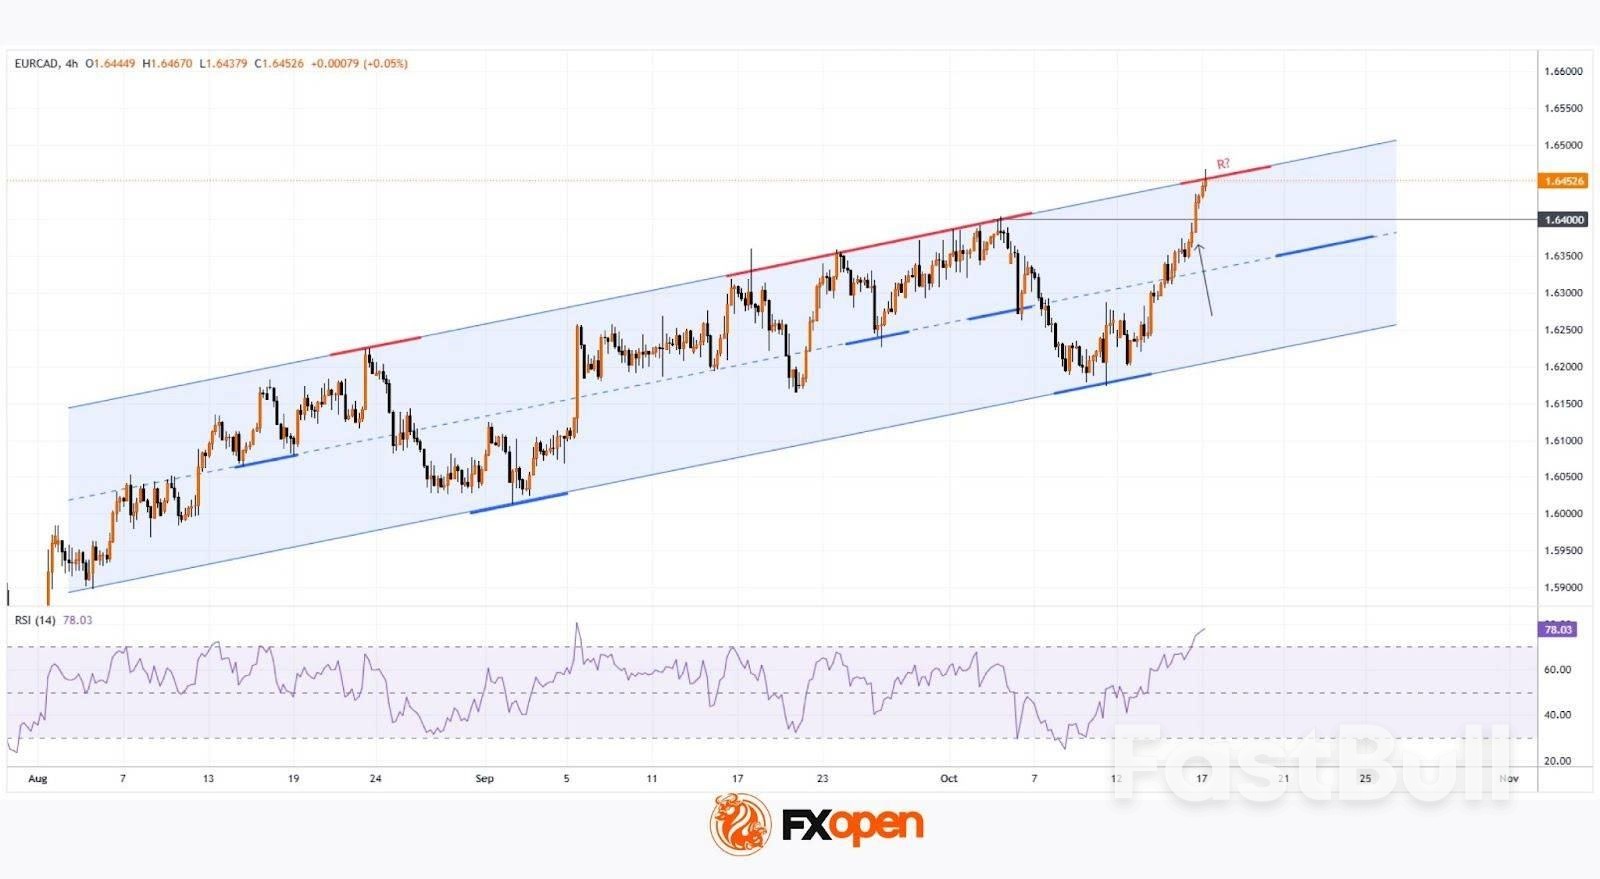
Price movements — with key turning points shown in bold — outline a rising channel that has remained relevant since August.
The bearish case rests on the following factors:→ The pair has reached the upper boundary of the channel, which has repeatedly acted as strong resistance and may do so again.→ The sharp mid-October rally pushed the RSI indicator into extreme overbought territory.
On the other hand, price action continues to reflect strong demand, as seen in the clean breakout above the previous peak near 1.6400, which occurred on a wide bullish candle with minimal pullback.
In these conditions, it is reasonable to assume that:→ After a 1.6% rise in seven days, some long holders may start taking profits, leading to consolidation near the upper boundary of the channel;→ If a correction from the upper channel line develops, it is likely to be shallow, as bullish activity could re-emerge around the median line, reinforced by the former resistance at 1.6400.
The risk of loss in trading financial instruments such as stocks, FX, commodities, futures, bonds, ETFs and crypto can be substantial. You may sustain a total loss of the funds that you deposit with your broker. Therefore, you should carefully consider whether such trading is suitable for you in light of your circumstances and financial resources.
No decision to invest should be made without thoroughly conducting due diligence by yourself or consulting with your financial advisors. Our web content might not suit you since we don't know your financial conditions and investment needs. Our financial information might have latency or contain inaccuracy, so you should be fully responsible for any of your trading and investment decisions. The company will not be responsible for your capital loss.
Without getting permission from the website, you are not allowed to copy the website's graphics, texts, or trademarks. Intellectual property rights in the content or data incorporated into this website belong to its providers and exchange merchants.
Not Logged In
Log in to access more features
Log In
Sign Up