• Trade
  • Markets
  • Copy
  • Contests
  • 24/7
  • Calendar
  • Q&A
  • Chats
Screeners
SYMBOL
LAST
BID
ASK
HIGH
LOW
NET CHG.
%CHG.
SPREAD
SOURCE
SPX
S&P 500 Index
7175.83
7175.83
7175.83
7415.64
7173.63
-147.80
-2.02%
--
--
DJI
Dow Jones Industrial Average
49097.06
49097.06
49097.06
50454.81
49091.92
-1101.11
-2.19%
--
--
IXIC
NASDAQ Composite Index
23879.21
23879.21
23879.21
24939.62
23870.70
-550.67
-2.25%
--
--
USDX
US Dollar Index
103.837
103.837
103.917
103.867
103.488
+0.155
+ 0.15%
--
--
EURUSD
Euro / US Dollar
1.09667
1.09667
1.09712
1.09672
1.09658
+0.00012
+ 0.01%
--
--
GBPUSD
Pound Sterling / US Dollar
1.30877
1.30877
1.30958
1.30887
1.30804
+0.00028
+ 0.02%
--
--
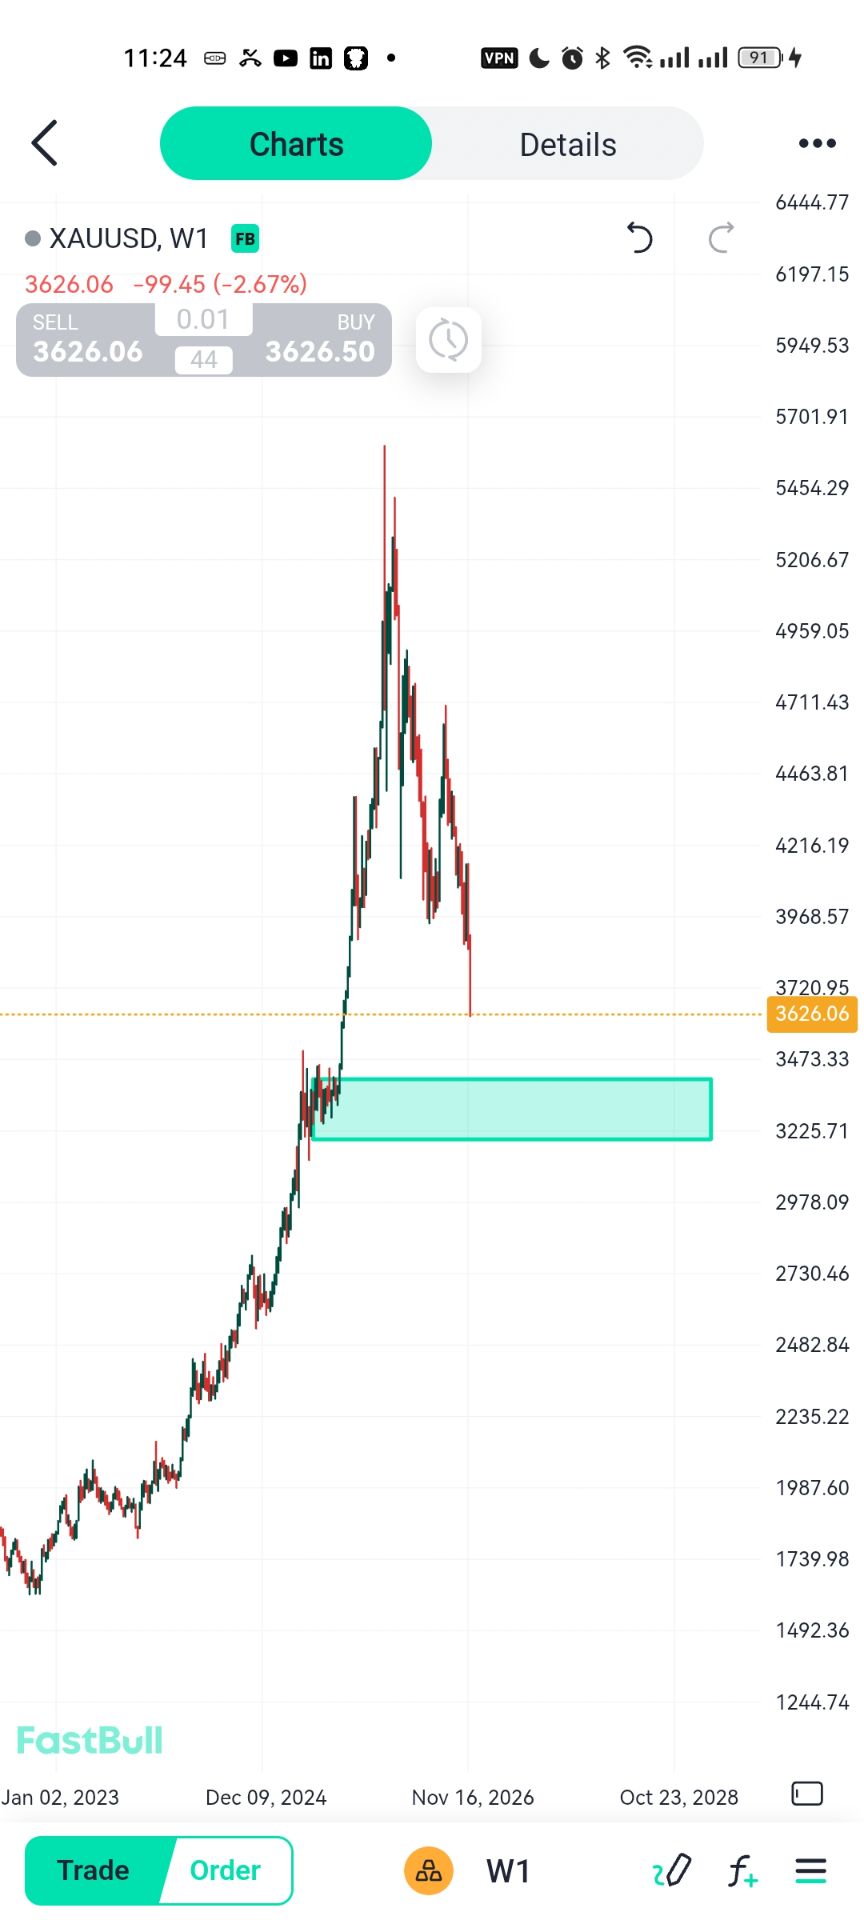
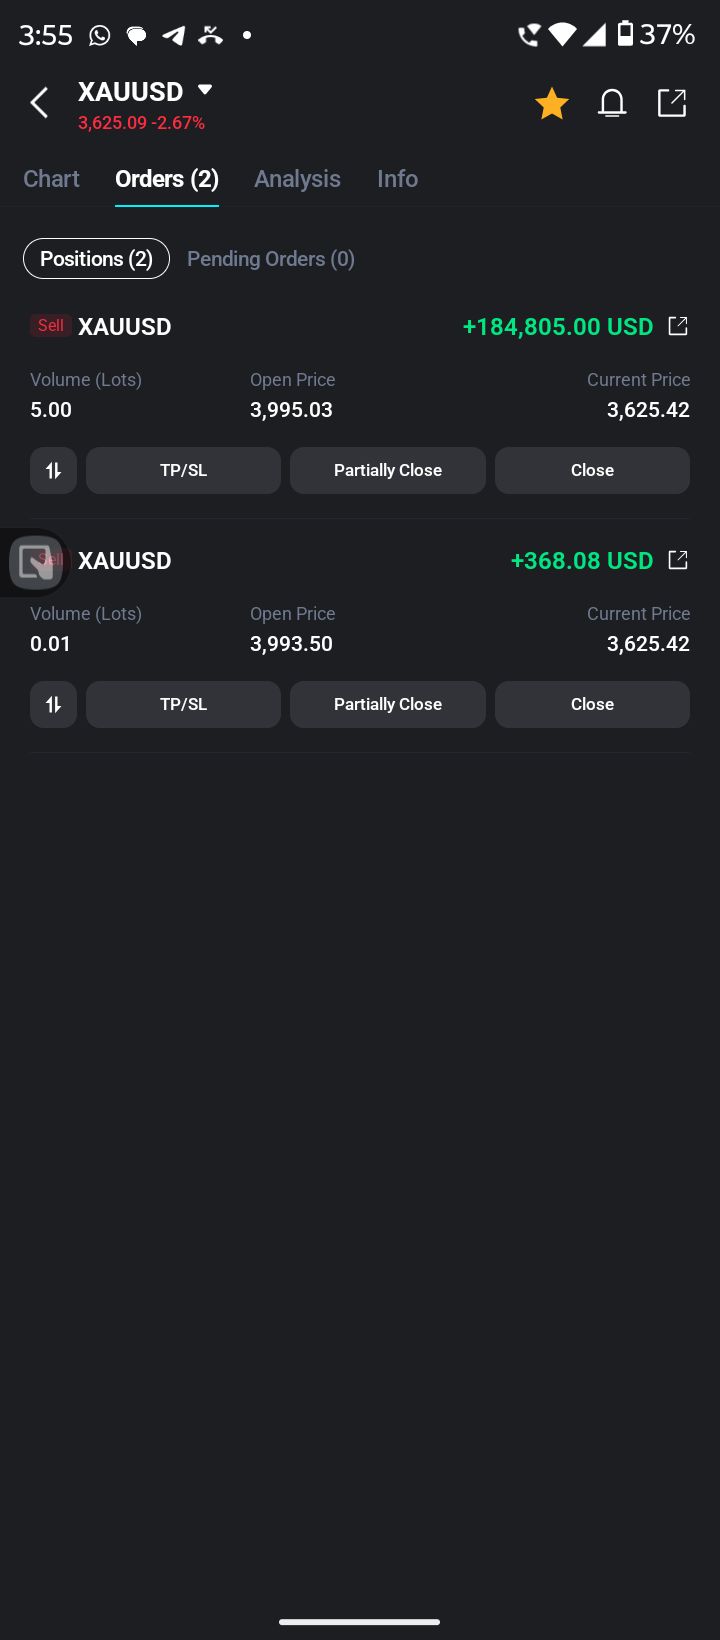
XAUUSD
Gold / US Dollar
3626.06
3626.06
3626.50
3758.44
3619.69
-99.45
-2.67%
--
--
WTI
Light Sweet Crude Oil
83.042
83.042
83.138
83.785
81.546
+1.273
+ 1.56%
--
--

Community Accounts

Signal Accounts
--
Profit Accounts
--
Loss Accounts
--
View More

Become a signal provider

Sell trading signals to earn additional income

View More

Guide to Copy Trading

Get started with ease and confidence

View More

Signal Accounts for Members

All Signal Accounts

Best Return
  • Best Return
  • Best P/L
  • Best MDD
Past 1W
  • Past 1W
  • Past 1M
  • Past 1Y

All Contests

  • All
  • Recommend
  • Stocks
  • Cryptocurrencies
  • Central Banks
  • Trump Updates
  • Featured News
Top News Only
Share

Canadian Trade Minister LeBlanc: We Expect The U.S. Tariffs On Automobiles And Steel To Remain Unchanged

Share

U.S. Energy Secretary Wright: The Bill Act Is A Landmark Move By President Trump In The Field Of Energy Investment

Share

MSCI Emerging Markets Equity Index Fell 1.3%, And The Developing Countries Currency Index Fell 0.06%

Share

Spot Silver Fell 5% On The Day, Currently Trading At $42.74 Per Ounce

Share

International Gold And Silver Prices Continued To Decline, With Spot Gold Falling Below $3,630, Down Nearly 3% In 24 Hours; Spot Silver Fell Below $43, Down Nearly 5% In 24 Hours

Share

New York Gold Futures Fell Below $3,630 Per Ounce, Down 2.99% On The Day

Share

New York Gold Futures Fell 3% On The Day, Currently Trading At $3,628.80 Per Ounce

Share

Spot Gold Fell Below $3,630 Per Ounce, Down 2.58% On The Day

Share

Spot Silver Fell Further To 4%, Currently Trading At $43.18 Per Ounce

Share

New York Gold Futures Fell Below $3,640 Per Ounce, Down 2.76% On The Day

Share

Spot Gold Fell Below $3,640 Per Ounce, Down 2.30% On The Day

Share

New York Gold Futures Fell Below $3,650 Per Ounce, Down 2.47% On The Day

Share

Spot Gold Fell Below $3,650 Per Ounce, Down 2.01% On The Day

Share

Spot Silver Fell More Than 3% To $43.63 Per Ounce, While Spot Gold Fell Nearly 2% To $3,652.4 Per Ounce

Share

New York Gold Futures Fell Below $3,660 Per Ounce, Down 2.19% On The Day

Share

Spot Gold Fell Below $3,660 Per Ounce, Down 1.74% On The Day

Share

BNP Paribas: Raised Its Forecast For The Fed's Interest Rate Hike Prospects, Now Believing That Monetary Policy Will Also Tighten In March, With 25 Basis Point Rate Hikes Implemented Successively In December, January, And March

Share

Bitcoin Fell To Its Lowest Point In Four Months, Currently Down 0.6% At $61,876.23

Share

A Spokesperson For The Iranian Foreign Ministry Stated That The US Accusations That Tehran Is Developing Chemical And Biological Weapons Are Intended To Create Panic And Provide A Justification For Military Action

Share

Chicago Federal Reserve President Goolsby: It Is Unclear What The Impact On The Financial Sector Would Be If There Were A Significant Pullback In AI-related Stocks

TIME
ACT
FCST
PREV
IMPACT
Euro Zone Current Account (Not SA) (Sept)

A:--

F: --

P: --

EURUSD
  • EURUSD
  • XAUUSD
  • XAGUSD
  • WTI
  • USDX
Euro Zone Current Account (SA) (Sept)

A:--

F: --

P: --

EURUSD
  • EURUSD
  • XAUUSD
  • XAGUSD
  • WTI
  • USDX
Euro Zone Labor Cost YoY (Q3)

A:--

F: --

P: --

EURUSD
  • EURUSD
  • XAUUSD
  • XAGUSD
  • WTI
  • USDX
Euro Zone Construction Output YoY (Sept)

A:--

F: --

P: --

EURUSD
  • EURUSD
  • XAUUSD
  • XAGUSD
  • WTI
  • USDX
Euro Zone Construction Output MoM (SA) (Sept)

A:--

F: --

P: --
EURUSD
  • EURUSD
  • XAUUSD
  • XAGUSD
  • WTI
  • USDX
U.K. CBI Industrial Prices Expectations (Nov)

A:--

F: --

P: --

GBPUSD
  • GBPUSD
  • XAUUSD
  • XAGUSD
  • WTI
  • USDX
U.K. CBI Industrial Trends - Orders (Nov)

A:--

F: --

P: --

GBPUSD
  • GBPUSD
  • XAUUSD
  • XAGUSD
  • WTI
  • USDX
South Africa Repo Rate

A:--

F: --

P: --

XAUUSD
  • XAUUSD
  • XAGUSD
  • WTI
  • USDX
Canada Industrial Product Price Index YoY (Oct)

A:--

F: --

P: --
USDCAD
  • USDCAD
  • XAUUSD
  • XAGUSD
  • WTI
  • USDX
U.S. Philadelphia Fed Business Activity Index (SA) (Nov)

A:--

F: --

P: --

USDX
  • USDX
  • XAUUSD
  • XAGUSD
  • WTI
Canada Industrial Product Price Index MoM (Oct)

A:--

F: --

P: --
USDCAD
  • USDCAD
  • XAUUSD
  • XAGUSD
  • WTI
  • USDX
U.S. Weekly Initial Jobless Claims (SA)

A:--

F: --

P: --
XAUUSD
  • XAUUSD
  • XAGUSD
  • WTI
  • USDX
U.S. Initial Jobless Claims 4-Week Avg. (SA)

A:--

F: --

P: --
XAUUSD
  • XAUUSD
  • XAGUSD
  • WTI
  • USDX
U.S. Weekly Continued Jobless Claims (SA)

A:--

F: --

P: --
XAUUSD
  • XAUUSD
  • XAGUSD
  • WTI
  • USDX
U.S. Philadelphia Fed Manufacturing Employment Index (Nov)

A:--

F: --

P: --

USDX
  • USDX
  • XAUUSD
  • XAGUSD
  • WTI
ECB President Lagarde Speaks
FOMC Member Hammack Speaks
U.S. Conference Board Leading Economic Index MoM (Oct)

A:--

F: --

P: --

USDX
  • USDX
  • XAUUSD
  • XAGUSD
  • WTI
U.S. Conference Board Lagging Economic Index MoM (Oct)

A:--

F: --

P: --

USDX
  • USDX
  • XAUUSD
  • XAGUSD
  • WTI
U.S. Conference Board Coincident Economic Index MoM (Oct)

A:--

F: --

P: --

USDX
  • USDX
  • XAUUSD
  • XAGUSD
  • WTI
U.S. Conference Board Leading Economic Index (Oct)

A:--

F: --

P: --

USDX
  • USDX
  • XAUUSD
  • XAGUSD
  • WTI
U.S. EIA Weekly Natural Gas Stocks Change

A:--

F: --

P: --

WTI
  • WTI
  • XAUUSD
  • XAGUSD
  • USDX
U.S. Kansas Fed Manufacturing Production Index (Nov)

A:--

F: --

P: --

USDX
  • USDX
  • XAUUSD
  • XAGUSD
  • WTI
U.S. Kansas Fed Manufacturing Composite Index (Nov)

A:--

F: --

P: --

USDX
  • USDX
  • XAUUSD
  • XAGUSD
  • WTI
U.S. 10-Year TIPS Auction Avg. Yield

A:--

F: --

P: --

XAUUSD
  • XAUUSD
  • XAGUSD
  • WTI
  • USDX
Argentina Trade Balance (Oct)

A:--

F: --

P: --

XAUUSD
  • XAUUSD
  • XAGUSD
  • WTI
  • USDX
Richmond Federal Reserve President Barkin delivered a speech.
South Korea PPI MoM (Oct)

A:--

F: --

P: --
XAUUSD
  • XAUUSD
  • XAGUSD
  • WTI
  • USDX
Richmond Federal Reserve President Barkin delivered a speech.
U.S. Weekly Treasuries Held by Foreign Central Banks

A:--

F: --

P: --

USDX
  • USDX
  • XAUUSD
  • XAGUSD
  • WTI
Japan National CPI MoM (Oct)

--

F: --

P: --

Japan National CPI MoM (Not SA) (Oct)

--

F: --

P: --

Japan National Core CPI YoY (Oct)

--

F: --

P: --

Japan National CPI YoY (Oct)

--

F: --

P: --

Philadelphia Fed President Henry Paulson delivers a speech
U.K. GfK Consumer Confidence Index (Nov)

--

F: --

P: --

China, Mainland 5-Year Loan Prime Rate

--

F: --

P: --

China, Mainland 1-Year Loan Prime Rate (LPR)

--

F: --

P: --

Turkey Capacity Utilization (Nov)

--

F: --

P: --

Turkey Consumer Confidence Index (Nov)

--

F: --

P: --

Germany PPI MoM (Oct)

--

F: --

P: --

Germany PPI YoY (Oct)

--

F: --

P: --

U.K. Core Retail Sales YoY (SA) (Oct)

--

F: --

P: --

U.K. Retail Sales MoM (SA) (Oct)

--

F: --

P: --

U.K. Retail Sales YoY (SA) (Oct)

--

F: --

P: --

ECB President Lagarde Speaks
India Industrial Production Index YoY (Oct)

--

F: --

P: --

Mexico Retail Sales MoM (Sept)

--

F: --

P: --

Canada Core Retail Sales MoM (SA) (Sept)

--

F: --

P: --

Canada Retail Sales MoM (SA) (Sept)

--

F: --

P: --

U.S. UMich Current Economic Conditions Index Final (Nov)

--

F: --

P: --

U.S. UMich 1-Year-Ahead Inflation Expectations Final (Nov)

--

F: --

P: --

U.S. UMich Consumer Expectations Index Final (Nov)

--

F: --

P: --

U.S. UMich Consumer Sentiment Index Final (Nov)

--

F: --

P: --

Euro Zone Consumer Confidence Index Prelim (Nov)

--

F: --

P: --

U.S. Weekly Total Oil Rig Count

--

F: --

P: --

U.S. Weekly Total Rig Count

--

F: --

P: --

Australia Composite PMI Prelim (Nov)

--

F: --

P: --

Australia Manufacturing PMI Prelim (Nov)

--

F: --

P: --

France Services PMI Prelim (SA) (Nov)

--

F: --

P: --

France Manufacturing PMI Prelim (Nov)

--

F: --

P: --

Q&A with Experts
    • All
    • Chatrooms
    • Groups
    • Friends
    Skylark flag
    EuroTrader flag
    Skylark flag
    Sanjeev Ku
    @Skylark no i took. you too took a screen shot of mine msg i remember haha. reason i know but bro i m not demo. i mean and owe what i say in group
    @Sanjeev Kuyea it's very true bro that's what is call transparency and its what will you in they make right
    Skylark flag
    Skylark flag
    Sanjeev Ku flag
    Skylark flag
    Skylark flag
    Sanjeev Ku flag
    now good tommorow better 🤣🤣q
    Skylark flag
    Sanjeev Ku
    now good tommorow better 🤣🤣q
    @Sanjeev Ku and after saying good night later you'll come back with another setup
    Sanjeev Ku flag
    Skylark
    @Sanjeev Kuyea it's very true bro that's what is call transparency and its what will you in they make right
    @Skylark first thing first i dont talk beyond my ability in group
    Skylark flag
    Sanjeev Ku
    now good tommorow better 🤣🤣q
    @Sanjeev Kuany Ways good night see you tomorrow I need rest now to be refresh for tomorrow
    Sanjeev Ku flag
    Skylark
    @Sanjeev Ku and after saying good night later you'll come back with another setup
    @Skylark now seems todays sleep gone with the wind. here wind being gold 🤣🤣🤣
    Sanjeev Ku flag
    Skylark
    @Sanjeev Kuany Ways good night see you tomorrow I need rest now to be refresh for tomorrow
    @Skylark👍
    Skylark flag
    Sanjeev Ku
    @Skylark first thing first i dont talk beyond my ability in group
    @Sanjeev Kuyes thats.always something most people lack always they boast too much
    Skylark flag
    Sanjeev Ku
    @Skylark now seems todays sleep gone with the wind. here wind being gold 🤣🤣🤣
    @Sanjeev Ku seriously bro it's already 23:30 on my end and I'm still awake doing shit
    Skylark flag
    Sanjeev Ku
    @Skylark now seems todays sleep gone with the wind. here wind being gold 🤣🤣🤣
    @Sanjeev Kusome who call them selves king of gold encounter much losses now and are quite for a short time
    Skylark flag
    Sanjeev Ku
    @Skylark now seems todays sleep gone with the wind. here wind being gold 🤣🤣🤣
    @Sanjeev Ku They'll definitely come back and make some noise once they get 1 profitable trade
    Sanjeev Ku flag
    EuroTrader
    @Sanjeev Kuare you still pushing it brother. There is some more sweet spot lower but we are being careful here you know
    @EuroTrader bro next session first 15 min will decide what to do cover short go long or to keep shorts open only first 15 min . my indicators will do the needfull in first 15 min as usual
    Matthew flag
    EuroTrader
    @Sanjeev Kuexsxtly, as long as your indicator keeps pushing you just gotta ride your profits. No stopping till msruds says so
    @EuroTraderi wish I listened to my heart to sell gold
    Type here...
    Add Symbol or Code

      No matching data

      All
      Recommend
      Stocks
      Cryptocurrencies
      Central Banks
      Trump Updates
      Featured News
      • All
      • Russia-Ukraine Conflict
      • Middle East Flashpoint
      • All
      • Russia-Ukraine Conflict
      • Middle East Flashpoint

      Search
      Products

      Charts Free Forever

      Chats Q&A with Experts
      Screeners Economic Calendar Data Tools
      Membership Features
      Data Warehouse Market Trends Institutional Data Policy Rates Macro

      Market Trends

      Market Sentiment Order Book Forex Correlations

      Top Indicators

      Charts Free Forever
      Markets

      News

      24/7 Analysis Education

      Latest Views

      Latest Update

      Signals

      Copy Rankings Latest Signals Become a signal provider AI Rating
      Contests
      Brokers

      Overview Brokers Assessment Rankings Regulators News Claims
      Broker listing Forex Brokers Comparison Tool Live Spread Comparison Scam
      Q&A Complaint Scam Alert Videos Tips to Detect Scam
      More

      Business
      Events
      Careers About Us Advertising Help Center

      White Label

      Broker API

      Data API

      Web Plug-ins

      Affiliate Program

      Awards Institution Evaluation IB Seminar Salon Event Exhibition
      Vietnam Thailand Singapore Dubai
      Fans Party Investment Sharing Session
      FastBull Summit BrokersView Expo
      Recent Searches
        Top Searches
          Markets
          Analysis
          User
          24/7
          Economic Calendar
          Education
          Data
          • Names
          • Latest
          • Prev

          View All

          No data

          Scan to Download

          Faster Charts, Chat Faster!

          Download
          English
          • English
          • Español
          • العربية
          • Bahasa Indonesia
          • Bahasa Melayu
          • Tiếng Việt
          • ภาษาไทย
          • Français
          • Italiano
          • Türkçe
          • Русский язык
          • 简中
          • 繁中
          Open Account
          Search
          Products
          Charts Free Forever
          Markets
          News
          Signals

          Copy Rankings Latest Signals Become a signal provider AI Rating
          Contests
          Brokers

          Overview Brokers Assessment Rankings Regulators News Claims
          Broker listing Forex Brokers Comparison Tool Live Spread Comparison Scam
          Q&A Complaint Scam Alert Videos Tips to Detect Scam
          More

          Business
          Events
          Careers About Us Advertising Help Center

          White Label

          Broker API

          Data API

          Web Plug-ins

          Affiliate Program

          Awards Institution Evaluation IB Seminar Salon Event Exhibition
          Vietnam Thailand Singapore Dubai
          Fans Party Investment Sharing Session
          FastBull Summit BrokersView Expo

          GBP Plunges over 60 Pips, Short-Term Rebound Expected

          Jason

          Forex

          Summary:

          What the September non-farm payrolls really altered may only be the timing of rate hikes, rather than the direction.

          BUY GBPUSD
          EXP
          EXPIRED

          1.31800

          Entry Price

          1.32800

          TP

          1.31300

          SL

          1.30877 +0.00028 +0.02%

          --

          Pips

          EXPIRED

          1.31300

          SL

          1.32200

          Exit Price

          1.31800

          Entry Price

          1.32800

          TP
          Fundamental Analysis

          Driven by last Friday's US September non-farm payrolls (NFP) report, GBP/USD opened significantly lower during the session, tumbling by nearly 600 fractional pips (60 pips). It has since edged up by 230 fractional pips to trade near the 1.32122 level.
          Although UK inflationary pressures have rebounded markedly in recent months—with August CPI rising 3.1% YoY compared to 2.9% in July, and CPIH (including housing costs) reaching 3.3% as education, housing, and transport costs surged across the board—the single-sided impact of the US payroll data has left GBP/USD heavily skewed to the downside.
          Last Friday's US NFP showed an addition of just 29,000 jobs in September, far below the forecasted 90,000. Prior months were also heavily revised downward: July was adjusted from +21,000 to -10,000, and August from +162,000 to +133,000—a combined net loss of 60,000 jobs relative to initial reports. In other words, the US labor market has indeed been cooling down over recent months, rather than in September alone.
          Following the release, the CME FedWatch tool indicated a sharp pivot in market expectations for the Federal Reserve's October 27–28 meeting. The probability of a 25 bps rate hike dropped to around 22%, while the likelihood of holding rates steady in the 3.75%–4.00% range jumped to roughly 77.9%.
          However, after digesting the data, the US Dollar Index reversed course and moved higher instead of falling. The underlying reason lies in the stark contrast between the two separate employment datasets in the September report: the Establishment Survey and the Household Survey.
          The Establishment Survey yields the headline non-farm payroll figure (+29,000). In contrast, the Household Survey showed an increase of 406,000 employed persons, while the labor force grew by 485,000, pushing the labor force participation rate up from 61.6% to 61.8%.
          These two surveys differ primarily in target populations, statistical methodologies, and sub-category handling. Briefly put, the Household Survey avoids double-counting: even if an individual holds multiple part-time jobs, they are counted only once. The Establishment Survey, however, counts every active payroll record—meaning a person working multiple jobs is counted multiple times—which occasionally distorts headline NFP figures. Consequently, the Household Survey offers a more conservative and ground-level perspective.
          The Household Survey reveals a crucial fact: the current US labor market is characterized by "low hiring and low layoffs," rather than widespread corporate job cuts.
          Another key signal comes from wages. Average hourly earnings for US private non-farm employees rose by just 0.1% MoM and 3.0% YoY in September, marking the slowest annual growth rate since May 2021, while average weekly hours held steady at 34.4.
          While slowing wage growth is not a positive sign for job seekers, from the Fed's perspective, it indicates that labor-cost-driven inflationary pressures are easing.
          Yet US inflation remains above target, framing the core macro picture: if the US economy continues to expand at a steady pace with inflation above 2%, and the labor market is transitioning from "overheated" to "low hiring, low layoffs," why would the Fed completely abandon rate hikes solely due to one soft NFP report?
          The answer is: there is no such necessity.
          What the September NFP changed was likely the timing of rate hikes, rather than the overall direction of monetary policy.
          Therefore, traders should avoid focusing exclusively on the headline 29,000 NFP figure. Monetary policy decisions are dictated by the broader interplay among employment, inflation, and economic growth.
          While the headline NFP print was undeniably weak, assessing it alongside the Household Survey, participation rate, unemployment rate, wage growth, jobless claims, and GDP growth indicates that the US economy is far healthier than the headline NFP implies. Reduced expectations for an October rate hike do not equate to the elimination of rate hikes within the year. This realization led the market to adjust its cognitive gap, providing fundamental backing for the US dollar's recovery.

          Technical Analysis

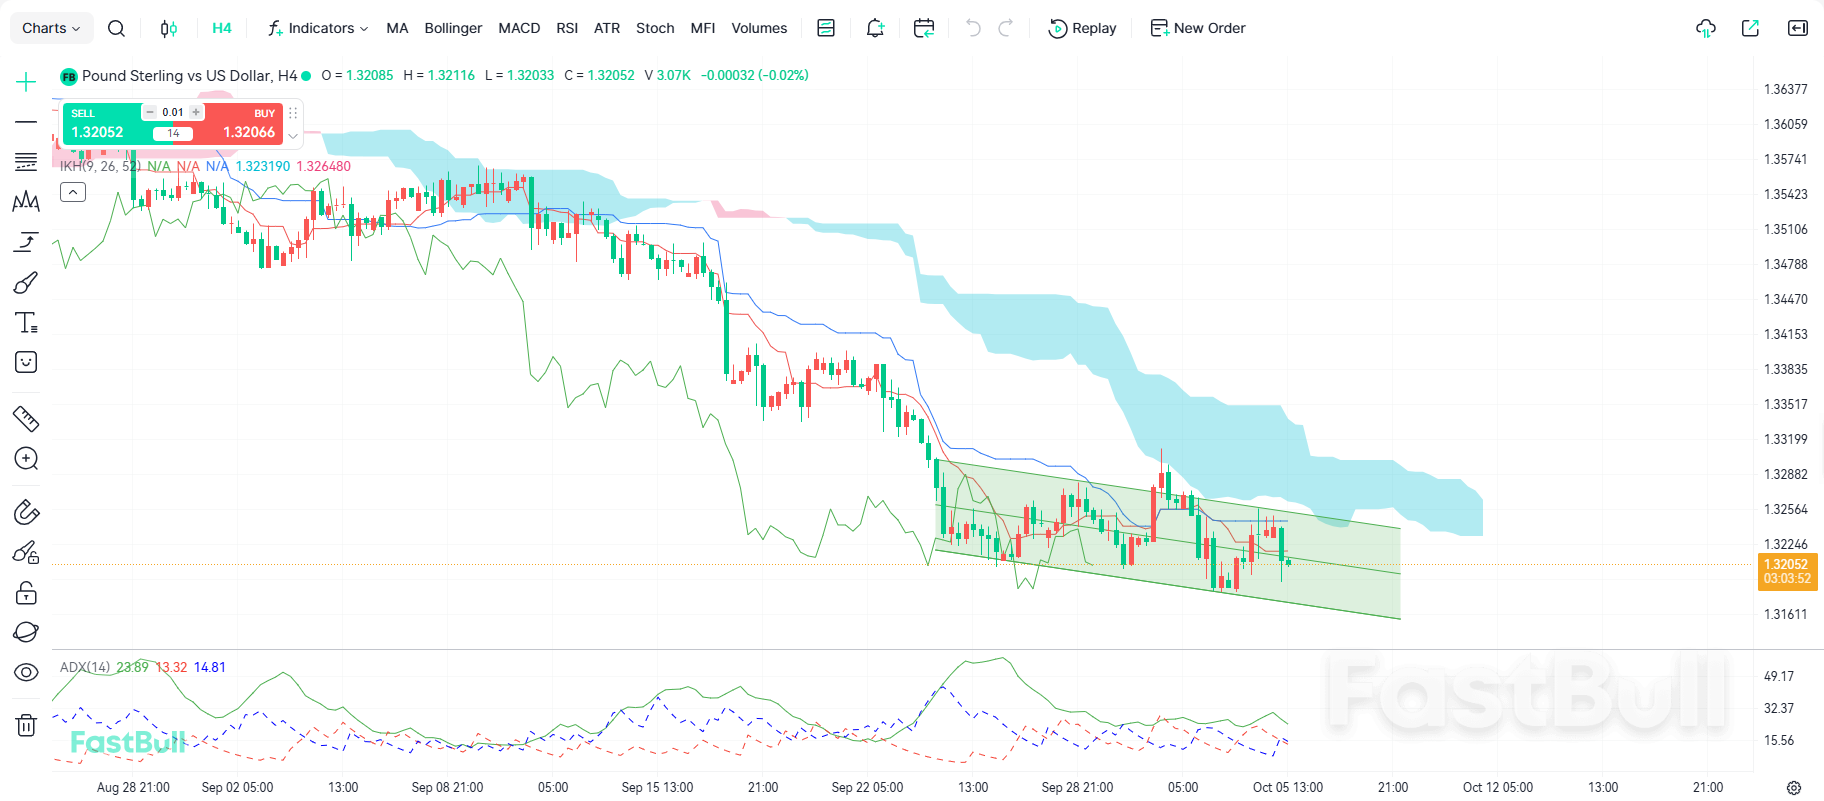
          On the 4-hour chart, GBP/USD is consolidating at lower levels within a downward regression channel following its rapid sell-off, currently searching for a bottom between the channel's middle and lower rails. Key downside support rests at 1.31611, where the lower channel rail converges with recent swing lows; a breakdown below this line would disrupt the channel consolidation structure and trigger a new leg lower. Key upside resistance sits in the 1.32648–1.32882 zone (the confluence of the upper channel rail and the Ichimoku Kijun-sen), with stronger overhead resistance located at the lower bound of the thick bearish cloud (around 1.33199–1.33517). GBP/USD remains capped below the cloud and mid-channel rail, though whether it can establish a base around 1.31611 to launch a rebound requires further observation.
          In terms of technical indicators, within the Ichimoku system, the Tenkan-sen (red line, ~1.32648) and Kijun-sen (blue line, ~1.32319) have formed a bearish dead cross, while price (1.32052) trades well below the thick bearish cloud (Senkou Span A/B), confirming that short-to-medium-term momentum remains dominated by sellers.
          In the ADX indicator, the ADX line (green line, 23.89) is flattening at low levels, while +DI (red line, 13.32) and -DI (blue line, 14.81) are tightly intertwined, indicating that downside momentum has decelerated following the initial sharp drop and transitioned into a weak consolidation phase. Given that the current price (1.32052) sits extremely close to the lower channel rail and the key support zone at 1.31611, the probability of price stabilizing to launch an oversold technical bounce is elevated.GBP Plunges over 60 Pips, Short-Term Rebound Expected_1

          Trading Recommendations

          Direction: Buy / Long
          Entry: 1.31800
          Target: 1.32800
          Stop Loss: 1.31300
          Support Levels: 1.31611, 1.31300, 1.31000
          Resistance Levels: 1.32319, 1.32648, 1.32882
          Risk Warnings and Disclaimers
          You understand and acknowledge that there is a high degree of risk involved in trading. Following any strategies or investment methods may lead to potential losses. The content on the site is provided by our contributors and analysts for information purposes only. You are solely responsible for determining whether any trading assets, securities, strategy, or any other product is suitable for investing based on your own investment objectives and financial situation.
          Add to Favorites
          Share
          FastBull
          Copyright © 2026 FastBull Ltd

          728 RM B 7/F GEE LOK IND BLDG NO 34 HUNG TO RD KWUN TONG KLN HONG KONG

          TelegramInstagramTwitterfacebooklinkedin
          App Store Google Play Android Windows
          Products
          Charts

          Chats

          Q&A with Experts
          Screeners
          Economic Calendar
          Data
          Tools
          Membership
          Features
          Function
          Markets
          Copy Trading
          Latest Signals
          Contests
          24/7
          Analysis
          Education
          Company
          Careers
          About Us
          Contact Us
          Advertising
          Download FastBull
          Help Center
          Feedback
          User Agreement
          Privacy Policy
          Personal Information Protection Statement
          Business

          White Label

          Broker API

          Data API

          Web Plug-ins

          Poster Maker

          Affiliate Program

          Risk Disclosure

          The risk of loss in trading financial instruments such as stocks, FX, commodities, futures, bonds, ETFs and crypto can be substantial. You may sustain a total loss of the funds that you deposit with your broker. Therefore, you should carefully consider whether such trading is suitable for you in light of your circumstances and financial resources.

          No decision to invest should be made without thoroughly conducting due diligence by yourself or consulting with your financial advisors. Our web content might not suit you since we don't know your financial conditions and investment needs. Our financial information might have latency or contain inaccuracy, so you should be fully responsible for any of your trading and investment decisions. The company will not be responsible for your capital loss.

          Without getting permission from the website, you are not allowed to copy the website's graphics, texts, or trademarks. Intellectual property rights in the content or data incorporated into this website belong to its providers and exchange merchants.

          Not Logged In

          Log in to access more features

          Connect Broker
          Become a signal provider
          Help Center
          Customer Service
          Dark Mode
          Price Up/Down Colors

          Log In

          Sign Up

          Position
          Layout
          Fullscreen
          Default to Chart
          The chart page opens by default when you visit fastbull.com