• Trade
  • Markets
  • Copy
  • Contests
  • 24/7
  • Calendar
  • Q&A
  • Chats
Screeners
SYMBOL
LAST
BID
ASK
HIGH
LOW
NET CHG.
%CHG.
SPREAD
SOURCE
SPX
S&P 500 Index
7520.93
7520.93
7520.93
7543.92
7470.43
-29.01
-0.38%
--
--
DJI
Dow Jones Industrial Average
52231.89
52231.89
52231.89
52316.89
51977.08
-157.86
-0.30%
--
--
IXIC
NASDAQ Composite Index
25065.86
25065.86
25065.86
25286.83
24816.10
-187.26
-0.74%
--
--
USDX
US Dollar Index
102.122
102.122
102.202
102.160
102.073
+0.002
0.00%
--
--
EURUSD
Euro / US Dollar
1.11642
1.11642
1.11651
1.11697
1.11583
+0.00006
+ 0.01%
--
--
GBPUSD
Pound Sterling / US Dollar
1.33477
1.33477
1.33489
1.33552
1.33328
+0.00046
+ 0.03%
--
--
XAUUSD
Gold / US Dollar
4045.36
4045.36
4045.81
4052.53
4026.43
+13.09
+ 0.32%
--
--
WTI
Light Sweet Crude Oil
85.508
85.508
85.543
85.783
85.095
+0.068
+ 0.08%
--
--

Community Accounts

Signal Accounts
--
Profit Accounts
--
Loss Accounts
--
View More

Become a signal provider

Sell trading signals to earn additional income

View More

Guide to Copy Trading

Get started with ease and confidence

View More

Signal Accounts for Members

All Signal Accounts

Best Return
  • Best Return
  • Best P/L
  • Best MDD
Past 1W
  • Past 1W
  • Past 1M
  • Past 1Y

All Contests

  • All
  • Recommend
  • Stocks
  • Cryptocurrencies
  • Central Banks
  • Trump Updates
  • Featured News
Top News Only
Share

The Overnight Hong Kong Dollar Hibor Rose 71 Basis Points To 3.11%, Marking The Largest Increase Since September 30

Share

The Most Active Japanese Rubber Futures Contract Extended Its Gains To 2.00% On The Day, Currently Trading At 427.10 Yen Per Kilogram

Share

The Main Contract For No. 20 Rubber Rose 4% Intraday, Currently Trading At 16,540.00 Yuan

Share

The Main Lithium Carbonate Futures Contract Rose More Than 2.00% Intraday, Currently Trading At 89,860 Yuan/ton

Share

The Governor Of Russia's Leningrad Oblast, Citing Preliminary Data, Said That Drones Attacked The Baltic Port City Of Ust-Luga

Share

The Bank Of Korea Reported That Net Lending To Households By Korean Banks Increased By 5 Trillion Won In October, Compared With A Net Increase Of 0.5 Trillion Won In September

Share

The Main Contract For TSR20 Rubber Surged By 500.00 Yuan During The Day, Currently Trading At 16,400.00 Yuan/ton, An Increase Of 3.14%

Share

The BMD Malaysian Palm Oil Futures Contract Extended Its Gains To 2.00% Intraday, Currently Trading At 4,342 Ringgit Per Tonne

Share

The Main Caustic Soda Contract Rose More Than 2.00% Intraday, Currently Trading At 1561 Yuan/ton

Share

Brent Crude Oil Rose 1% On The Day, Currently Trading At $92.42 Per Barrel

Share

The Bank Of Thailand: Overall Credit Growth Accelerated, Mainly Driven By Loans To Large Corporations

Share

The Bank Of Thailand Stated That The Thai Baht's Depreciation, Exceeding That Of Other Regional Currencies, Reflects The Country's Economic Structure And Heavy Reliance On Energy Imports

Share

The Thai Baht Weakened To 33.570 Against The US Dollar

Share

Bank Of Thailand Meeting Minutes: Upside Risks To Inflation Warrant Close Attention Due To Rising Uncertainty

Share

Bank Of Thailand Meeting Minutes: The Assessment Of Thailand's Economic Situation Should Place Greater Emphasis On Broad Indicators Of Recovery Across All Economic Sectors

Share

Bank Of Thailand Meeting Minutes: A Policy Mix That Needs To Be Coordinated

Share

Bank Of Thailand Meeting Minutes: The Committee Expressed Concern About The Concentration Of Growth In Technology And Artificial Intelligence-related Sectors

Share

Bank Of Thailand Meeting Minutes: High Household Debt Continues To Constrain Private Consumption In Thailand

Share

Bank Of Thailand Meeting Minutes: Maintaining Low Policy Rates Amid Diverging Global Monetary Policies, While Major Central Banks Tightening Monetary Policy, Could Contribute To The Accumulation Of Stability Risks

Share

Bank Of Thailand Meeting Minutes: Overall Economic Growth In Thailand Remains Below Potential And Uneven

TIME
ACT
FCST
PREV
IMPACT
France ILO Unemployment Rate (SA) (Q3)

A:--

F: --

P: --

EURUSD
  • EURUSD
  • XAUUSD
  • XAGUSD
  • WTI
  • USDX
South Africa Unemployment Rate (Q3)

A:--

F: --

P: --

XAUUSD
  • XAUUSD
  • XAGUSD
  • WTI
  • USDX
FOMC Member Waller Speaks
U.K. 30-Year JGB Auction Yield

A:--

F: --

P: --

GBPUSD
  • GBPUSD
  • XAUUSD
  • XAGUSD
  • WTI
  • USDX
U.S. NFIB Small Business Optimism Index (SA) (Oct)

A:--

F: --

P: --

USDX
  • USDX
  • XAUUSD
  • XAGUSD
  • WTI
U.S. Real Income MoM (SA) (Oct)

A:--

F: --

P: --
USDX
  • USDX
  • XAUUSD
  • XAGUSD
  • WTI
U.S. Core CPI MoM (SA) (Oct)

A:--

F: --

P: --

XAUUSD
  • XAUUSD
  • XAGUSD
  • WTI
  • USDX
U.S. CPI MoM (SA) (Oct)

A:--

F: --

P: --

XAUUSD
  • XAUUSD
  • XAGUSD
  • WTI
  • USDX
U.S. Core CPI (SA) (Oct)

A:--

F: --

P: --

XAUUSD
  • XAUUSD
  • XAGUSD
  • WTI
  • USDX
U.S. CPI MoM (Not SA) (Oct)

A:--

F: --

P: --

XAUUSD
  • XAUUSD
  • XAGUSD
  • WTI
  • USDX
U.S. Weekly Redbook Index YoY

A:--

F: --

P: --

XAUUSD
  • XAUUSD
  • XAGUSD
  • WTI
  • USDX
China, Mainland M1 Money Supply YoY (Oct)

--

F: --

P: --

China, Mainland Social Financing Scale (Oct)

--

F: --

P: --

China, Mainland M2 Money Supply YoY (Oct)

--

F: --

P: --

China, Mainland M0 Money Supply YoY (Oct)

--

F: --

P: --

ECB Chief Economist Lane Speaks
U.S. EIA Short-Term Crude Production Forecast For The Year (Nov)

A:--

F: --

P: --

WTI
  • WTI
  • XAUUSD
  • XAGUSD
  • USDX
U.S. EIA Natural Gas Production Forecast For The Next Year (Nov)

A:--

F: --

P: --

WTI
  • WTI
  • XAUUSD
  • XAGUSD
  • USDX
U.S. EIA Short-Term Crude Production Forecast For The Next Year (Nov)

A:--

F: --

P: --

WTI
  • WTI
  • XAUUSD
  • XAGUSD
  • USDX
EIA Monthly Short-Term Energy Outlook
U.S. 10-Year Note Auction Avg. Yield

A:--

F: --

P: --

XAUUSD
  • XAUUSD
  • XAGUSD
  • WTI
  • USDX
U.S. Cleveland Fed CPI MoM (Oct)

A:--

F: --

P: --

USDX
  • USDX
  • XAUUSD
  • XAGUSD
  • WTI
U.S. API Weekly Refined Oil Stocks

A:--

F: --

P: --

WTI
  • WTI
  • XAUUSD
  • XAGUSD
  • USDX
U.S. API Weekly Cushing Crude Oil Stocks

A:--

F: --

P: --

WTI
  • WTI
  • XAUUSD
  • XAGUSD
  • USDX
U.S. API Weekly Gasoline Stocks

A:--

F: --

P: --

WTI
  • WTI
  • XAUUSD
  • XAGUSD
  • USDX
U.S. API Weekly Crude Oil Stocks

A:--

F: --

P: --

WTI
  • WTI
  • XAUUSD
  • XAGUSD
  • USDX
Japan Reuters Tankan Manufacturers Index (Nov)

A:--

F: --

P: --

USDJPY
  • USDJPY
  • XAUUSD
  • XAGUSD
  • WTI
Japan Reuters Tankan Non-Manufacturers Index (Nov)

A:--

F: --

P: --

USDJPY
  • USDJPY
  • XAUUSD
  • XAGUSD
  • WTI
South Korea Unemployment Rate (SA) (Oct)

A:--

F: --

P: --

XAUUSD
  • XAUUSD
  • XAGUSD
  • WTI
Philadelphia Fed President Henry Paulson delivers a speech
Australia House Loan Permits MoM (SA) (Q3)

A:--

F: --

P: --

AUDUSD
  • AUDUSD
  • XAUUSD
  • XAGUSD
  • WTI
Turkey Retail Sales YoY (Sept)

--

F: --

P: --

Germany GDP Prelim QoQ (SA) (Oct)

--

F: --

P: --

Germany GDP Prelim YoY (Working-day Adjusted) (Oct)

--

F: --

P: --

Germany HICP Final MoM (Oct)

--

F: --

P: --

Germany HICP Final YoY (Oct)

--

F: --

P: --

Italy Industrial Output YoY (SA) (Sept)

--

F: --

P: --

Italy 12-Month BOT Auction Avg. Yield

--

F: --

P: --

U.S. MBA Mortgage Application Activity Index WoW

--

F: --

P: --

Brazil Services Growth YoY (Sept)

--

F: --

P: --

Mexico Industrial Output YoY (Sept)

--

F: --

P: --

Russia Trade Balance (Sept)

--

F: --

P: --

U.S. Refinitiv/Ipsos Primary Consumer Sentiment Index (PCSI) (Nov)

--

F: --

P: --

Japan PPI MoM (Oct)

--

F: --

P: --

Japan Domestic Enterprise Commodity Price Index YoY (Oct)

--

F: --

P: --

Japan Domestic Enterprise Commodity Price Index MoM (Oct)

--

F: --

P: --

Australia Consumer Inflation Expectations (Nov)

--

F: --

P: --

U.K. 3-Month RICS House Price Balance (Oct)

--

F: --

P: --

U.K. Trade Balance (Sept)

--

F: --

P: --

U.K. Construction Output MoM (SA) (Sept)

--

F: --

P: --

U.K. Services Index MoM (Sept)

--

F: --

P: --

U.K. GDP YoY (SA) (Sept)

--

F: --

P: --

U.K. Trade Balance (SA) (Sept)

--

F: --

P: --

U.K. Industrial Output YoY (Sept)

--

F: --

P: --

U.K. Trade Balance Non-EU (SA) (Sept)

--

F: --

P: --

U.K. Construction Output YoY (Sept)

--

F: --

P: --

U.K. Manufacturing Output YoY (Sept)

--

F: --

P: --

U.K. Monthly GDP 3M/3M Change (Sept)

--

F: --

P: --

U.K. GDP MoM (Sept)

--

F: --

P: --

U.K. Manufacturing Output MoM (Sept)

--

F: --

P: --

U.K. Industrial Output MoM (Sept)

--

F: --

P: --

Q&A with Experts
    • All
    • Chatrooms
    • Groups
    • Friends
    HMD-XAU ! flag
    HMD-XAU ! flag
    HMD-XAU ! flag
    HMD-XAU ! flag
    HMD-XAU ! flag
    "HMD-XAU !" recalled a message
    Skylark flag
    Good Morning traders. How are you all doing today?
    Skylark flag
    HMD-XAU !
    @HMD-XAU ! Hello and how are you doing today? And how is it going at your end? I see you're trading this currency pair at the moment and this is giving you some whole lot of profit. I can say that today is going to be great.
    Skylark flag
    HMD-XAU !
    @HMD-XAU !Nice catch show me British you got you. So what's your target for this trade?
    Skylark flag
    HMD-XAU !
    @HMD-XAU !This is a market, really going well for you, and it's still going well. So, tell me, what's your target for this trade, and how long do you plan on holding it?
    Saka the Gunners flag
    Gold waterfall not finish yet
    Skylark flag
    Saka the Gunners
    Gold waterfall not finish yet
    @Saka the GunnersHey mate, how are you doing today? And how is it going over on your end?endure you currently trading gold at the moment. And yes, gold isn't done with its bearish trend. It has some more move to make.
    Saka the Gunners flag
    Skylark
    @Saka the GunnersHey mate, how are you doing today? And how is it going over on your end?endure you currently trading gold at the moment. And yes, gold isn't done with its bearish trend. It has some more move to make.
    good brother..i hold sell...first trap buyers before a big move.
    Skylark flag
    Saka the Gunners
    good brother..i hold sell...first trap buyers before a big move.
    @Saka the GunnersAre you trying to say that your sell was trapped, that it hit your stop loss before the big move happens?
    Skylark flag
    Saka the Gunners
    good brother..i hold sell...first trap buyers before a big move.
    @Saka the GunnersBut if you mean that gold first trap buyers before actually taking the move or the big move, that's the direction, then I'll say yes. The trap, or first trap to the bias was manipulation before the distribution. So that's just what happened.
    B&W flag
    mohon signal emas
    Skylark flag
    B&W
    mohon signal emas
    @B&W Hello mate, how are you doing today? And welcome back here. Concerning gold signal, gold, just like you know, is bearish. It's going short. So, at the moment, it is having a pullback. So, wait for the pullback to be over. Rather, still, you can use a Fibonacci retracement and check how the retracement will last. And once the retracement is done, you can continue with the short because gold will continue the bearish trend. It's not yet over.
    B&W flag
    Skylark
    @B&W Hello mate, how are you doing today? And welcome back here. Concerning gold signal, gold, just like you know, is bearish. It's going short. So, at the moment, it is having a pullback. So, wait for the pullback to be over. Rather, still, you can use a Fibonacci retracement and check how the retracement will last. And once the retracement is done, you can continue with the short because gold will continue the bearish trend. It's not yet over.
    @Skylarkkabar baik, terima kasih informasinya
    fulltimetrader flag
    早上上面在4060,下面在4025附近
    fulltimetrader flag
    黄金
    Type here...
    Add Symbol or Code

      No matching data

      All
      Recommend
      Stocks
      Cryptocurrencies
      Central Banks
      Trump Updates
      Featured News
      • All
      • Russia-Ukraine Conflict
      • Middle East Flashpoint
      • All
      • Russia-Ukraine Conflict
      • Middle East Flashpoint

      Search
      Products

      Charts Free Forever

      Chats Q&A with Experts
      Screeners Economic Calendar Data Tools
      Membership Features
      Data Warehouse Market Trends Institutional Data Policy Rates Macro

      Market Trends

      Market Sentiment Order Book Forex Correlations

      Top Indicators

      Charts Free Forever
      Markets

      News

      24/7 Analysis Education

      Latest Views

      Latest Update

      Signals

      Copy Rankings Latest Signals Become a signal provider AI Rating
      Contests
      Brokers

      Overview Brokers Assessment Rankings Regulators News Claims
      Broker listing Forex Brokers Comparison Tool Live Spread Comparison Scam
      Q&A Complaint Scam Alert Videos Tips to Detect Scam
      More

      Business
      Events
      Careers About Us Advertising Help Center

      White Label

      Broker API

      Data API

      Web Plug-ins

      Affiliate Program

      Awards Institution Evaluation IB Seminar Salon Event Exhibition
      Vietnam Thailand Singapore Dubai
      Fans Party Investment Sharing Session
      FastBull Summit BrokersView Expo
      Recent Searches
        Top Searches
          Markets
          Analysis
          User
          24/7
          Economic Calendar
          Education
          Data
          • Names
          • Latest
          • Prev

          View All

          No data

          Scan to Download

          Faster Charts, Chat Faster!

          Download
          English
          • English
          • Español
          • العربية
          • Bahasa Indonesia
          • Bahasa Melayu
          • Tiếng Việt
          • ภาษาไทย
          • Français
          • Italiano
          • Türkçe
          • Русский язык
          • 简中
          • 繁中
          Open Account
          Search
          Products
          Charts Free Forever
          Markets
          News
          Signals

          Copy Rankings Latest Signals Become a signal provider AI Rating
          Contests
          Brokers

          Overview Brokers Assessment Rankings Regulators News Claims
          Broker listing Forex Brokers Comparison Tool Live Spread Comparison Scam
          Q&A Complaint Scam Alert Videos Tips to Detect Scam
          More

          Business
          Events
          Careers About Us Advertising Help Center

          White Label

          Broker API

          Data API

          Web Plug-ins

          Affiliate Program

          Awards Institution Evaluation IB Seminar Salon Event Exhibition
          Vietnam Thailand Singapore Dubai
          Fans Party Investment Sharing Session
          FastBull Summit BrokersView Expo

          Bullish Momentum Remains on the Table Following a Support Rejection

          Manuel

          Central Bank

          Economic

          Summary:

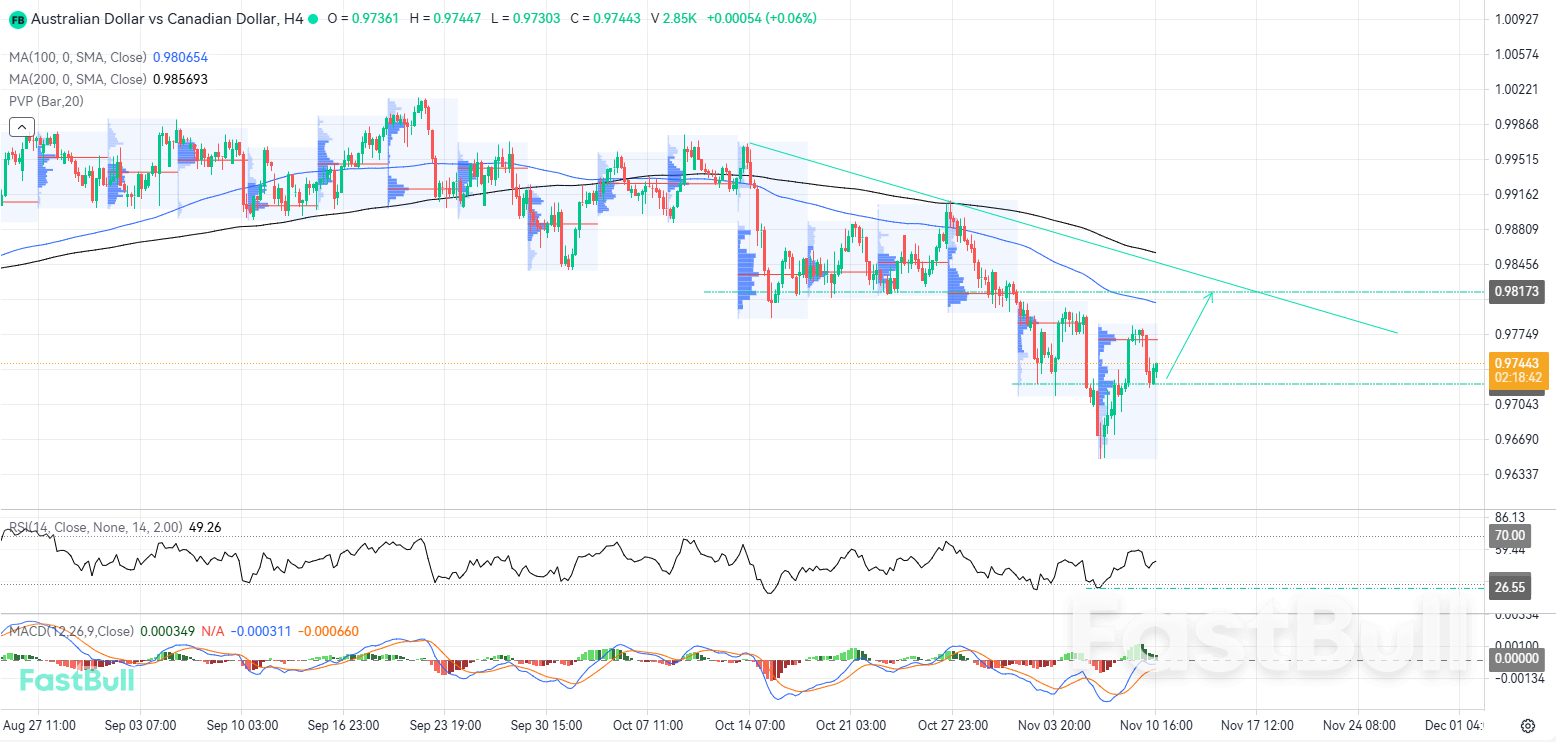
          Looking at the oscillators, the RSI currently stands at 49 and is approaching the bullish territory after rebounding from 26, where it had previously reached considerably oversold conditions.

          BUY AUDCAD
          EXP
          TRADING

          0.97462

          Entry Price

          0.98170

          TP

          0.96900

          SL

          0.97655 +0.00266 +0.27%

          0.0

          Pips

          Flat

          0.96900

          SL

          Exit Price

          0.97462

          Entry Price

          0.98170

          TP
          The Reserve Bank of Australia (RBA) raised its cash rate by 25 basis points to 4.85%, although its statement adopted a less aggressive tone regarding the possibility of further monetary tightening. The decision was reached through a 6-3 vote, with three members favoring an unchanged rate due to concerns about rising unemployment and weakness in the housing market.
          The RBA also revised its inflation forecasts upward, with both headline and core inflation now expected to remain above 3% through the end of 2027. Inflation is not projected to return to the midpoint of the central bank's 2-3% target range until mid-2028. The decision suggests that the RBA could pause at its next meeting, although further tightening cannot be ruled out if inflationary pressures remain persistently elevated.
          Reserve Bank of Australia Deputy Governor Andrew Hauser also spoke during the Sir Leslie Melville Lecture on “Trust, Expectations and Monetary Policy” at the Australian National University in Canberra on Thursday, during the European session. His comments explicitly highlighted that inflationary pressures remain very elevated, reinforcing the central bank's concerns about the persistence of price increases.
          In Canada, employment declined for the third consecutive month in October, according to data released by Statistics Canada on Friday. The economy lost 4.7K jobs, compared with market expectations for an increase of 13.6K, following declines of 68.3K in September and 41.7K in August. Meanwhile, the Unemployment Rate rose to 6.7% from 6.5%, reflecting further weakness in labor market conditions.
          The Bank of Canada (BoC) raised its benchmark interest rate by 25 basis points to 2.50% in October and indicated that additional increases could become necessary to prevent higher energy costs from spreading into broader inflation. However, the latest employment figures make the outlook more complicated for policymakers. Persistent inflationary pressures continue to leave the possibility of another rate increase open, although the weakening labor market provides an additional reason to wait before implementing further monetary tightening.Bullish Momentum Remains on the Table Following a Support Rejection_1

          Technical Analysis

          AUDCAD has recovered from its local lows after reaching 0.9648 on November 6. The pair has recently experienced a modest pullback, finding support around 0.9725. If price manages to hold above this level, bullish momentum could accelerate once again toward the descending trendline, where the 100-period and 200-period moving averages are positioned nearby at 0.9873 and 0.9902, respectively. In this context, the resistance area around 0.9817 could act as an intermediate level, potentially attracting price toward the broader cluster of technical indicators.
          Looking at the oscillators, the RSI currently stands at 49 and is approaching the bullish territory after rebounding from 26, where it had previously reached considerably oversold conditions. Meanwhile, the MACD shows a bullish histogram that has lost some of its depth. However, its signal lines are moving closer to the neutral zone, and a bullish crossover could bring both components into alignment with the ongoing recovery. If this develops, it could provide additional support for the upside move and potentially accelerate bullish momentum.
          Trading Recommendations
          Trading direction: Buy
          Entry price: 0.9744
          Target price: 0.9817
          Stop loss: 0.9690
          Validity: Nov 20, 2026 15:00:00
          Risk Warnings and Disclaimers
          You understand and acknowledge that there is a high degree of risk involved in trading. Following any strategies or investment methods may lead to potential losses. The content on the site is provided by our contributors and analysts for information purposes only. You are solely responsible for determining whether any trading assets, securities, strategy, or any other product is suitable for investing based on your own investment objectives and financial situation.
          Add to Favorites
          Share
          FastBull
          Copyright © 2026 FastBull Ltd

          728 RM B 7/F GEE LOK IND BLDG NO 34 HUNG TO RD KWUN TONG KLN HONG KONG

          TelegramInstagramTwitterfacebooklinkedin
          App Store Google Play Android Windows
          Products
          Charts

          Chats

          Q&A with Experts
          Screeners
          Economic Calendar
          Data
          Tools
          Membership
          Features
          Function
          Markets
          Copy Trading
          Latest Signals
          Contests
          24/7
          Analysis
          Education
          Company
          Careers
          About Us
          Contact Us
          Advertising
          Download FastBull
          Help Center
          Feedback
          User Agreement
          Privacy Policy
          Personal Information Protection Statement
          Business

          White Label

          Broker API

          Data API

          Web Plug-ins

          Poster Maker

          Affiliate Program

          Risk Disclosure

          The risk of loss in trading financial instruments such as stocks, FX, commodities, futures, bonds, ETFs and crypto can be substantial. You may sustain a total loss of the funds that you deposit with your broker. Therefore, you should carefully consider whether such trading is suitable for you in light of your circumstances and financial resources.

          No decision to invest should be made without thoroughly conducting due diligence by yourself or consulting with your financial advisors. Our web content might not suit you since we don't know your financial conditions and investment needs. Our financial information might have latency or contain inaccuracy, so you should be fully responsible for any of your trading and investment decisions. The company will not be responsible for your capital loss.

          Without getting permission from the website, you are not allowed to copy the website's graphics, texts, or trademarks. Intellectual property rights in the content or data incorporated into this website belong to its providers and exchange merchants.

          Not Logged In

          Log in to access more features

          Connect Broker
          Become a signal provider
          Help Center
          Customer Service
          Dark Mode
          Price Up/Down Colors

          Log In

          Sign Up

          Position
          Layout
          Fullscreen
          Default to Chart
          The chart page opens by default when you visit fastbull.com