


- WTI
- XAUUSD
- XAGUSD
- USDX


Markets
Analysis
User
24/7
Economic Calendar
Education
Data
- Names
- Latest
- Prev









A gap between implied and historical volatility does not establish a selling edge. Two price paths and an explicit probability model show how to separate observed variance, expected compensation and the seller’s final cash result.
Implied volatility can stand above historical volatility while a variance seller still has a negative expected payoff. The missing ingredient is a forecast for the same future window: how much variation might actually occur, with what probability? A second distinction matters just as much. Even a positive expected payoff does not prevent a large realized loss. An observed gap, a modelled risk premium and a cash settlement are three different accounts.
Suppose the past 20 daily log returns consist of ten pairs of +0.01 and −0.01. Their squared sum is 0.0020. Under the annualization convention used below, that is 252 variance points, equivalent to annualized realized volatility of 15.8745%. Now suppose a new, hypothetical variance exposure can be entered at an agreed variance level of 400, equivalent to 20% volatility.
The subtraction 400 − 252 produces 148 variance points. Subtracting the volatility numbers instead produces 4.1255 percentage points. Neither number is a dollar profit, and the two differences are not interchangeable. More importantly, the 252 describes observations that have already happened; the 400 prices a period that has not yet happened.
Using the past window as the forecast for the next one is a possible modelling choice. Under that explicit choice, 148 would be a premium estimate. It is not a conclusion supplied by the chart itself. A coming event, a changed trading regime or a different estimate of extreme moves can alter the forecast without changing a single historical observation.
Here the positive-sign convention for the variance risk premium is the pricing expectation of future variance minus its physical, or statistical, expectation: EQ[future RV] − EP[future RV]. Q and P are different probability weightings, not bullish and bearish scenarios. The physical expectation is unobservable and has to be estimated.
For a suitably specified, ideal zero-initial-value variance claim, its fair strike can represent the pricing expectation. An actual executable quote may require adjustments for contract terms, funding, credit and transaction costs. A single at-the-money option’s implied volatility, or a volatility index squared, is not automatically the executable strike of that claim.
Our original example starts before all 20 return observations. There are 21 daily prices, with decimal log returns ri = ln(Pi/Pi−1). The agreed calculation is:
RV in variance points = 10,000 × (252/20) × Σri2
There is no subtraction of the sample mean and no denominator of 19. Those belong to different estimators. Set the strike K to 400 and the aggregate exposure to USD 100 per variance point. With zero interest, no credit adjustment and costs initially excluded, the seller’s terminal gross P&L is 100 × (400 − RV); the buyer has the opposite result. The USD 100 is not invested principal or a claim about any listed contract’s multiplier, so it cannot serve as the denominator for an investment return.
Consider two hypothetical future paths, both starting at 100 and ending at 100. Path A repeats ten pairs of +0.01 and −0.01 log returns. Path B repeats nine such pairs, then finishes with −0.08 and +0.08. Both are back at 100 on day 18. The last two moves in B are roughly −7.6884% and +8.3287% in ordinary percentage-return terms—not a conventional 8% fall followed by an 8% rise.
| Metric | A: ordinary oscillation | B: two large log returns |
|---|---|---|
| Day 19 price | 101.005017 | 92.311635 |
| Day 20 price | 100 | 100 |
| Sum of squared decimal log returns | 0.0020 | 0.0146 |
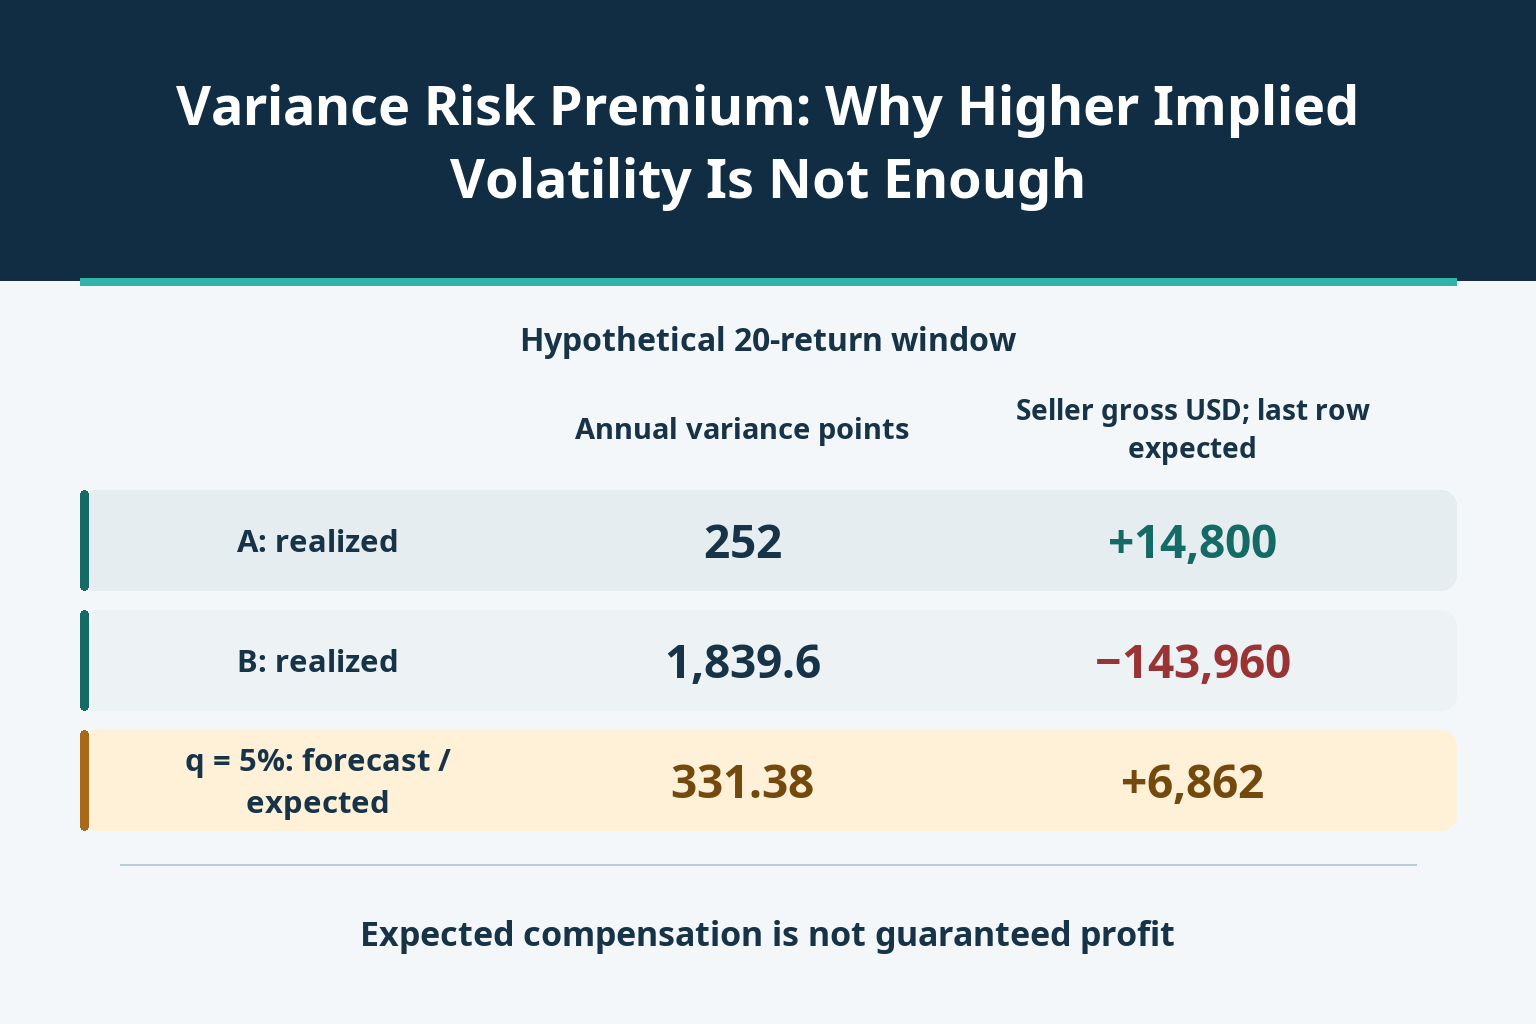
| Annual variance points | 252 | 1,839.6 |
| Annual realized volatility | 15.874508% | 42.890558% |
| Seller gross P&L, USD | +14,800 | −143,960 |
For B, the calculation is 10,000 × (252/20) × [18 × 0.01² + 2 × 0.08²] = 1,839.6 variance points. The complete rebound cancels the cumulative log return, not the squares already added to the variance account. Its seller therefore loses USD 143,960 gross, whereas A generates USD 14,800 gross.
This is why an unchanged underlying price does not establish that a short-variance position was safe. The claim pays on the specified path statistic, not solely on the final price. Equally, this example observes daily fixings; it does not capture every intraday move. A different sampling rule would define a different claim.
Now make a separate, deliberately simple forecast for future variance: 252 points with probability 1 − q, and 1,839.6 with probability q. The two price paths demonstrate those variance outcomes; they are not a complete, calibrated, arbitrage-free model of the traded underlying. In particular, q is an assumed forecasting input, not a market-implied probability or a frequency inferred from the past 20 returns.
The forecast is 252 + 1,587.6q variance points. The strike less that forecast is 148 − 1,587.6q. Multiplying the latter by USD 100 gives the seller’s expected gross cash result. To make the cost question visible, also assume a fixed total USD 1,000 cost in either outcome; this is an illustrative cash adjustment, not an exchange fee schedule.
| Assumed high-variance probability q | Forecast variance points | K minus forecast, points | Expected gross P&L, USD | Assumed cost, USD | Expected net P&L, USD |
|---|---|---|---|---|---|
| 5% | 331.38 | +68.62 | +6,862 | 1,000 | +5,862 |
| 10% | 410.76 | −10.76 | −1,076 | 1,000 | −2,076 |
At q = 5%, the cash calculation can also be checked directly: 0.95 × 14,800 + 0.05 × (−143,960) = USD 6,862. This is the probability-weighted expectation, not a third realized path or promised payment. At q = 10%, expected gross P&L is already negative. The past observations and agreed strike have not changed. Only the future-variance forecast has.
The expectation must be taken in variance units. Taking a square root of forecast variance does not turn it into the expected value of volatility: a nonlinear square root cannot simply be moved through an expectation. Averaging two volatility figures and then squaring them would change this model.
Within this two-outcome model, expected gross P&L is positive only when q < 148/1,587.6 = 9.3222474%. At equality it is zero. The USD 1,000 cost consumes 10 variance points of the assumed USD 100-per-point exposure, moving the positive-net threshold to q < 138/1,587.6 = 8.6923658%.
Those are sensitivity boundaries, not market constants. Changing the high-variance outcome or executable strike changes both thresholds. Changing exposure relative to a fixed dollar cost changes the net threshold; scaling a positive exposure alone does not change the gross threshold. A forecast that only narrowly clears a boundary deserves a different interpretation from one that remains positive under a range of defensible stress assumptions.
Even the 5% forecast still allows the USD 143,960 gross loss. After the assumed cost, the two realized outcomes are +USD 13,800 and −USD 144,960. Positive expectation is compensation for taking uncertain outcomes, not a coupon promised to the seller. Conversely, one bad settlement does not by itself prove that the original expectation was negative; the forecast process and the realized draw must be assessed separately.
A short option, a short straddle and a dynamically delta-hedged option book do not inherit this linear variance formula. Directional exposure, gamma, rebalancing, execution costs and discrete hedging can all affect their P&L. A model premium in variance units is not yet an implementable strategy until the actual instrument and executable price are identified.
The window also has to match. This example begins before every observation; a contract that has already accumulated variance contains a known part and a remaining uncertain part. When comparing expiries, aligning the observation windows with forward variance is a separate necessary step. Missing fixings, final settlement prices and market interruptions must be handled under the actual contract, not by deleting inconvenient observations and changing the denominator.
Finally, terminal P&L is not the same as interim funding. Variation margin, collateral requirements or a costly early exit can require cash before the last observation. None is simulated by this zero-interest terminal example. A positive final expectation cannot demonstrate that the position is affordable through a stress path.
The useful question is not simply whether implied volatility looks expensive against the last month. It is whether a clearly defined future-variance forecast, an executable claim and a survivable cash path jointly support the expected compensation being claimed.

728 RM B 7/F GEE LOK IND BLDG NO 34 HUNG TO RD KWUN TONG KLN HONG KONG





The risk of loss in trading financial instruments such as stocks, FX, commodities, futures, bonds, ETFs and crypto can be substantial. You may sustain a total loss of the funds that you deposit with your broker. Therefore, you should carefully consider whether such trading is suitable for you in light of your circumstances and financial resources.
No decision to invest should be made without thoroughly conducting due diligence by yourself or consulting with your financial advisors. Our web content might not suit you since we don't know your financial conditions and investment needs. Our financial information might have latency or contain inaccuracy, so you should be fully responsible for any of your trading and investment decisions. The company will not be responsible for your capital loss.
Without getting permission from the website, you are not allowed to copy the website's graphics, texts, or trademarks. Intellectual property rights in the content or data incorporated into this website belong to its providers and exchange merchants.
Not Logged In
Log in to access more features


Log In
Sign Up


