


- AUDUSD
- XAUUSD
- XAGUSD
- WTI
- USDX


Markets
Analysis
User
24/7
Economic Calendar
Education
Data
- Names
- Latest
- Prev











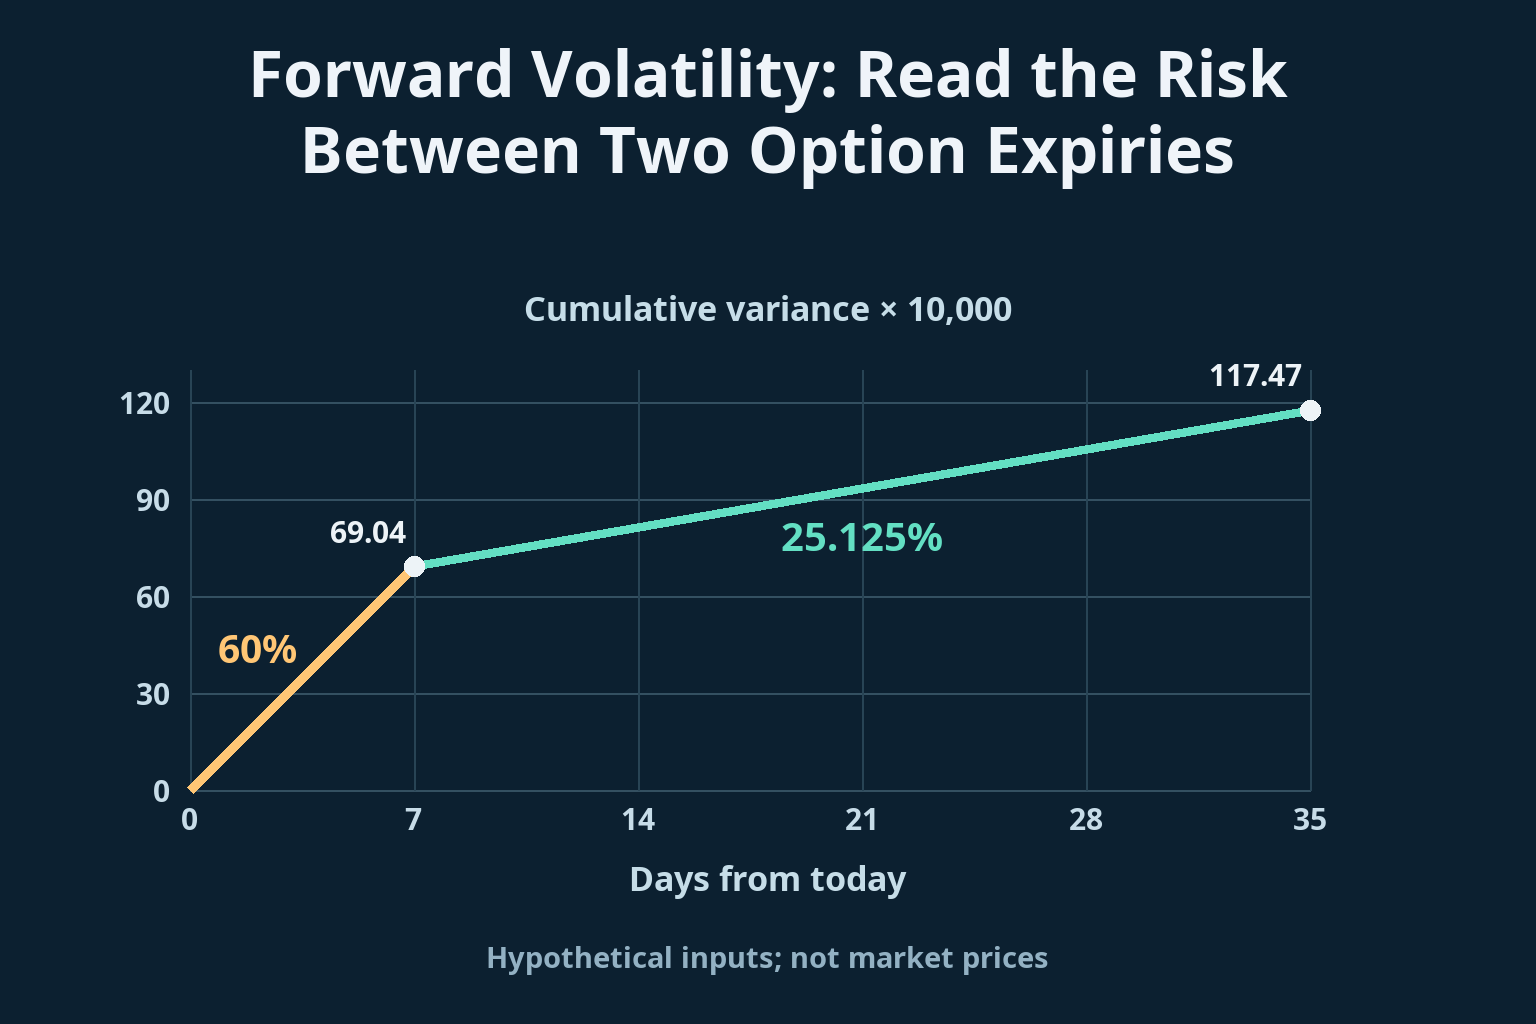
A lower annualized implied volatility can still cover more cumulative risk. Use a seven-day and 35-day example to calculate forward variance, locate event exposure and test what the curve cannot tell you.
One option expiry shows 60% implied volatility; another shows 35%. It is tempting to call the first expensive and the second cheap. But the quotes average risk over different periods. The longer expiry can have a lower annualized number while containing more cumulative uncertainty—and both expiries may include the same scheduled announcement.
Forward volatility asks what is priced into the interval between two expiries, after subtracting the risk assigned to the shared period. The subtraction must be made in variance, not volatility. Even then, the result is a diagnostic of a consistently defined price curve, not a forecast or an automatic calendar-spread trade.
Let T be time in years and σ an annualized volatility expressed as a decimal. In the simplified framework used here, cumulative variance is w(T) = σ²T. If compatible variance exposures cover today to T₁ and today to T₂, the second contains the first. The remaining interval therefore has annualized variance [w(T₂) − w(T₁)] / (T₂ − T₁).
This is cleanest for consistently measured variance exposures. Substituting two at-the-money option IVs is a practical approximation, not a model-free replication. Individual option IVs depend on strike, the volatility smile and the pricing model. A forward variance strike and the square of a forward volatility-swap strike are not interchangeable: averaging and taking a square root do not commute.
Use one time convention throughout. Our examples use calendar days divided by 365. A platform using trading days or a different event clock requires a consistent recalculation of all inputs; inserting 252 in only one part of the equation is not a refinement.
These are invented inputs for the same underlying, timestamp and compatible variance convention. The first expiry is seven days away and the second 35 days away. Treat their quoted volatilities as variance-equivalent annualized levels for the calculation, before considering the limits of an ATM proxy.
w₇ = 0.60² × 7/365 = 0.0069041
w₃₅ = 0.35² × 35/365 = 0.0117466
σ₇,₃₅ = √[(0.35² × 35 − 0.60² × 7) / 28] = 25.125%
| Interval | Annualized volatility | Variance over the interval |
|---|---|---|
| 0–7 | 60.000% | 0.0069041 |
| 0–35 | 35.000% | 0.0117466 |
| 7–35 | 25.125% | 0.0048425 |
The 35-day total variance exceeds the seven-day total despite the lower annualized IV. Their square roots are 8.309% and 10.838%, respectively: horizon-scaled volatility measures, not guaranteed price ranges or exact event probabilities. The residual 28-day interval contains variance of 0.0048425 and has a 25.125% annualized equivalent.
A linear calculation using the volatilities themselves would give (35% × 35 − 60% × 7) / 28 = 28.75%. That is the wrong quantity. An ordinary average of 60% and 35% is wrong too. Always square, time-weight, subtract, divide by the residual time, and only then take the square root.
If a scheduled announcement occurs on day five, both expiries contain it. A high seven-day reading and a lower 35-day average are consistent with risk concentrated near the start. Subtracting the shared period leaves a calmer later interval in this example. It does not isolate the announcement's variance: the first seven days also include ordinary trading, other news and a priced risk premium.
Move the relevant announcement to day 20. It now falls only inside the later expiry. An alternative curve of 20% at seven days and 40% at 35 days gives forward volatility of √[(0.40² × 35 − 0.20² × 7)/28] = 43.589%. The long-expiry average can be below the risk assigned specifically to the later interval. Averages dilute local concentrations.
Neither calculation identifies the direction of the eventual move. Nor does an event guarantee profit for an option buyer. A favorable spot move can be overwhelmed by repricing and time decay, as the worked example of a call losing value while its stock rises illustrates.
A negative residual is a data investigation, not an imaginary volatility forecast. Replace the first pair with seven days at 70% and 35 days at 30%. The numerator becomes 0.30² × 35 − 0.70² × 7 = −0.28, so annualized forward variance is −0.01. Consistent additive variance exposures cannot imply a negative quantity for the remaining interval. Check stale quotes, asynchronous timestamps, wide spreads, mismatched underlyings and incompatible surface points. Two rough ATM marks alone do not establish an executable arbitrage.
The curve is not a real-world forecast. Option prices embed compensation for risk, hedging demand and model choices. The square root of an implied expected variance need not equal the expected future volatility, much less the eventual realized outcome.
A calendar spread is not a pure forward-variance position. Buying one expiry and selling another leaves strike-dependent delta, gamma, vega and expiry exposure; equal contract counts need not offset sensitivities. Exercise or assignment terms, margin and transaction costs matter. Similarly, a VIX future references the future level of an index covering a subsequent volatility window; it is not simply either spot-starting expiry IV in this worksheet.
The decision-useful output is a dated map of priced variance, not a ranking of two percentages. Ask which window you actually need to understand, whether its residual survives clean inputs, and whether the instrument you plan to use really delivers that exposure.

728 RM B 7/F GEE LOK IND BLDG NO 34 HUNG TO RD KWUN TONG KLN HONG KONG





The risk of loss in trading financial instruments such as stocks, FX, commodities, futures, bonds, ETFs and crypto can be substantial. You may sustain a total loss of the funds that you deposit with your broker. Therefore, you should carefully consider whether such trading is suitable for you in light of your circumstances and financial resources.
No decision to invest should be made without thoroughly conducting due diligence by yourself or consulting with your financial advisors. Our web content might not suit you since we don't know your financial conditions and investment needs. Our financial information might have latency or contain inaccuracy, so you should be fully responsible for any of your trading and investment decisions. The company will not be responsible for your capital loss.
Without getting permission from the website, you are not allowed to copy the website's graphics, texts, or trademarks. Intellectual property rights in the content or data incorporated into this website belong to its providers and exchange merchants.
Not Logged In
Log in to access more features


Log In
Sign Up


