


- EURUSD
- XAUUSD
- XAGUSD
- WTI
- USDX


Markets
Analysis
User
24/7
Economic Calendar
Education
Data
- Names
- Latest
- Prev











Two portfolios can share the same VaR and have very different bad outcomes. Reproduce a 100-scenario example, handle fractional tail weights correctly, and test what a risk-limit pass really means.
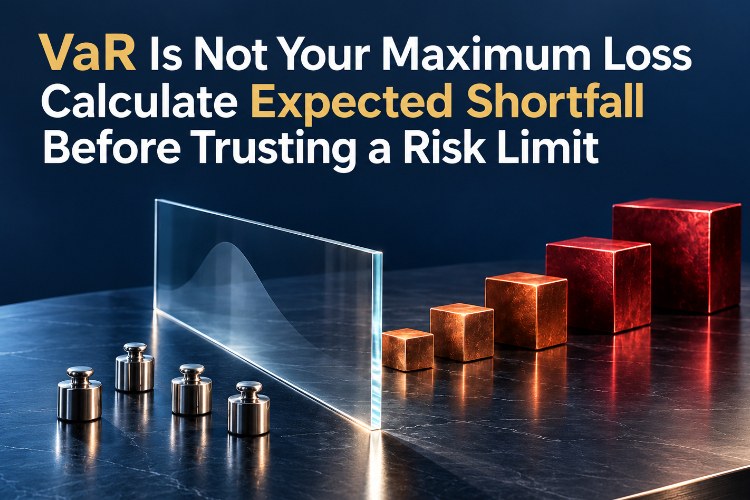
A risk report showing a one-day 95% value at risk of $2,000 does not say that tomorrow’s loss cannot exceed $2,000. It identifies a quantile of a specified loss distribution. The size of the losses beyond that boundary remains an open question. Expected shortfall, or ES, addresses that second question—but it is an average of the tail, not a guaranteed ceiling either.
VaR needs a horizon, confidence level, currency, position set and loss convention. Here losses are positive and profits negative. We use a fixed $100,000 portfolio and equally weighted one-day scenarios. A 95% VaR is the smallest loss threshold with at least 95% of the model’s probability at or below it. For 100 observations sorted from smallest loss to largest, our empirical convention selects observation 95. We do not interpolate between observations.
ES at the same confidence level averages the worst 5% of probability mass. It answers how severe that selected tail is on average. Changing the confidence level, holding period or sample weights changes the question; comparing a one-day 95% VaR with a ten-day 99% ES without adjustment is not a ranking of two portfolios’ safety. Nor does a 95% label give a 95% probability that the model itself is correct.
Build two hypothetical sets of 100 losses. In both, the first 90 sorted values are zero and observations 91–95 are $1,000, $1,200, $1,400, $1,600 and $2,000. Only the last five differ. These are constructed scenarios, not a market backtest.
| Sorted observation | Portfolio A loss ($) | Portfolio B loss ($) |
|---|---|---|
| 95 | 2000 | 2000 |
| 96 | 2100 | 2100 |
| 97 | 2200 | 2400 |
| 98 | 2300 | 3000 |
| 99 | 2400 | 5500 |
| 100 | 2500 | 12000 |
Both 95% VaRs equal $2,000. A’s 95% ES is (2100 + 2200 + 2300 + 2400 + 2500) / 5 = $2,300. B’s is (2100 + 2400 + 3000 + 5500 + 12000) / 5 = $5,000. A report showing only VaR hides this difference: 2% of starting portfolio value is the threshold for both, but the selected tail averages 2.3% for A and 5% for B.
B’s worst observed loss is $12,000, not $5,000. ES does not replace a worst-case scenario, and the sample maximum does not bound an unseen future shock. An average is useful precisely because it summarizes a set; that summary cannot tell you every outcome in the set.
The worst 2.5% of 100 equally weighted observations contains two whole observations and half the probability weight of the third. Under the stated quantile convention, B’s 97.5% VaR is observation 98, or $3,000. Its ES is:
(12000 + 5500 + 0.5 × 3000) / 2.5 = $7,600.
Averaging only losses strictly above $3,000 produces $8,750, but those two observations cover only 2% of probability. Including three whole observations covers 3%. Neither is the specified 2.5% tail. Fractional weight is an accounting of probability, not half an actual trading day. Ties at the threshold create a similar need to allocate only the required mass. Software defaults for sample quantiles may differ, so document the convention before blaming a discrepancy on bad data.
Suppose an internal policy sets same-horizon 95% limits of $2,500 for VaR and $4,000 for ES. Portfolio B passes the first test and fails the second. Neither test is contradictory: the limits govern different properties of the distribution. Do not overwrite the failed tail test with the passing quantile.
For a purely linear exposure, unchanged scenarios and no additional costs, scaling every position to 80% scales every modeled loss to 80%. B’s VaR would become $1,600, ES $4,000 and worst sample loss $9,600. That is a sensitivity calculation, not proof that an 80% position will be safe or executable. Options, market impact, financing and changed hedges require revaluation. A limit set exactly at an uncertain estimate also leaves no buffer for estimation error.
Historical simulation should apply past risk-factor moves to today’s fixed positions. An account’s realized daily P&L may instead reflect changing leverage, deposits, withdrawals and discretionary trades. Sorting that account history can answer a different question from repricing the current portfolio. Check corporate actions, stale quotes, missing data, currency conversion and whether fees are included before estimating anything.
One hundred scenarios leave only five observations in the 95% tail. A calm window can omit a crisis; adding more old observations can dilute a new volatility regime. Report sensitivity to windows and weighting, then add explicit gap, liquidity and correlation stresses outside the sample. A stop order does not guarantee the fill price after an overnight jump.
Do not automatically multiply a one-day risk number by the square root of ten. Exact quantile scaling needs a suitable model—for example independent, identically distributed normal increments with fixed linear exposure, stable volatility and the mean treated separately. Serial dependence, jumps and nonlinear payoffs break that shortcut.
Save the position snapshot, valuation method, scenario dates, weights and unit of loss. Sort the losses ascending, record the selected quantile rank, and average exactly the required upper-tail probability, using partial weight when needed. Reconcile the result to a second calculation before comparing it with limits written on the same basis.
Then monitor future, genuinely out-of-sample losses against forecasts made before those losses occurred. A correctly calibrated continuous 95% model implies an expected five exceedances in 100 independent observations—not exactly five on a timetable. Inspect clustering and loss severity as well as the count. The distinction between a sample estimate and reliable evidence is explained in how sample size changes confidence in an observed trading win rate.
The decision record should finish with three separate statements: whether the chosen limit passes, what the stress scenarios reveal, and which assumptions would invalidate the estimate. VaR locates a boundary; ES describes the tail beyond it. Neither makes the market stop there.

728 RM B 7/F GEE LOK IND BLDG NO 34 HUNG TO RD KWUN TONG KLN HONG KONG





The risk of loss in trading financial instruments such as stocks, FX, commodities, futures, bonds, ETFs and crypto can be substantial. You may sustain a total loss of the funds that you deposit with your broker. Therefore, you should carefully consider whether such trading is suitable for you in light of your circumstances and financial resources.
No decision to invest should be made without thoroughly conducting due diligence by yourself or consulting with your financial advisors. Our web content might not suit you since we don't know your financial conditions and investment needs. Our financial information might have latency or contain inaccuracy, so you should be fully responsible for any of your trading and investment decisions. The company will not be responsible for your capital loss.
Without getting permission from the website, you are not allowed to copy the website's graphics, texts, or trademarks. Intellectual property rights in the content or data incorporated into this website belong to its providers and exchange merchants.
Not Logged In
Log in to access more features


Log In
Sign Up


