


- USDX
- XAUUSD
- XAGUSD
- WTI


Markets
Analysis
User
24/7
Economic Calendar
Education
Data
- Names
- Latest
- Prev
















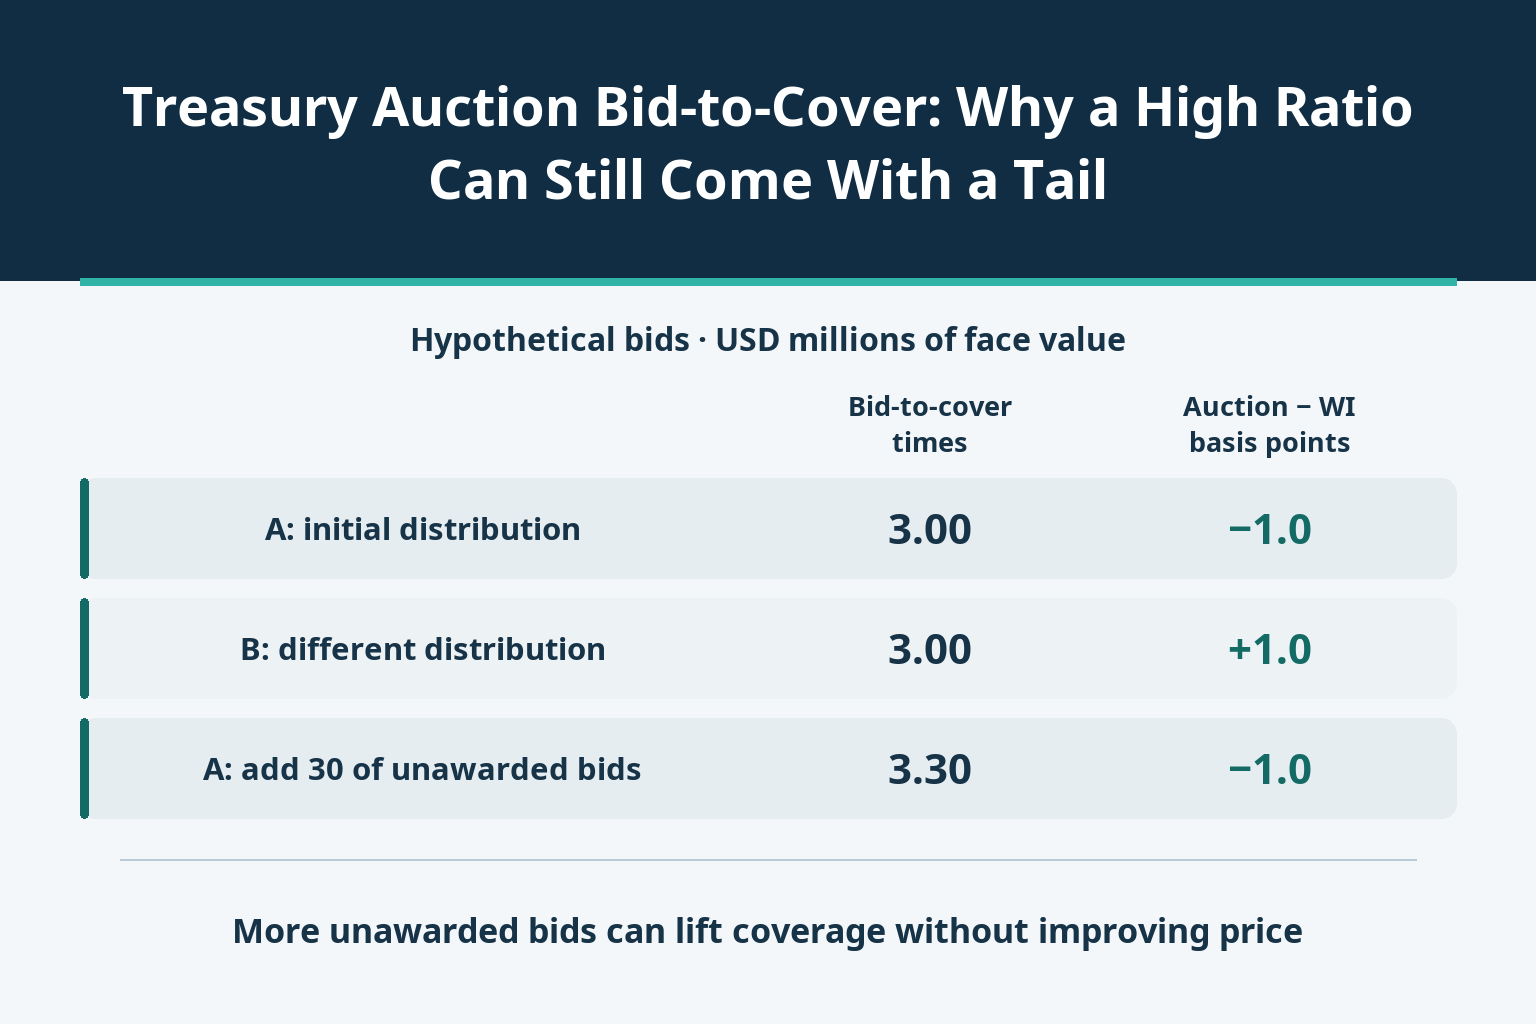
A high bid-to-cover ratio measures how much face value was bid, not how aggressively investors priced it. Two hypothetical Treasury auctions both attract three times their offering but finish on opposite sides of the same when-issued yield. Rebuild the allocations, the marginal percentage and the benchmark before calling an auction strong or weak.
A Treasury auction can receive bids for three times the amount awarded and still finish at a higher yield than the market reference just before the deadline. There is no contradiction: bid-to-cover measures quantity, while the auction's relative price depends on where those bids sit along the yield schedule. Reading the total without that distinction turns a coverage statistic into a signal it was never designed to provide.
This article concerns single-price auctions of nominal fixed-rate Treasury coupon securities. Bill discount rates, inflation-linked real yields and floating-rate discount margins are different quotation measures and should not be inserted into the same comparison.
Bid-to-cover equals total face value bid for divided by total face value awarded, excluding the Federal Reserve's System Open Market Account, or SOMA, from both amounts. It is not a ratio of cash payments. Ordinary noncompetitive bids and the foreign and international monetary authorities category, FIMA, are included where present. FIMA awards fall within the announced amount; SOMA awards are additional.
For an exact reconstruction, use the result's own footnote and awarded face value rather than a rounded headline offering amount. Primary dealer, direct and indirect categories are subdivisions of competitive bidding; adding them again double counts demand. An indirect bid is not, by itself, proof of a foreign ultimate owner.
Consider mutually exclusive hypothetical demand distributions A and B, not actual auction results or a forecast. Amounts below are millions of dollars of face value. Both offer 100, with ordinary noncompetitive bids of 3 and FIMA bids of 2 fully awarded. SOMA is zero, leaving 95 for competitive bidders.
Both receive 295 of valid competitive bids. Total public bids are therefore 295+3+2=300, and public awards are 95+3+2=100. Both bid-to-cover ratios are 3.00. Dividing 295 by 95 gives 3.1053, but that is a separately defined competitive-only coverage measure, not the reported-style total ratio.
| Yield bid | A bids | A awards | B bids | B awards |
|---|---|---|---|---|
| 4.000% | 60 | 60 | 20 | 20 |
| 4.020% | 70 | 35 | 45 | 45 |
| 4.040% | 80 | 0 | 50 | 30 |
| 4.060% | 85 | 0 | 180 | 0 |
| Competitive total | 295 | 95 | 295 | 95 |
Each tier shows the total bid amount at that yield and may include several independent bidders. All bidders have zero reportable net long positions. The amounts are divided into individual bids and awards below the 35% limit; a tier of 180 does not represent one oversized bidder. This construction tests the distribution of valid demand rather than manufacturing coverage with an inadmissible submission.
Competitive bids are awarded from the lowest yield upward after the noncompetitive allocation. In A, the first tier supplies 60 of the required 95. Another 35 is needed from the 70 bid at 4.020%, so that marginal tier receives 35/70=50.00%. The highest awarded yield is 4.020%.
In B, the first two tiers supply only 20+45=65. Another 30 must come from the 50 bid at 4.040%, producing a 60.00% marginal allocation and a higher cutoff yield. This percentage is remaining supply divided by bids at that tier. It is neither the tier's share of the whole issue nor total awards divided by all bids. These examples divide exactly, without allocation-rounding residuals.
Successful bidders receive the applicable uniform auction price, including noncompetitive bidders: the price corresponding to 4.020% in A and 4.040% in B. Lower-yield bids do not execute individually at their submitted yields. For comparable cash flows, bidding a lower yield expresses willingness to accept a higher price; it is not a promise that the bidder's own quoted yield becomes the settlement yield.
Now assume a when-issued, or WI, bid-side yield of 4.030% for the same security and settlement date at the competitive bidding cutoff. This is an explicit hypothetical benchmark, not something inferred from bid-to-cover. WI trading takes place after announcement but before issuance.
| Measure | A | B |
|---|---|---|
| Bid-to-cover ratio | 3.00 | 3.00 |
| Highest awarded yield | 4.020% | 4.040% |
| Assumed WI yield | 4.030% | 4.030% |
| Auction minus WI: basis points | −1.0 | +1.0 |
| Allocation at highest yield | 50.00% | 60.00% |
Define the tail as the highest awarded yield minus that WI yield. A gives (4.020−4.030)×100=−1 basis point: it stops through by one basis point. B gives +1 basis point: it tails by one. The inputs in that calculation are percentage yields, so multiplying their difference by 100 converts it to basis points. A 0.020 percentage-point yield difference is two basis points, not 0.02 basis points or 2%.
The decisive distinction is the amount available at the lower yields. Up to 4.020%, A has 130 of competitive bids against supply of 95; B has only 65. Both attract substantial total volume, but not the same volume willing to accept the earlier market yield. The ratio cannot recover that missing distribution.
Add one independent bidder's 30 to A at 4.060%. The extra bid receives no allocation. Public bids increase to 330 while awards remain 100, lifting coverage from 3.00 to 3.30. The cutoff remains 4.020%, and the result still stops through the assumed WI yield by one basis point.
This is a counterexample to the claim that a higher coverage ratio necessarily improves the auction price. It does not imply that real bids away from the cutoff are false, manipulative or irrational. They may express genuine price conditions that the final auction does not meet.
Historical comparisons also need a matching maturity, security type, new-issue or reopening status, and context for changing supply. There is no universal ratio above which every auction becomes strong.
A generic ten-year yield is not automatically the auctioned security's WI yield. Match the CUSIP, whether the auction is a new issue or reopening, settlement date, source, timestamp, time zone and quote side. A secondary-market bid-side yield is a different concept from a yield submitted by an auction bidder.
The Treasury's daily constant-maturity/par curve uses indicative observations around 15:30 Eastern time and interpolation. It cannot substitute for a same-security WI observation at the auction cutoff. Nor does a source using a different side or timestamp necessarily measure the same tail.
To see the sensitivity, keep a hypothetical auction yield of 4.040%. WI benchmarks of 4.030%, 4.035% and 4.040% produce tails of 1, 0.5 and zero basis points. These are alternative assumptions, not an observed bid–ask spread. If reference timing or rounding can alter the sign, a confident weak-auction label outruns the evidence.
Coupon, yield and cash price must also remain distinct. The cash-flow calculation behind yield to maturity explains why price comparisons require the same payment terms. A tail describes relative auction pricing, not the subsequent bond return or a guaranteed currency reaction.
The useful distinction is between willingness to participate and willingness to pay at a particular yield. Bid-to-cover informs the first question; the yield distribution, marginal allocation and a properly matched WI comparison resolve the second.

728 RM B 7/F GEE LOK IND BLDG NO 34 HUNG TO RD KWUN TONG KLN HONG KONG





The risk of loss in trading financial instruments such as stocks, FX, commodities, futures, bonds, ETFs and crypto can be substantial. You may sustain a total loss of the funds that you deposit with your broker. Therefore, you should carefully consider whether such trading is suitable for you in light of your circumstances and financial resources.
No decision to invest should be made without thoroughly conducting due diligence by yourself or consulting with your financial advisors. Our web content might not suit you since we don't know your financial conditions and investment needs. Our financial information might have latency or contain inaccuracy, so you should be fully responsible for any of your trading and investment decisions. The company will not be responsible for your capital loss.
Without getting permission from the website, you are not allowed to copy the website's graphics, texts, or trademarks. Intellectual property rights in the content or data incorporated into this website belong to its providers and exchange merchants.
Not Logged In
Log in to access more features


Log In
Sign Up


