


- USDX
- XAUUSD
- XAGUSD
- WTI


Markets
Analysis
User
24/7
Economic Calendar
Education
Data
- Names
- Latest
- Prev






Turn currency correlation and relative volatility into a dollar hedge ratio. Recalculate a 54,000-pound short and see when the same position adds to the risk of a euro long.
A short GBP/USD position can cushion a long EUR/USD position when the two pairs tend to move together. Its size depends on their relative volatility as well as their correlation. In the worked example, a GBP 54,000 short minimises the estimated variance of the combined position. Under a different correlation the very same short makes the euro exposure more volatile than leaving it alone.
Assume a linear position of EUR 100,000 at EUR/USD 1.2000. Its starting value is USD 120,000. Let h be the short GBP/USD dollar notional divided by USD 120,000. With simple returns rE and rG on the two pairs over the same interval, dollar profit and loss divided by USD 120,000 is rE − h × rG. The minus sign is the short exposure. This denominator is the initial euro leg, so the result measures the variability of the hedge per dollar of exposure. It does not measure return on margin or account equity.
Use synchronous price observations with USD as the quote currency for both pairs. Inverting a simple return r gives 1/(1+r) − 1, which generally differs from −r. For the mechanical cancellation of starting currency amounts, see how to add up the currency legs. That calculation answers a different question from estimating how much the two positions fluctuate together.
Use hypothetical daily standard deviations of 0.60% for EUR/USD and 0.80% for GBP/USD and correlation of 0.75. Expressed in squared percentage points, the variance of rE − h × rG is 0.36 + 0.64h² − 0.72h. The last term comes from twice the covariance, with a minus sign because sterling is sold. Minimising this quadratic gives h = 0.75 × 0.60 / 0.80 = 0.5625. The same answer comes from dividing the covariance of the two returns by the variance of the sterling return.
Multiply USD 120,000 by 0.5625 to get USD 67,500 of sterling exposure to sell. At GBP/USD 1.2500, that is GBP 54,000. Using the correlation itself as the hedge ratio would sell USD 90,000. Matching the dollar notionals would sell GBP 96,000. Neither operation accounts for the two volatilities in the same way.
| Position | GBP sold | Daily volatility |
|---|---|---|
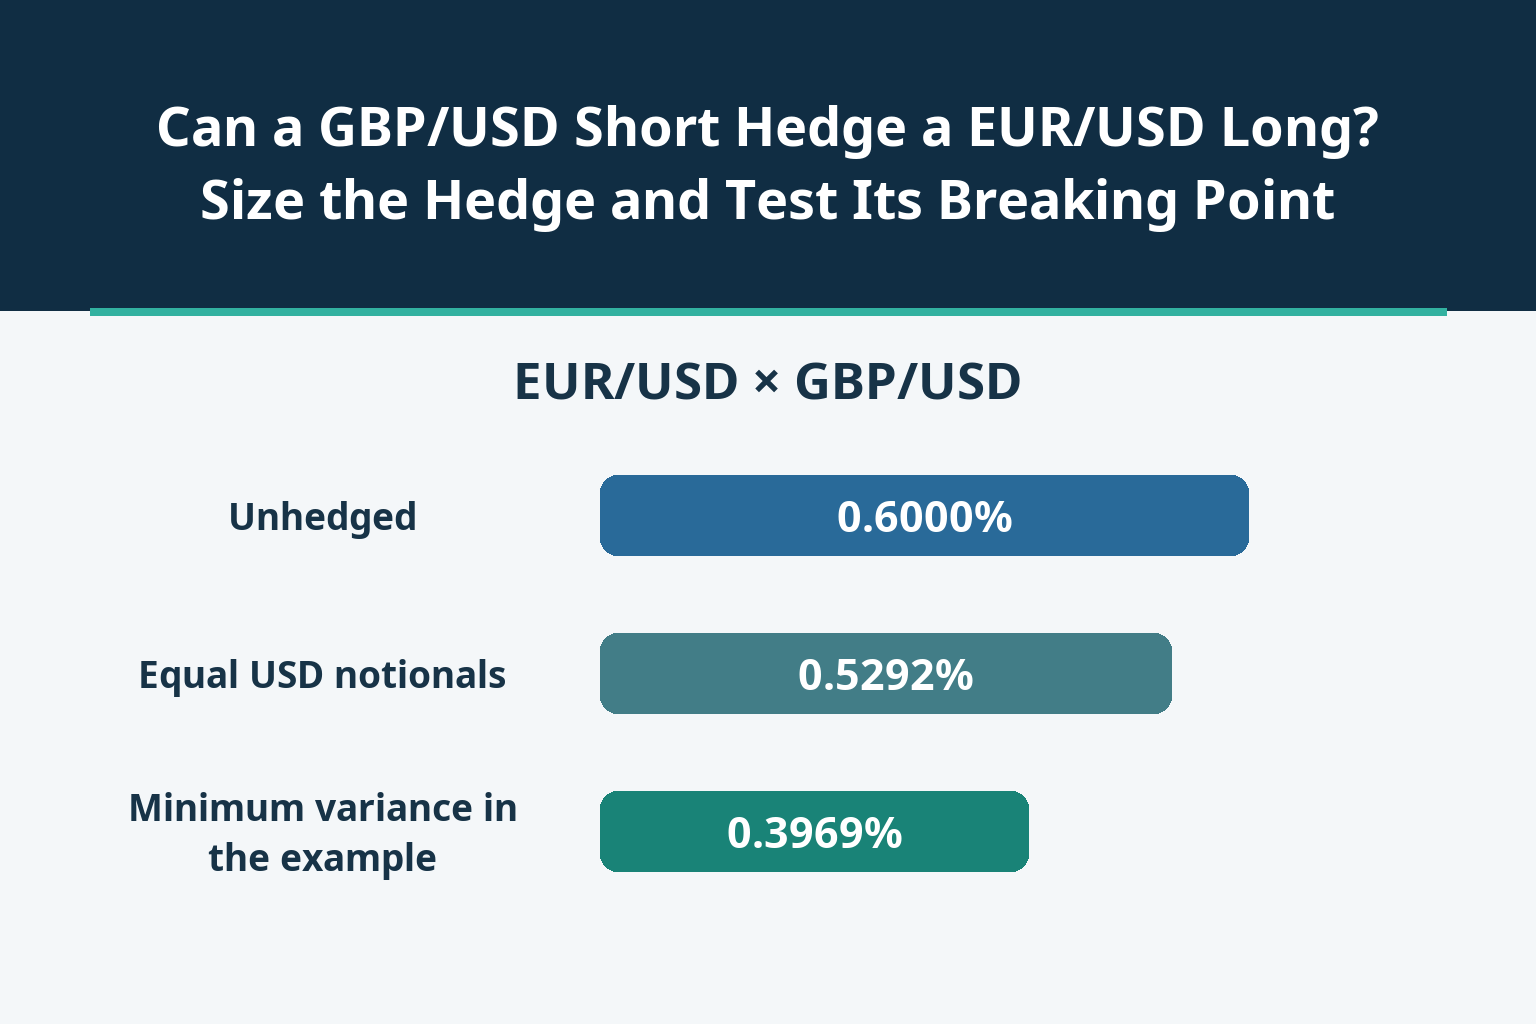
| Unhedged | 0 | 0.6000% |
| Equal USD notionals | 96,000 | 0.5292% |
| Minimum variance in the example | 54,000 | 0.3969% |
Keep both standard deviations and the GBP 54,000 short fixed. The hedge reduces variance only when correlation exceeds h × σG / (2 × σE), or 0.375 here. At exactly 0.375 the two variances are equal. If correlation turns to −0.25, the model produces 0.8352% daily volatility with the hedge, compared with 0.60% without it. This stress test keeps the original size because it asks what happens to a position that has already been put on.
On one hypothetical day, EUR/USD falls 1% while GBP/USD rises 0.5%. The EUR/USD leg loses USD 1,200 and the sterling short loses another USD 337.50, for a total loss of USD 1,537.50 before costs. A position with lower estimated variance can still lose more on a particular day. Spreads, fees, overnight financing and separately timed fills affect actual results.
The Federal Reserve H.10 series for the euro and British pound report New York noon buying rates in USD per unit. Use the 31 August quote as the starting observation and fit on the 15 matched returns through 22 September 2022. The sample correlation was 0.7683 and covariance divided by sterling return variance gave h = 0.8473. The 22 September rates were 0.9841 and 1.1269. For a EUR 100,000 long, the fitted short was about GBP 73,992, versus GBP 87,328 for equal dollar notionals. Keep those currency amounts fixed over the six subsequent observations, 23–30 September, beginning on the day the UK Growth Plan was published.
| Position | Daily P&L standard deviation (USD) | End-of-window P&L (USD) |
|---|---|---|
| Unhedged | 855 | −580 |
| Fitted hedge | 797 | 419 |
| Equal dollar notionals | 1,072 | 599 |
For each observation, multiply the EUR/USD price change by EUR 100,000 and subtract the GBP/USD price change times the pounds sold. On 23 September the two quotes fell to 0.9719 and 1.0921, so the fitted hedge turned a USD 1,220 loss into an indicative USD 1,355 gain. Over the six observations the equal-notional hedge finished with the highest gain, yet its daily P&L fluctuated more than the unhedged position. The fitted hedge reduced sample volatility by about 7%, much less than the reduction in the hypothetical example above. The rates are reference observations and the calculation omits spreads, financing and fees. Six observations around a selected shock show how the methods can diverge. To judge whether the reduction persists, use longer, nonoverlapping test windows and apply the same rules to quiet and stressed periods.
Align both return series to the same observation times and holding period. Exclude or explicitly flag missing observations instead of replacing a missing move with zero. Use the same sample for standard deviations and covariance. A constant proxy series gives zero variance and an undefined ratio.
Estimate the size in one window, freeze it, then compare realised dollar fluctuations in a later window against both an unhedged position and an equal-notional hedge. Recompute the threshold if the volatility ratio changes and test a joint adverse move separately. Check costs and the minimum tradable size before interpreting a small modelled improvement as an executable benefit.

728 RM B 7/F GEE LOK IND BLDG NO 34 HUNG TO RD KWUN TONG KLN HONG KONG


The risk of loss in trading financial instruments such as stocks, FX, commodities, futures, bonds, ETFs and crypto can be substantial. You may sustain a total loss of the funds that you deposit with your broker. Therefore, you should carefully consider whether such trading is suitable for you in light of your circumstances and financial resources.
No decision to invest should be made without thoroughly conducting due diligence by yourself or consulting with your financial advisors. Our web content might not suit you since we don't know your financial conditions and investment needs. Our financial information might have latency or contain inaccuracy, so you should be fully responsible for any of your trading and investment decisions. The company will not be responsible for your capital loss.
Without getting permission from the website, you are not allowed to copy the website's graphics, texts, or trademarks. Intellectual property rights in the content or data incorporated into this website belong to its providers and exchange merchants.
Not Logged In
Log in to access more features


Log In
Sign Up


