


- XAUUSD
- XAGUSD
- WTI
- USDX


Markets
Analysis
User
24/7
Economic Calendar
Education
Data
- Names
- Latest
- Prev











A fixed sterling profit on EUR/GBP can have a changing dollar value. Separate trade P/L from account-currency conversion, reconcile an apparent contradiction, and check why a take-profit price does not necessarily lock in a dollar amount.
The currency pair on a chart and the currency used to display its profit need not be the same. A EUR/GBP position can show an unchanged sterling gain while its dollar account value falls. The first check is not whether the chart looks flat, but whether the position’s price-based P/L and the rate used to express that P/L in dollars have both stayed constant.
The distinction can also explain a less intuitive result: the trade earns another £10, yet its dollar floating profit falls from $260 to $252. That is a reduction in a still-positive profit, not a new $8 trading loss. A fixed-position example lets us separate the two effects, calculate a conditional dollar target, and distinguish an open valuation from cash that has already been converted and booked.
Assume a linear long position of N = 10,000 euros in EUR/GBP. Its actual entry fill is K = 0.8500 pounds per euro, the ask paid to buy. Let S be the current bid used to value the long position. Its sterling price-based P/L is G = N(S−K): euros multiplied by pounds per euro gives pounds. This model concerns one position’s price difference, not the value of all cash assets and funding legs in a deliverable currency transaction.
The hypothetical account reports in dollars. Let c be its confirmed effective conversion factor for this positive sterling P/L, measured in dollars per pound, with c > 0. The dollar value is A = Gc. A conversion factor is an input to this account’s valuation model, not necessarily a cash-exchange quote available to the customer. Confirm the product’s profit currency and calculation method; neither its margin currency nor a similar-looking chart settles that question.
In this example, one EUR/GBP pip is 0.0001 pound per euro, so a pip is £1 for the fixed 10,000-euro position. A move from 0.8500 to 0.8700 is 200 pips and produces £200, not automatically $200, 200% or 200 return basis points. NSc is a converted notional value, not the trade’s profit. With no starting account equity specified, none of these amounts supplies an account return percentage or a leverage return.
The example has no separate commissions, financing, tax, slippage or additional conversion charge. Entry already uses the paid ask and the mark uses the bid; deducting the same estimated spread again would count it twice. A real calculation must follow its own contract, price side, timing and fee definitions rather than borrowing these assumptions unnoticed.
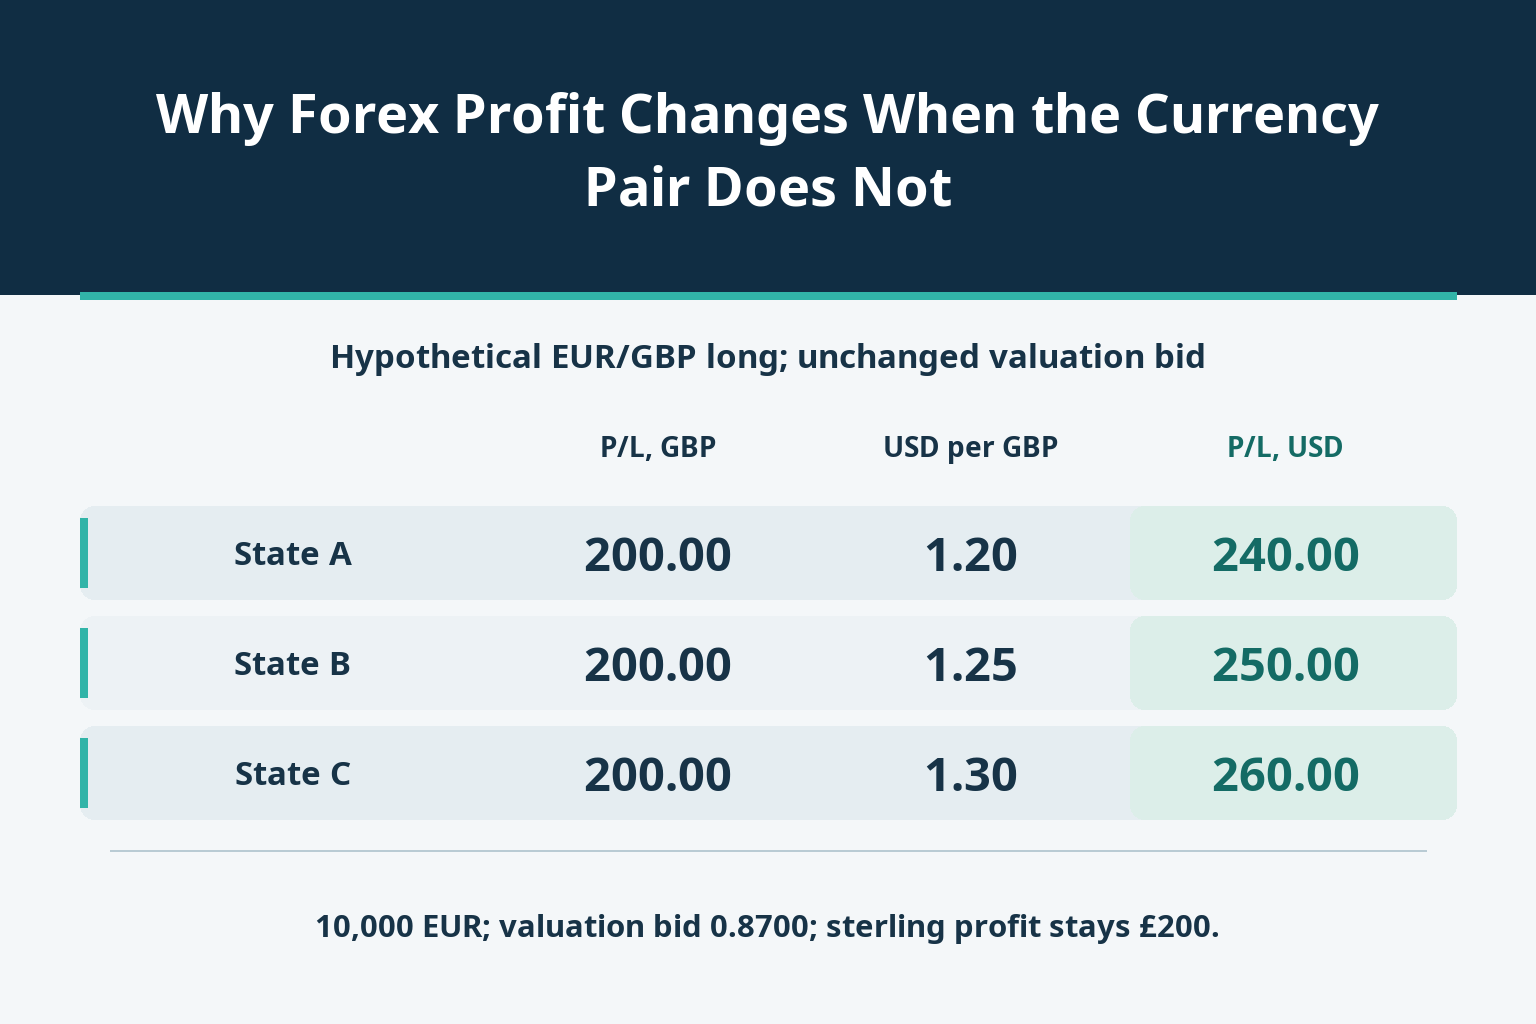
Hold the quantity, entry and valuation bid S = 0.8700 fixed. Sterling floating profit is then 10,000 × (0.8700−0.8500) = £200. The three rows are separate hypothetical valuation states; only the effective pound-to-dollar factor changes.
| Separate state | EUR/GBP valuation bid | P/L, GBP | Conversion, USD/GBP | P/L, USD |
|---|---|---|---|---|
| A | 0.8700 | 200.00 | 1.20 | 240.00 |
| B | 0.8700 | 200.00 | 1.25 | 250.00 |
| C | 0.8700 | 200.00 | 1.30 | 260.00 |
Moving from state C to state A reduces the displayed dollar profit from $260 to $240. The sterling profit and the EUR/GBP bid have not changed. The $20 difference is the change in the converted value of that existing profit, not a second loss to subtract from the new $240. Holding EUR/GBP constant while the pound-to-dollar factor changes does not also imply that EUR/USD is unchanged.
There is a useful sign check. At S = K, G is zero and multiplying by any positive c still gives zero, before costs. If profit currency and account currency coincide, c = 1 and this third-currency conversion channel disappears. More generally, a positive conversion factor preserves the sign of G; a smaller dollar gain does not turn a positive sterling price-based profit into a negative dollar one.
The loss branch may use a different factor. As a separate example, S = 0.8300 gives G = −£200. If the specified loss factors are 1.2002 and 1.3002 dollars per pound, the values are −$240.04 and −$260.04. These are assumed factors, not a rule that every provider uses the same bid, ask or 0.0002 adjustment. Establish the applicable rule for the sign and conversion direction before using it.
Now use one common baseline: S₀ = 0.8700, G₀ = £200, c₀ = 1.30 and A₀ = $260. Each later row changes one or both inputs relative to that baseline. The rows are not a sequence of trades.
| Compared with one baseline | Bid, GBP/EUR | P/L, GBP | Factor, USD/GBP | P/L, USD | Change, USD |
|---|---|---|---|---|---|
| Baseline | 0.8700 | 200.00 | 1.30 | 260.00 | 0.00 |
| Only EUR/GBP rises | 0.8710 | 210.00 | 1.30 | 273.00 | +13.00 |
| Only conversion falls | 0.8700 | 200.00 | 1.20 | 240.00 | −20.00 |
| Both change | 0.8710 | 210.00 | 1.20 | 252.00 | −8.00 |
In the last row, EUR/GBP rises another 10 pips and sterling profit increases to £210. But the effective conversion factor falls to 1.20, leaving $252 rather than $260. The position remains profitable in both currencies. The observation is not, on its own, evidence that the account calculation is wrong; the conversion change can outweigh the extra sterling gain.
The exact reconciliation is ΔA = c₀ΔG + G₀Δc + ΔGΔc. Here it is 1.30 × 10 + 200 × (−0.10) + 10 × (−0.10) = 13−20−1 = −$8. Adding only the first two terms produces −$7 and misses the interaction. Alternatively, using the final factor for the price change gives c₁ΔG + G₀Δc = 12−20 = −$8. Both reconcile the amount; they allocate the effects differently.
This is an identity for monetary P/L, not a decomposition of the whole account’s investment return. If a position crosses from profit to loss and the conversion rule changes with the sign, determine the correct factor at each observation. A factor confirmed for positive P/L must not silently carry over to negative P/L.
For a positive target T in dollars, with this fixed position and a specified future positive-P/L factor c, the model requires S_target = K + T/(Nc). The units matter: dollars divided by (euros × dollars per pound) gives pounds per euro. The target concerns the chosen valuation model before separate costs, not a promise of an eventual cash receipt.
For T = $250 and c = 1.20, the required bid is 0.8500 + 250/(10,000 × 1.20) = 0.870833333…. Suppose this contract’s permitted price grid is 0.00001. A bid of 0.87083 gives £208.30 × 1.20 = $249.96, four cents short. The next grid price, 0.87084, gives £208.40 × 1.20 = $250.08. It is the first grid value meeting the target under these frozen assumptions, not a guaranteed fill or minimum payout.
The future conversion factor is the unresolved input. If the position instead closes at the same 0.87084 but the applicable factor is 1.10, £208.40 becomes $229.24. A fixed EUR/GBP exit price has not fixed the dollar profit. Nor does the number of decimals displayed on a screen necessarily establish the contract’s permitted price increment or the account’s monetary rounding rule.
Before reverse-calculating a target, establish whether it means gross floating P/L, net realized P/L or the final account credit. Confirm the position’s units, the relevant entry and exit sides, price grid, monetary precision and treatment of conversion and other costs. A current estimate can be internally correct without committing the provider to the same factor when the position closes.
Suppose a trade has closed and its £200 profit has actually been converted at 1.30 and fixed in the dollar ledger as $260. With no subsequent correction, charge or new transaction, a later factor of 1.20 does not rewrite that booked dollar amount as $240. Applying a current rate to an already-fixed dollar entry creates a reconciliation error rather than explaining one.
A different product may permit the £200 to remain as an actual sterling cash balance. Its later dollar reporting value can change, but that is subsequent exposure on the foreign-currency balance. It cannot simultaneously be described as cash already exchanged into a fixed $260. Do not assume every account offers foreign-currency sub-balances, or that the act of closing a trade proves conversion has finished.
Read the statement fields separately. The factor used for unrealized P/L, the one used to display a position’s notional value, and the one used for cash settlement need not be identical. A reported realized amount may already include a conversion adjustment while commissions or financing appear elsewhere. Reconcile each charge once; a displayed breakdown is not an instruction to deduct an included cost again.
Save observations at matching times: trade identifier, direction, base-currency quantity, actual entry, current mark or final exit, and the meaning of that price side. A flat midpoint chart does not prove that the bid used for a long position’s valuation is unchanged. Partial closes, quantity changes and different timestamps can also invalidate a comparison that appears to hold the trade constant.
Next confirm the profit currency and linear calculation method, then recompute G. Obtain the effective conversion factor actually used for this amount, with its units, timing and positive- or negative-P/L rule. If the displayed quote runs the other way, consult checking inverse exchange rates and the correct conversion price side before taking a reciprocal; mechanically inverting the wrong side does not establish the account’s factor. Do not substitute an unrelated chart midpoint merely because its currency symbols look right.
Calculate A = Gc, then reconcile separate fees, financing, transfers and booked versus unbooked amounts according to their field definitions. If G is unchanged, G times the factor change should explain the corresponding difference in this model. If it does not, investigate price side, quantity, timing, conversion adjustments and rounding rather than forcing the remainder into a supposed exchange-rate loss.
Without the original conversion input or an equivalent statement reconciliation, leave the cause unresolved. The useful conclusion is conditional and testable: a change in account-currency P/L is consistent with conversion only when the same position’s native-currency result, the correct factor and the ledger timing account for it. A matching chart alone cannot confirm or refute that explanation.

728 RM B 7/F GEE LOK IND BLDG NO 34 HUNG TO RD KWUN TONG KLN HONG KONG


The risk of loss in trading financial instruments such as stocks, FX, commodities, futures, bonds, ETFs and crypto can be substantial. You may sustain a total loss of the funds that you deposit with your broker. Therefore, you should carefully consider whether such trading is suitable for you in light of your circumstances and financial resources.
No decision to invest should be made without thoroughly conducting due diligence by yourself or consulting with your financial advisors. Our web content might not suit you since we don't know your financial conditions and investment needs. Our financial information might have latency or contain inaccuracy, so you should be fully responsible for any of your trading and investment decisions. The company will not be responsible for your capital loss.
Without getting permission from the website, you are not allowed to copy the website's graphics, texts, or trademarks. Intellectual property rights in the content or data incorporated into this website belong to its providers and exchange merchants.
Not Logged In
Log in to access more features


Log In
Sign Up


