• Trade
  • Markets
  • Copy
  • Contests
  • 24/7
  • Calendar
  • Q&A
  • Chats
Screeners
SYMBOL
LAST
BID
ASK
HIGH
LOW
NET CHG.
%CHG.
SPREAD
SOURCE
SPX
S&P 500 Index
7623.68
7623.68
7623.68
7660.15
7612.07
-39.75
-0.52%
--
--
DJI
Dow Jones Industrial Average
52215.16
52215.16
52215.16
52696.70
52055.10
-652.82
-1.23%
--
--
IXIC
NASDAQ Composite Index
25955.33
25955.33
25955.33
26111.62
25866.15
-53.52
-0.21%
--
--
USDX
US Dollar Index
101.688
101.688
101.768
101.742
101.383
+0.068
+ 0.07%
--
--
EURUSD
Euro / US Dollar
1.11892
1.11892
1.11900
1.12262
1.11870
-0.00121
-0.11%
--
--
GBPUSD
Pound Sterling / US Dollar
1.33560
1.33560
1.33573
1.33870
1.33416
-0.00151
-0.11%
--
--
XAUUSD
Gold / US Dollar
4016.97
4016.97
4017.38
4025.37
3977.99
+20.69
+ 0.52%
--
--
WTI
Light Sweet Crude Oil
100.614
100.614
100.644
101.740
99.966
-2.142
-2.08%
--
--

Community Accounts

Signal Accounts
--
Profit Accounts
--
Loss Accounts
--
View More

Become a signal provider

Sell trading signals to earn additional income

View More

Guide to Copy Trading

Get started with ease and confidence

View More

Signal Accounts for Members

All Signal Accounts

Best Return
  • Best Return
  • Best P/L
  • Best MDD
Past 1W
  • Past 1W
  • Past 1M
  • Past 1Y

All Contests

  • All
  • Recommend
  • Stocks
  • Cryptocurrencies
  • Central Banks
  • Trump Updates
  • Featured News
Top News Only
Share

The U.S. Midterm Elections Will Be Held On November 3

Share

US Raw Sugar Fell More Than 4.00% Intraday, Currently Trading At 19.22 Cents Per Pound

Share

Strategy Holds Approximately 848,517 Bitcoins, With An Average Cost Of $75,446 Per Bitcoin

Share

Spokesperson For The Chinese Embassy In The UK: The Root Cause Of The Predicament Of European Industries Lies In Their Own Structural Problems

Share

A Spokesperson For The Chinese Embassy In The UK Answered A Reporter's Question Regarding Some Media Reports That Claimed "the Rise Of China's Manufacturing Industry Has Impacted Western High-end Industries."

Share

The Saudi Capital Markets Authority Has Approved The Merger Of UBS Saudi Arabia Into Credit Suisse Saudi Arabia

Share

Brazil's January 2035 Yield Contract Jumped 263 Basis Points To 15.375% After President Lula's Election Victory

Share

The U.S. Democratic Party Is Demanding That Banks And Ports Retain Records Related To U.S.-Russia Diesel Transactions

Share

Data Shows That The Russian Central Bank Has Reduced Its Gold Reserves By About 62 Tons This Year, And Kazakhstan Plans To Reduce The Proportion Of Gold In Its Total Reserves To 75% By The End Of The Year

Share

According To Media Reports, Banks Have Been Urged To Retain Records Related To Russian Diesel Fuel

Share

Following President Lula's Re-election, The Brazilian Real Depreciated By 12.2% Against The US Dollar In Spot Trading

Share

The Brazilian Real Plunged 8.2% In Spot Trading To 5.42 Reais To The Dollar After The Market Opened

Share

JPMorgan Chase Has Lowered Its Forecast For The Brazilian Real

Share

U.S. Natural Gas Futures Extended Their Losses, Falling 5% To Their Lowest Level Since April 2026 Due To Rising Production And Anticipated Lower Demand

Share

The EU Has Accepted The Rectification Plan Of Cross-border E-commerce Platform Temu

Share

Brazil's B3 Exchange Has Adjusted The Upper Limit Of The Fluctuation Range For Foreign Exchange Trading To 12%

Share

The Reserve Bank Of India (RBI) Stated That No Customers Suffered Financial Losses. Remedial Measures Have Been Taken

Share

The Reserve Bank Of India (RBI) Has Reported A Technical Malfunction In The Localized RTGS Server Interface Environment It Maintains

Share

The Ukrainian Parliament Has Approved An Extension Of The State Of War

Share

The Documents Show That Strategy Did Not Make Any New Bitcoin Purchases In The Past Week

TIME
ACT
FCST
PREV
IMPACT
Germany Services PMI Prelim (SA) (Oct)

A:--

F: --

P: --

EURUSD
  • EURUSD
  • XAUUSD
  • XAGUSD
  • WTI
  • USDX
Germany Composite PMI Prelim (SA) (Oct)

A:--

F: --

P: --

EURUSD
  • EURUSD
  • XAUUSD
  • XAGUSD
  • WTI
  • USDX
Euro Zone Composite PMI Prelim (SA) (Oct)

A:--

F: --

P: --

EURUSD
  • EURUSD
  • XAUUSD
  • XAGUSD
  • WTI
  • USDX
Euro Zone Manufacturing PMI Prelim (SA) (Oct)

A:--

F: --

P: --

EURUSD
  • EURUSD
  • XAUUSD
  • XAGUSD
  • WTI
  • USDX
Euro Zone Services PMI Prelim (SA) (Oct)

A:--

F: --

P: --

EURUSD
  • EURUSD
  • XAUUSD
  • XAGUSD
  • WTI
  • USDX
U.K. Manufacturing PMI Prelim (Oct)

A:--

F: --

P: --

GBPUSD
  • GBPUSD
  • XAUUSD
  • XAGUSD
  • WTI
  • USDX
U.K. Services PMI Prelim (Oct)

A:--

F: --

P: --

GBPUSD
  • GBPUSD
  • XAUUSD
  • XAGUSD
  • WTI
  • USDX
U.K. Composite PMI Prelim (Oct)

A:--

F: --

P: --

GBPUSD
  • GBPUSD
  • XAUUSD
  • XAGUSD
  • WTI
  • USDX
Russia Key Rate

A:--

F: --

P: --

WTI
  • WTI
  • XAUUSD
  • XAGUSD
  • USDX
India Deposit Gowth YoY

A:--

F: --

P: --

XAUUSD
  • XAUUSD
  • XAGUSD
  • WTI
  • USDX
Mexico Economic Activity Index YoY (Aug)

A:--

F: --

P: --

XAUUSD
  • XAUUSD
  • XAGUSD
  • WTI
  • USDX
Canada Retail Sales MoM (SA) (Aug)

A:--

F: --

P: --
USDCAD
  • USDCAD
  • XAUUSD
  • XAGUSD
  • WTI
  • USDX
Canada Core Retail Sales MoM (SA) (Aug)

A:--

F: --

P: --
USDCAD
  • USDCAD
  • XAUUSD
  • XAGUSD
  • WTI
  • USDX
U.S. IHS Markit Services PMI Prelim (SA) (Oct)

A:--

F: --

P: --

USDX
  • USDX
  • XAUUSD
  • XAGUSD
  • WTI
U.S. IHS Markit Composite PMI Prelim (SA) (Oct)

A:--

F: --

P: --

USDX
  • USDX
  • XAUUSD
  • XAGUSD
  • WTI
U.S. IHS Markit Manufacturing PMI Prelim (SA) (Oct)

A:--

F: --

P: --

USDX
  • USDX
  • XAUUSD
  • XAGUSD
  • WTI
U.S. UMich Consumer Expectations Index Final (Oct)

A:--

F: --

P: --

USDX
  • USDX
  • XAUUSD
  • XAGUSD
  • WTI
U.S. UMich Consumer Sentiment Index Final (Oct)

A:--

F: --

P: --

USDX
  • USDX
  • XAUUSD
  • XAGUSD
  • WTI
U.S. UMich 1-Year-Ahead Inflation Expectations Final (Oct)

A:--

F: --

P: --

USDX
  • USDX
  • XAUUSD
  • XAGUSD
  • WTI
U.S. UMich Current Economic Conditions Index Final (Oct)

A:--

F: --

P: --

USDX
  • USDX
  • XAUUSD
  • XAGUSD
  • WTI
U.S. Weekly Total Oil Rig Count

A:--

F: --

P: --

WTI
  • WTI
  • XAUUSD
  • XAGUSD
  • USDX
U.S. Weekly Total Rig Count

A:--

F: --

P: --

WTI
  • WTI
  • XAUUSD
  • XAGUSD
  • USDX
US President Trump delivered a speech
Germany IFO Business Climate Index (SA) (Oct)

A:--

F: --

P: --

EURUSD
  • EURUSD
  • XAUUSD
  • XAGUSD
  • WTI
  • USDX
Germany Ifo Current Business Situation Index (SA) (Oct)

A:--

F: --

P: --

EURUSD
  • EURUSD
  • XAUUSD
  • XAGUSD
  • WTI
  • USDX
Germany Ifo Business Expectations Index (SA) (Oct)

A:--

F: --

P: --

EURUSD
  • EURUSD
  • XAUUSD
  • XAGUSD
  • WTI
  • USDX
U.K. CBI Retail Sales Expectations Index (Oct)

A:--

F: --

P: --

GBPUSD
  • GBPUSD
  • XAUUSD
  • XAGUSD
  • WTI
  • USDX
U.K. CBI Distributive Trades (Oct)

A:--

F: --

P: --

GBPUSD
  • GBPUSD
  • XAUUSD
  • XAGUSD
  • WTI
  • USDX
Brazil Current Account (Sept)

A:--

F: --

P: --

XAUUSD
  • XAUUSD
  • XAGUSD
  • WTI
  • USDX
Canada National Economic Confidence Index

A:--

F: --

P: --

USDCAD
  • USDCAD
  • XAUUSD
  • XAGUSD
  • WTI
  • USDX
U.S. Chicago Fed National Activity Index (Sept)

A:--

F: --

P: --

USDX
  • USDX
  • XAUUSD
  • XAGUSD
  • WTI
U.S. Dallas Fed New Orders Index (Oct)

--

F: --

P: --

U.S. Dallas Fed General Business Activity Index (Oct)

--

F: --

P: --

U.S. 2-Year Note Auction Avg. Yield

--

F: --

P: --

South Korea GDP Prelim QoQ (SA) (Q3)

--

F: --

P: --

U.K. BRC Shop Price Index YoY (Oct)

--

F: --

P: --

China, Mainland Industrial Profit YoY (YTD) (Sept)

--

F: --

P: --

Euro Zone M3 Money Supply YoY (Sept)

--

F: --

P: --

Euro Zone 3-Month M3 Money Supply YoY (Sept)

--

F: --

P: --

Euro Zone Private Sector Credit YoY (Sept)

--

F: --

P: --

Germany 2-Year Schatz Auction Avg. Yield

--

F: --

P: --

Brazil Current Account (Sept)

--

F: --

P: --

Mexico Trade Balance (Sept)

--

F: --

P: --

Brazil PPI MoM (Sept)

--

F: --

P: --

U.S. Durable Goods Orders MoM (Excl. Defense) (SA) (Sept)

--

F: --

P: --

U.S. Non-Defense Capital Durable Goods Orders MoM (Excl. Aircraft) (Sept)

--

F: --

P: --

U.S. Durable Goods Orders MoM (Excl.Transport) (Sept)

--

F: --

P: --

U.S. Durable Goods Orders MoM (Sept)

--

F: --

P: --

U.S. Weekly Redbook Index YoY

--

F: --

P: --

U.S. S&P/CS 20-City Home Price Index (Not SA) (Aug)

--

F: --

P: --

U.S. S&P/CS 10-City Home Price Index MoM (Not SA) (Aug)

--

F: --

P: --

U.S. FHFA House Price Index (Aug)

--

F: --

P: --

U.S. FHFA House Price Index YoY (Aug)

--

F: --

P: --

U.S. S&P/CS 10-City Home Price Index YoY (Aug)

--

F: --

P: --

U.S. S&P/CS 20-City Home Price Index MoM (SA) (Aug)

--

F: --

P: --

U.S. S&P/CS 20-City Home Price Index YoY (Not SA) (Aug)

--

F: --

P: --

U.S. FHFA House Price Index MoM (Aug)

--

F: --

P: --

U.S. S&P/CS 20-City Home Price Index MoM (Not SA) (Aug)

--

F: --

P: --

U.S. Conference Board Consumer Confidence Index (Oct)

--

F: --

P: --

U.S. Annual Total New Home Sales (Sept)

--

F: --

P: --

U.S. Richmond Fed Manufacturing Composite Index (Oct)

--

F: --

P: --

Q&A with Experts
    • All
    • Chatrooms
    • Groups
    • Friends
    Faburama Bojang flag
    SlowBear ⛅
    @Faburama BojangYou wiush to sell Gold again? what is the price target this time around?
    @SlowBear ⛅ 4021 if the first candle closed with the wick then I will sell with the seconde candle
    Skylark flag
    Okpodi luc
    @Skylark
    @Okpodi luc Hey there bro Good afternoon to you hope you're doing good?
    Faburama Bojang flag
    Skylark
    @Faburama BojangYou're really giving it here to the market today as I can see 👀 anyways congratulations bro
    @Skylark Thank you my boss, I am just following my plans lol
    SlowBear ⛅ flag
    Faburama Bojang
    @SlowBear ⛅ It is very good Strategy for sure
    @Faburama Bojang Yes it is startiing to look like a really smooth startegy you know
    SlowBear ⛅ flag
    Faburama Bojang
    @SlowBear ⛅ 4021 if the first candle closed with the wick then I will sell with the seconde candle
    @Faburama Bojang Oh wow, i think i might hve to read deeper into that startegy
    Skylark flag
    Okpodi luc
    @Skylark
    @Okpodi luc Happy new week and welcome to you. so tell me what's up with the market on your end?
    EuroTrader flag
    Phantom of the Pits Enthusiast
    @EuroTraderSometimes you need to get the math right otherswise you may end up losing even though the winners outnumber the loosers
    @Phantom of the Pits Enthusiastexactrly, thats how the markets really is because there is a real chance that we might take losses before the winners come along
    Skylark flag
    Skylark
    @Okpodi luc Happy new week and welcome to you. so tell me what's up with the market on your end?
    @Okpodi luc Are you currently holding a position on any assets or just observing the market
    SlowBear ⛅ flag
    Faburama Bojang
    @SlowBear ⛅ 4021 if the first candle closed with the wick then I will sell with the seconde candle
    @Faburama BojangBut wait, what timeframe is best for this new startegy?
    Faburama Bojang flag
    SlowBear ⛅
    @Faburama Bojang Yes it is startiing to look like a really smooth startegy you know
    @SlowBear ⛅ Yeah it is a very smooth one, I have spent the whole day Yesterday studying and modifying the strategy
    Skylark flag
    Faburama Bojang
    @Skylark Thank you my boss, I am just following my plans lol
    @Faburama BojangYes bro you know in everything you do in life you've got to plan and follow you plan to come out right
    Areeba Mini❣️❣️ flag
    SlowBear ⛅
    @Areeba Mini❣️❣️Really interesting seeing you sell and buy on another account
    @SlowBear ⛅Thanks friend ☺️
    Faburama Bojang flag
    SlowBear ⛅
    @Faburama Bojang Oh wow, i think i might hve to read deeper into that startegy
    @SlowBear ⛅ Yeah, it is actually deep, The wick, Base and The Joint
    Faburama Bojang flag
    SlowBear ⛅
    @Faburama BojangBut wait, what timeframe is best for this new startegy?
    @SlowBear ⛅ All Time Frame but 1hr is the best
    Skylark flag
    Faburama Bojang
    @Skylark Thank you my boss, I am just following my plans lol
    @Faburama Bojangany trader who does analysis the market and market plans for the day is actually wasting his or her time
    Okpodi luc flag
    Skylark
    @Okpodi luc Are you currently holding a position on any assets or just observing the market
    @Skylarkentered a Gu buy 25mins ago low as my sl and usdjpy sell , high as my stoploss, but I m actually waiting/observing, the real trades has not come
    SlowBear ⛅ flag
    Faburama Bojang
    @SlowBear ⛅ Yeah it is a very smooth one, I have spent the whole day Yesterday studying and modifying the strategy
    @Faburama Bojang Oh wow, so building a strategyu like this only cost you 24hrs? that is wild
    SlowBear ⛅ flag
    Areeba Mini❣️❣️
    @SlowBear ⛅Thanks friend ☺️
    @Areeba Mini❣️❣️You are welcome friend, what is your bias on BTCUSD today?
    Faburama Bojang flag
    Skylark
    @Faburama BojangYes bro you know in everything you do in life you've got to plan and follow you plan to come out right
    @Skylark Yeah for sure, even if the plan doesn't work at least you have followed the plan, that is the best for it
    SlowBear ⛅ flag
    Faburama Bojang
    @SlowBear ⛅ All Time Frame but 1hr is the best
    @Faburama Bojang Oh 1Hr is the best i see, i will keep an eye on wht timeframe then
    Type here...
    Add Symbol or Code

      No matching data

      All
      Recommend
      Stocks
      Cryptocurrencies
      Central Banks
      Trump Updates
      Featured News
      • All
      • Russia-Ukraine Conflict
      • Middle East Flashpoint
      • All
      • Russia-Ukraine Conflict
      • Middle East Flashpoint
      Search
      Products

      Charts Free Forever

      Chats Q&A with Experts
      Screeners Economic Calendar Data Tools
      Membership Features
      Data Warehouse Market Trends Institutional Data Policy Rates Macro

      Market Trends

      Market Sentiment Order Book Forex Correlations

      Top Indicators

      Charts Free Forever
      Markets

      News

      24/7 Analysis Education

      Latest Views

      Latest Update

      Signals

      Copy Rankings Latest Signals Become a signal provider AI Rating
      Contests
      Brokers

      Overview Brokers Assessment Rankings Regulators News Claims
      Broker listing Forex Brokers Comparison Tool Live Spread Comparison Scam
      Q&A Complaint Scam Alert Videos Tips to Detect Scam
      More

      Business
      Events
      Careers About Us Advertising Help Center

      White Label

      Broker API

      Data API

      Web Plug-ins

      Affiliate Program

      Awards Institution Evaluation IB Seminar Salon Event Exhibition
      Vietnam Thailand Singapore Dubai
      Fans Party Investment Sharing Session
      FastBull Summit BrokersView Expo
      Recent Searches
        Top Searches
          Markets
          Analysis
          User
          24/7
          Economic Calendar
          Education
          Data
          • Names
          • Latest
          • Prev

          View All

          No data

          Scan to Download

          Faster Charts, Chat Faster!

          Download
          English
          • English
          • Español
          • العربية
          • Bahasa Indonesia
          • Bahasa Melayu
          • Tiếng Việt
          • ภาษาไทย
          • Français
          • Italiano
          • Türkçe
          • Русский язык
          • 简中
          • 繁中
          Open Account
          Search
          Products
          Charts Free Forever
          Markets
          News
          Signals

          Copy Rankings Latest Signals Become a signal provider AI Rating
          Contests
          Brokers

          Overview Brokers Assessment Rankings Regulators News Claims
          Broker listing Forex Brokers Comparison Tool Live Spread Comparison Scam
          Q&A Complaint Scam Alert Videos Tips to Detect Scam
          More

          Business
          Events
          Careers About Us Advertising Help Center

          White Label

          Broker API

          Data API

          Web Plug-ins

          Affiliate Program

          Awards Institution Evaluation IB Seminar Salon Event Exhibition
          Vietnam Thailand Singapore Dubai
          Fans Party Investment Sharing Session
          FastBull Summit BrokersView Expo

          USD/JPY Falls 10%: Why the Yen Gains 11.11%, Not 10%

          Patrick Turner
          Summary:

          Reversing a currency quote does not simply reverse its percentage return. Recalculate USD/JPY in both directions, separate a price change from a cash conversion, and check the bid and ask before comparing performance.

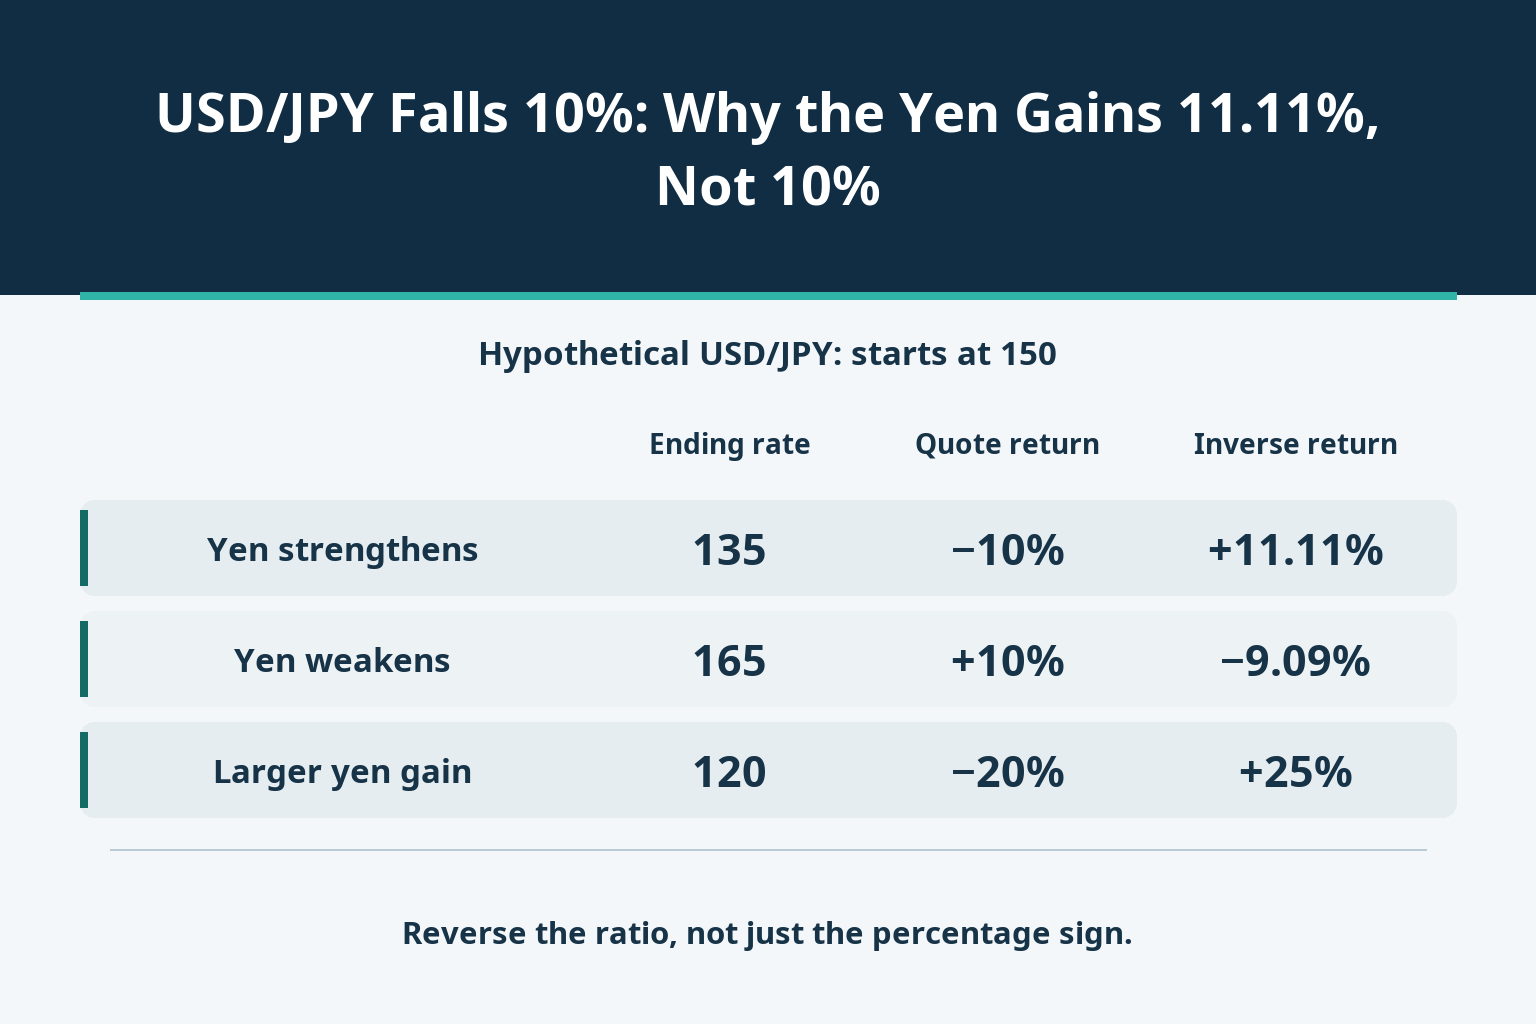
          If USD/JPY falls from 150 to 135, the dollar loses 10% against the yen. Over exactly the same interval, the yen gains 11.11% against the dollar. Both statements are correct: the percentage calculation changes its starting denominator when the quote is inverted.

          That difference is not an arbitrage opportunity, an extra return from a broker, or evidence that one chart is wrong. It matters when you compare currency strength, translate a cash balance, or read a return reported in the opposite quotation. The following prices are hypothetical, with no interest or fees unless expressly included.
          USD/JPY Falls 10%: Why the Yen Gains 11.11%, Not 10%_1

          Start with units, not the sign on the chart

          USD/JPY at 150 means 150 yen per dollar. Its reciprocal, JPY/USD, is 1/150 dollars per yen. After USD/JPY reaches 135, each yen buys 1/135 dollars. The dollar buys fewer yen, while the yen buys more dollars.

          The direct percentage is 135/150 − 1 = −10%. The reciprocal percentage is (1/135)/(1/150) − 1 = 150/135 − 1 = +11.11%. Dividing the 15-yen change by 150 answers the first question. The reverse calculation has a different economic unit and denominator; changing only the sign cannot answer it.

          Hypothetical USD/JPYUSD/JPY changeReciprocal JPY/USD change
          150 → 135−10.00%+11.11%
          150 → 165+10.00%−9.09%
          150 → 120−20.00%+25.00%

          Use the return factor to reverse a percentage

          Let Q be units of the quote currency per unit of the base currency, with positive initial and final rates Q0 and Q1. The direct simple return is r = Q1/Q0 − 1. For the inverse quote, s = Q0/Q1 − 1. Therefore s = −r/(1+r), and (1+r)(1+s) = 1. Enter returns as decimals: −10% is −0.10, not −10.

          A 20% decline in a quotation corresponds to a 25% rise in its reciprocal. The further the change is from zero, the worse the shortcut s ≈ −r becomes. Small daily changes can make the shortcut look harmless; that does not make it exact or suitable for reconciling cash.

          Do not confuse reversing the quotation with reversing time. A rate that falls 10% and then rises 10% ends at 99% of its initial value: 150 × 0.90 × 1.10 = 148.5. Returning from 135 to 150 requires an 11.11% increase. The same denominator issue explains both, but they are different comparisons.

          Reconcile the percentage with an actual cash balance

          Suppose a dollar-based holder exchanges USD 10,000 for JPY 1,500,000 at 150, holds the yen without interest, and later converts it back at 135. The ending balance is USD 11,111.11 before costs. Relative to the initial USD 10,000, the dollar return is 11.11%—the yen’s appreciation in dollar terms, not the −10% change shown by USD/JPY.

          This example is a fully funded cash conversion, not a leveraged short-position calculation. A trading contract can settle profit in another currency, use different conversion rules, and divide return by equity or posted margin. Applying 11.11% to a margin deposit would silently replace the denominator and can be seriously misleading.

          State all three items alongside a return: what was held, the currency in which the result is measured, and the initial amount used as the denominator. A quote percentage alone supplies none of the contract-specific financing or leverage information.

          Then replace reference prices with executable sides

          Now suppose the opening USD/JPY bid/ask is 150.00/150.04 and the closing quote is 135.00/135.04. Selling dollars initially uses the bid, 150.00. Buying dollars with the yen later uses the ask, 135.04. The ending balance becomes 1,500,000/135.04 = USD 11,107.82, a return of about 11.0782% before any separate charges.

          USD 10,000 converted and held as yenEnding USDReturn in USD
          Convert back at 135, without spread11,111.11+11.1111%
          Convert back at ask 135.0411,107.82+11.0782%
          Difference already included in execution−3.29−0.0329 percentage points

          The USD 3.29 difference from the frictionless example is already in the chosen execution prices. Do not deduct the same spread again as an additional cost. Separately charged commission, cash interest and conversion fees still belong in the ledger.

          When a two-sided quote is inverted, the sides also exchange places: inverse bid = 1/original ask, and inverse ask = 1/original bid. For the transaction-side derivation, see constructing executable cross rates and reversing bid and ask. A central-bank reference rate or a chart midpoint can support a price comparison, but is not a promise that either conversion is available at that price.

          Log returns reverse exactly, but answer another question

          For a consistently measured rate, the log return is ln(Q1/Q0). Inverting the rate gives ln(Q0/Q1), exactly its negative. This can be useful when a research dataset needs one common currency orientation or when returns are added across periods.

          It does not turn the ordinary cash return into an equal-and-opposite percentage. Convert a log return g back to a simple return using exp(g) − 1. Labelling a log change as a percentage gain on account equity mixes two measures. Nor does changing orientation make different currency pairs directly comparable if their observation times or reference currencies differ.

          A practical check before comparing two numbers

          First write the unit beside both rates—for example, JPY per USD—and align the opening and closing timestamps. Confirm that both observations use the same source and the same price convention. A bid series and a midpoint series are not interchangeable.

          Next compute Q1/Q0 and its reciprocal before subtracting one. Their product should be one for an exact reciprocal pair. If it is not, check rounded inputs, reversed dates, mixed quote sides or different instruments before declaring a discrepancy. Preserve calculation precision and round only the reported result.

          Finally, if the question is “what did my money earn?”, reconstruct the actual conversions and cash flows. Include the applicable bid/ask, commissions, interest and contract settlement rules, then divide the net result by the explicitly chosen starting capital. Inverting a quote fixes the direction of the price measure; it cannot reconstruct missing account economics.

          Risk Warnings and Disclaimers
          You understand and acknowledge that there is a high degree of risk involved in trading. Following any strategies or investment methods may lead to potential losses. The content on the site is provided by our contributors and analysts for information purposes only. You are solely responsible for determining whether any trading assets, securities, strategy, or any other product is suitable for investing based on your own investment objectives and financial situation.
          Add to Favorites
          Share
          FastBull
          Copyright © 2026 FastBull Ltd

          728 RM B 7/F GEE LOK IND BLDG NO 34 HUNG TO RD KWUN TONG KLN HONG KONG

          TelegramInstagramTwitterfacebooklinkedin
          App Store Google Play Android Windows
          Products
          Charts

          Chats

          Q&A with Experts
          Screeners
          Economic Calendar
          Data
          Tools
          Membership
          Features
          Function
          Markets
          Copy Trading
          Latest Signals
          Contests
          24/7
          Analysis
          Education
          Company
          Careers
          About Us
          Contact Us
          Advertising
          Download FastBull
          Help Center
          Feedback
          User Agreement
          Privacy Policy
          Personal Information Protection Statement
          Business

          White Label

          Broker API

          Data API

          Web Plug-ins

          Poster Maker

          Affiliate Program

          Risk Disclosure

          The risk of loss in trading financial instruments such as stocks, FX, commodities, futures, bonds, ETFs and crypto can be substantial. You may sustain a total loss of the funds that you deposit with your broker. Therefore, you should carefully consider whether such trading is suitable for you in light of your circumstances and financial resources.

          No decision to invest should be made without thoroughly conducting due diligence by yourself or consulting with your financial advisors. Our web content might not suit you since we don't know your financial conditions and investment needs. Our financial information might have latency or contain inaccuracy, so you should be fully responsible for any of your trading and investment decisions. The company will not be responsible for your capital loss.

          Without getting permission from the website, you are not allowed to copy the website's graphics, texts, or trademarks. Intellectual property rights in the content or data incorporated into this website belong to its providers and exchange merchants.

          Not Logged In

          Log in to access more features

          Connect Broker
          Become a signal provider
          Help Center
          Customer Service
          Dark Mode
          Price Up/Down Colors

          Log In

          Sign Up

          Position
          Layout
          Fullscreen
          Default to Chart
          The chart page opens by default when you visit fastbull.com