


- WTI
- XAUUSD
- XAGUSD
- USDX


Markets
Analysis
User
24/7
Economic Calendar
Education
Data
- Names
- Latest
- Prev














The same Nikkei settlement level does not ensure the same dollar profit. Compare properly sized USD and JPY futures, account for different entry prices, and see why converting variation cash along the way can change the result even when the index returns to its starting level.
A dollar-denominated Nikkei future is not a yen future with its profit automatically translated at the latest exchange rate. Its dollar value per index point is fixed by the contract. That distinction affects position sizing, the comparison of entry prices and the cash received or paid during the trade.
For a dollar-based account, the useful question is not which currency label looks safer. It is whether the two positions have comparable point sensitivity, which exchange rates apply to their cash flows, and what has been assumed about financing those flows. A common final index reference does not make the answers identical.
CME's standard dollar Nikkei contract, NKD, pays USD 5 per index point; its standard yen contract, NIY, pays JPY 500. Their outright minimum price movement is five points: USD 25 or JPY 2,500 per contract. These are the standard contracts, not the micro versions. Osaka's large Nikkei future instead has a JPY 1,000 point multiplier.
Under CME Chapters 352 and 352B, same-expiry USD and JPY contracts cash-settle against the specified special opening quotation used for the Osaka Nikkei future, rounded to 0.01 point. This is a defined final settlement reference, not simply the last index print. Before expiry, each contract still has its own traded price.
Assume an initial exchange rate of 150 yen per dollar. Two USD contracts provide USD 10 per point. Three JPY contracts provide JPY 1,500 per point, also USD 10 at that exchange rate. These are alternative long portfolios, not two legs of a recommended spread trade.
More generally, the yen-to-dollar contract-count ratio for this initial point match is 5 × X₀ / 500, or X₀ / 100, where X₀ is yen per dollar. The ratio is 1.5 at 150. Dividing the JPY amount by X converts it into USD; a lower X means a stronger yen.
The match is temporary. With the same three JPY contracts, one index point becomes USD 12 at X = 125 but about USD 8.57 at X = 175. The two USD contracts remain USD 10 per point. This is not a match of margin requirements, capital committed or percentage returns.
Now assume the USD contracts are bought at 30,100 and the JPY contracts at 30,000, with the same expiry. Every price and exchange rate in the examples is hypothetical. The 100-point entry spread is an input, not an observed premium or a calculation of fair value.
Let I be the common final settlement index and X the terminal yen-per-dollar rate. The USD portfolio earns 10 × (I − 30,100) dollars. The JPY portfolio earns 1,500 × (I − 30,000) yen. For this first comparison, retain gains in yen, finance losses in yen, assume zero financing interest, and translate the net yen ledger at the end. Actual variation payments still occur during the holding period: this cash-management convention does not defer exchange settlement.
The table excludes fees, tax, FX spreads and initial collateral transfers. Each row is a separate terminal state, not a sequence of trades.
| Final index (points) | JPY per USD | USD futures P/L (USD) | JPY futures P/L (JPY) | JPY P/L converted (USD) | USD less converted JPY (USD) |
|---|---|---|---|---|---|
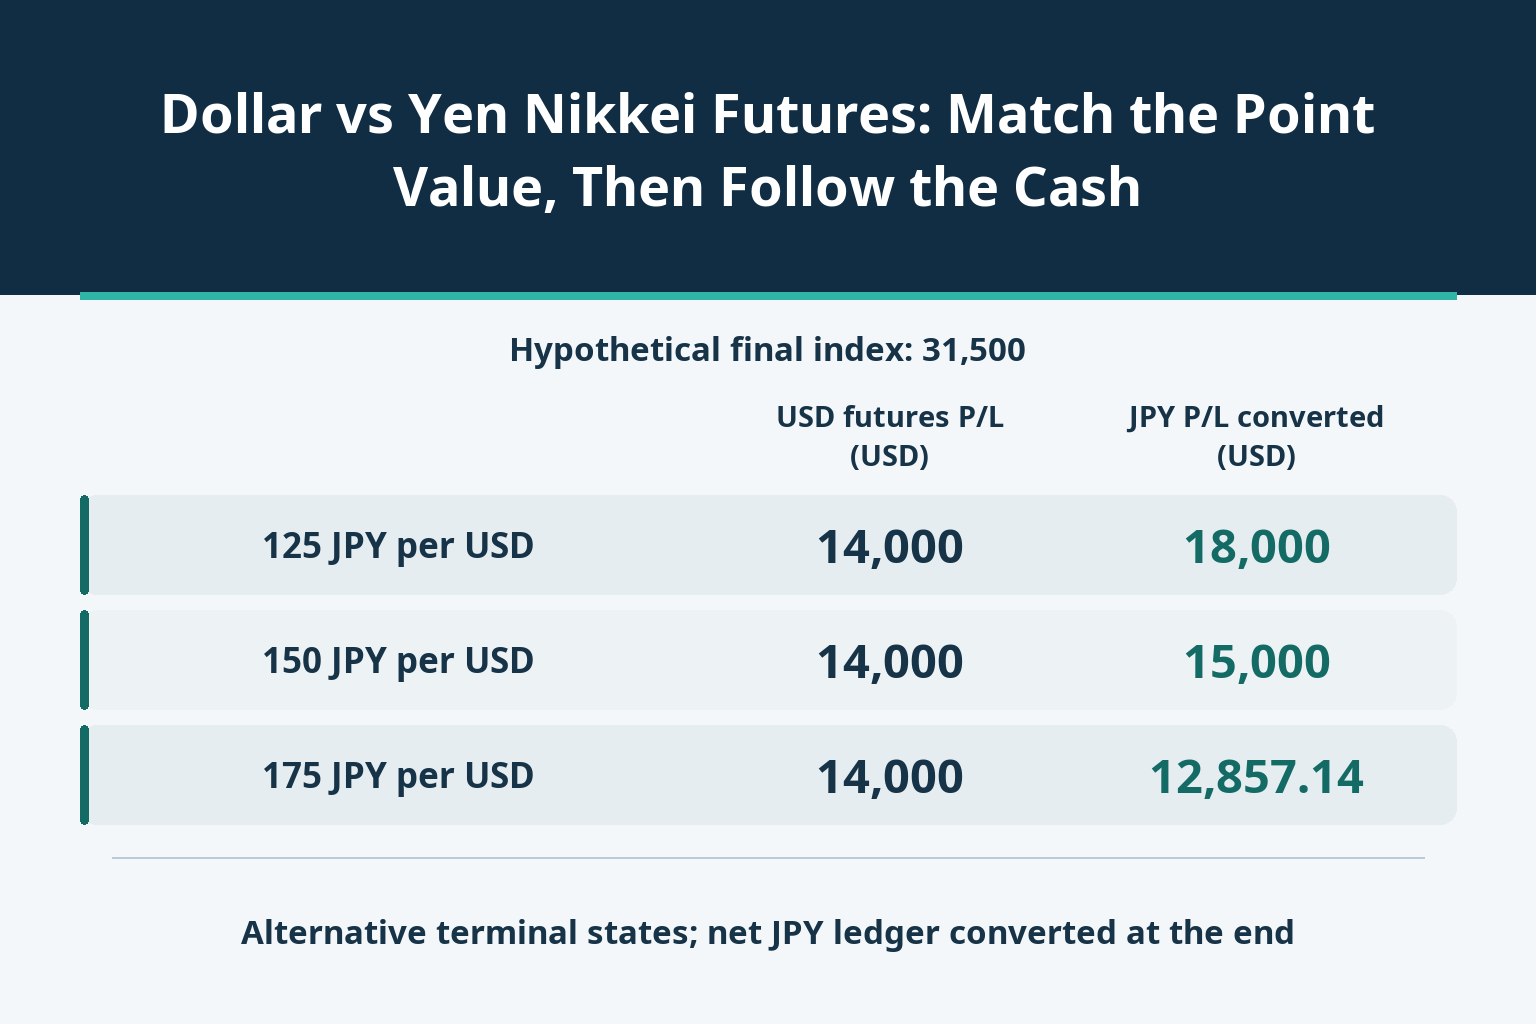
| 31,500 | 125 | 14,000 | 2,250,000 | 18,000 | −4,000 |
| 31,500 | 150 | 14,000 | 2,250,000 | 15,000 | −1,000 |
| 31,500 | 175 | 14,000 | 2,250,000 | 12,857.14 | 1,142.86 |
| 28,500 | 125 | −16,000 | −2,250,000 | −18,000 | 2,000 |
| 28,500 | 150 | −16,000 | −2,250,000 | −15,000 | −1,000 |
| 28,500 | 175 | −16,000 | −2,250,000 | −12,857.14 | −3,142.86 |
At I = 31,500, the USD portfolio earns USD 14,000. The yen portfolio earns JPY 2.25 million, worth USD 18,000 at 125 but only USD 12,857.14 at 175. Its dollar result is larger in the first state and smaller in the second.
At I = 28,500, the same conversion works on a loss. A stronger yen makes the JPY 2.25 million payment more expensive in dollars: USD 18,000 at 125 against the USD portfolio's USD 16,000 loss. “Yen appreciation helps” is incomplete unless the sign of the yen cash flow is specified.
The conditional equality rates are different: 2,250,000 / 14,000 ≈ 160.714286 for the rising-index case, and 2,250,000 / 16,000 = 140.625 for the falling case. These are accounting boundaries for the assumed entries and final indices, not exchange-rate targets. At X = 150, the initial point match leaves the USD portfolio USD 1,000 behind in either case because it entered 100 points higher. If I equals 30,000, the JPY position breaks even in yen while the USD position still loses USD 1,000.
The dollar contract fixes the currency value of an index point rather than converting a yen payment at prevailing spot FX. That payout structure is commonly described as quanto. It changes the economic relationship between the index exposure and the reporting currency; it is not a standing exchange service at 100 yen per dollar merely because 500 divided by 5 equals 100.
Joint index and currency dynamics, including volatility and correlation under the relevant pricing assumptions, matter to the relative valuation. The sign and size of an observed price difference cannot be inferred from the two multipliers alone. Neither a permanently positive dollar premium nor automatic dollar-contract outperformance follows.
For a position closed before expiry, calculate each leg from its own entry and exit prices. Substituting the same current cash-index value into both P/L formulas silently assumes away their separate futures bases. Likewise, a price spread alone does not establish an arbitrage: cash-flow currencies, sizing, funding and execution are part of the comparison.
Consider a separate example using only three JPY futures bought at 30,000. In one path, the settlement price rises to 31,500 and returns to 30,000; in the other it falls to 28,500 and returns. The first cash conversion occurs at 125 yen per dollar and the second at 150. Sell every positive yen flow for dollars and purchase yen with dollars to meet every negative flow.
These are two illustrative settlement intervals, not a claim that real cash calls occur exactly once per day. Assume complete conversion at the stated rates, no spreads, fees or interest, and exclude initial or additional collateral transfers.
| Path | Interval | Settlement (points) | Change (points) | Variation cash (JPY) | JPY per USD | Converted cash (USD) |
|---|---|---|---|---|---|---|
| Up, then back | First | 31,500 | 1,500 | 2,250,000 | 125 | 18,000 |
| Up, then back | Second | 30,000 | −1,500 | −2,250,000 | 150 | −15,000 |
| Down, then back | First | 28,500 | −1,500 | −2,250,000 | 125 | −18,000 |
| Down, then back | Second | 30,000 | 1,500 | 2,250,000 | 150 | 15,000 |
The first path produces USD 18,000 − USD 15,000 = USD 3,000. The second produces −USD 18,000 + USD 15,000 = −USD 3,000. Both have zero net yen futures P/L and the same final index and FX rate. Their converted dollar cash differs because the yen receipts and payments occur against different exchange rates.
The correct cash sum is Σ[1,500 × ΔFₜ / Xₜ], not 1,500 × (Fend − Fstart) / Xend. If instead all flows are retained or financed in yen until the end at zero interest, the net yen ledger is zero and its terminal conversion is zero. The policies are different; the futures arithmetic is not contradictory. The extra dollar amount belongs to the combined futures-and-FX cash result, not to a guaranteed index strategy.
A futures position does not require paying the full index-linked notional as though buying the underlying stocks. That does not make it free to hold. Variation losses require currency liquidity when due; collateral, funding charges and the broker's conversion arrangements need a separate ledger. A terminal gain cannot pay an earlier cash call unless financing is available.
For a USD reporter, the USD contract does not require yen-to-dollar conversion of its variation cash: its own payments and receipts are already in dollars. Index risk and relative-price changes remain, and a non-USD reporter faces another translation question. Quoting P/L as a return on an arbitrary margin number would also obscure changing funding needs. The distinction between settlement prices and the resulting futures cash ledger is therefore material to the currency comparison, not a back-office detail.
The decisive distinction is between a fixed dollar amount per index point and a yen cash flow whose dollar value depends on conversion. Once position size, entry basis and cash timing are explicit, the comparison becomes reproducible—and neither currency label can stand in for the calculation.

728 RM B 7/F GEE LOK IND BLDG NO 34 HUNG TO RD KWUN TONG KLN HONG KONG





The risk of loss in trading financial instruments such as stocks, FX, commodities, futures, bonds, ETFs and crypto can be substantial. You may sustain a total loss of the funds that you deposit with your broker. Therefore, you should carefully consider whether such trading is suitable for you in light of your circumstances and financial resources.
No decision to invest should be made without thoroughly conducting due diligence by yourself or consulting with your financial advisors. Our web content might not suit you since we don't know your financial conditions and investment needs. Our financial information might have latency or contain inaccuracy, so you should be fully responsible for any of your trading and investment decisions. The company will not be responsible for your capital loss.
Without getting permission from the website, you are not allowed to copy the website's graphics, texts, or trademarks. Intellectual property rights in the content or data incorporated into this website belong to its providers and exchange merchants.
Not Logged In
Log in to access more features


Log In
Sign Up


