• Trade
  • Markets
  • Copy
  • Contests
  • 24/7
  • Calendar
  • Q&A
  • Chats
Screeners
SYMBOL
LAST
BID
ASK
HIGH
LOW
NET CHG.
%CHG.
SPREAD
SOURCE
SPX
S&P 500 Index
7744.06
7744.06
7744.06
7754.15
7669.66
+25.12
+ 0.33%
--
--
DJI
Dow Jones Industrial Average
52177.69
52177.69
52177.69
52250.18
51681.37
+556.21
+ 1.08%
--
--
IXIC
NASDAQ Composite Index
26713.02
26713.02
26713.02
26754.02
26308.85
+20.16
+ 0.08%
--
--
USDX
US Dollar Index
101.760
101.760
101.840
101.860
101.730
+0.020
+ 0.02%
--
--
EURUSD
Euro / US Dollar
1.12170
1.12170
1.12177
1.12204
1.12077
-0.00032
-0.03%
--
--
GBPUSD
Pound Sterling / US Dollar
1.32822
1.32822
1.32835
1.32844
1.32608
+0.00069
+ 0.05%
--
--
XAUUSD
Gold / US Dollar
4169.24
4169.24
4169.63
4179.75
4146.99
-1.96
-0.05%
--
--
WTI
Light Sweet Crude Oil
95.794
95.794
95.829
96.283
95.583
-0.294
-0.31%
--
--

Community Accounts

Signal Accounts
--
Profit Accounts
--
Loss Accounts
--
View More

Become a signal provider

Sell trading signals to earn additional income

View More

Guide to Copy Trading

Get started with ease and confidence

View More

Signal Accounts for Members

All Signal Accounts

Best Return
  • Best Return
  • Best P/L
  • Best MDD
Past 1W
  • Past 1W
  • Past 1M
  • Past 1Y

All Contests

  • All
  • Recommend
  • Stocks
  • Cryptocurrencies
  • Central Banks
  • Trump Updates
  • Featured News
Top News Only
Share

U.S. Treasury Official Brown: The U.S. Economy Is Currently Showing Strong Momentum, And The Progress Made By Japan Also Gives US Confidence

Share

The Greenlandic Parliament Has Passed A Bill Banning Deep-sea Exploration And Mining

Share

U.S. Treasury Official Brown: The International Monetary Fund Needs To Take A More Balanced Approach In Assessing The Global Economic Outlook And Should Consider The Opportunities Presented By Positive Economic Shocks Led By The United States

Share

China's Ministry Of Industry And Information Technology Has Released The 35th Batch Of Catalogs Of New Energy Vehicle Models Eligible For Tax Reduction Or Exemption, Which Includes The Li Auto MEGA And Li Auto I6

Share

U.S. Treasury Official Brown: The International Monetary Fund Must Be More Proactive In Identifying Global Imbalances

Share

Vitol Stated That The Global Fuel Oil Market Remains Tight Due To The Conflict Affecting Supplies In The Middle East And Russia

Share

Federal Reserve Chairman Walsh Will Attend The IMF Annual Meeting In Bangkok In Ten Minutes And Have A Fireside Chat With IMF Managing Director Kristalina Georgieva

Share

German Finance Minister: (Regarding Energy Prices) The Right Direction Is To Continue Investing In Renewable Energy, Which Is The Cheapest Option

Share

German Finance Minister: Investment Is Important, But I Don’t Want To Tell Citizens Because We Have To Comply With The Debt Brake Mechanism, So We Can’t Protect Them

Share

The German Finance Minister Commented On UniCredit's Acquisition Of Commerzbank: "We Really Need To Consider How To Fully Protect Ourselves From Such Tactics."

Share

French Finance Minister Lescuer: France Will Activate Its Budget Constraint Mechanism If Necessary

Share

Trump Said Zelenskyy Did Not Want To Resolve The Ukraine Crisis

Share

The Bank Of Korea Reported That Net Foreign Investment In South Korean Bonds Was -$5.81 Billion In September, Compared To -$4.53 Billion In August; Net Foreign Investment In South Korean Stocks Was -$14.16 Billion In September, Compared To +$0.4 Billion In August

Share

The Main Polysilicon Futures Contract Rose By More Than 3%, Currently Trading At 34,880 Yuan/ton

Share

Japan Is Considering Mandating That Telecommunications Companies Take Measures To Prevent Cyberattacks

Share

IMF Managing Director Kristalina Georgieva: More Funding Is Needed For The IMF’s Poverty Reduction And Growth Trust, Which Provides Loans To Low-income Countries

Share

New York Gold Futures Broke Through $4,200 Per Ounce, Up 0.72% On The Day

Share

The Main Platinum Contract Rose 2.00% Intraday, Currently Trading At 401.45 Yuan/gram

Share

The Main Palladium Futures Contract Rose More Than 3%, Currently Trading At 271.5 Yuan/gram

Share

Palladium Futures Rose 1% On The Day, Currently Trading At $1,141.00 Per Ounce

TIME
ACT
FCST
PREV
IMPACT
U.S. Retail Sales YoY (Sept)

A:--

F: --

P: --

USDX
  • USDX
  • XAUUSD
  • XAGUSD
  • WTI
U.S. Philadelphia Fed Business Activity Index (SA) (Oct)

A:--

F: --

P: --

USDX
  • USDX
  • XAUUSD
  • XAGUSD
  • WTI
U.S. Retail Sales (Sept)

A:--

F: --

P: --

USDX
  • USDX
  • XAUUSD
  • XAGUSD
  • WTI
U.S. Philadelphia Fed Manufacturing Employment Index (Oct)

A:--

F: --

P: --

USDX
  • USDX
  • XAUUSD
  • XAGUSD
  • WTI
U.S. Core Retail Sales (Sept)

A:--

F: --

P: --

USDX
  • USDX
  • XAUUSD
  • XAGUSD
  • WTI
U.S. Core PPI MoM (SA) (Sept)

A:--

F: --

P: --

USDX
  • USDX
  • XAUUSD
  • XAGUSD
  • WTI
U.S. Core Retail Sales MoM (Sept)

A:--

F: --

P: --
USDX
  • USDX
  • XAUUSD
  • XAGUSD
  • WTI
U.S. Core PPI YoY (Sept)

A:--

F: --

P: --
USDX
  • USDX
  • XAUUSD
  • XAGUSD
  • WTI
Canada Manufacturing Unfilled Orders MoM (Aug)

A:--

F: --

P: --

USDCAD
  • USDCAD
  • XAUUSD
  • XAGUSD
  • WTI
  • USDX
U.S. NY Fed Manufacturing Employment Index (Oct)

A:--

F: --

P: --

USDX
  • USDX
  • XAUUSD
  • XAGUSD
  • WTI
Canada Wholesale Sales YoY (Aug)

A:--

F: --

P: --

USDCAD
  • USDCAD
  • XAUUSD
  • XAGUSD
  • WTI
  • USDX
Canada Wholesale Inventory MoM (Aug)

A:--

F: --

P: --

USDCAD
  • USDCAD
  • XAUUSD
  • XAGUSD
  • WTI
  • USDX
Canada Manufacturing New Orders MoM (Aug)

A:--

F: --

P: --

USDCAD
  • USDCAD
  • XAUUSD
  • XAGUSD
  • WTI
  • USDX
Canada Manufacturing Inventory MoM (Aug)

A:--

F: --

P: --

USDCAD
  • USDCAD
  • XAUUSD
  • XAGUSD
  • WTI
  • USDX
U.S. NY Fed Manufacturing Prices Received Index (Oct)

A:--

F: --

P: --

USDX
  • USDX
  • XAUUSD
  • XAGUSD
  • WTI
Canada Wholesale Inventory YoY (Aug)

A:--

F: --

P: --

USDCAD
  • USDCAD
  • XAUUSD
  • XAGUSD
  • WTI
  • USDX
U.S. NY Fed Manufacturing New Orders Index (Oct)

A:--

F: --

P: --

USDX
  • USDX
  • XAUUSD
  • XAGUSD
  • WTI
U.S. Commercial Inventory MoM (Aug)

A:--

F: --

P: --
USDX
  • USDX
  • XAUUSD
  • XAGUSD
  • WTI
U.S. EIA Weekly Natural Gas Stocks Change

A:--

F: --

P: --

WTI
  • WTI
  • XAUUSD
  • XAGUSD
  • USDX
U.S. EIA Weekly Heating Oil Stock Changes

A:--

F: --

P: --

WTI
  • WTI
  • XAUUSD
  • XAGUSD
  • USDX
U.S. EIA Weekly Crude Oil Imports Changes

A:--

F: --

P: --

WTI
  • WTI
  • XAUUSD
  • XAGUSD
  • USDX
U.S. EIA Weekly Crude Stocks Change

A:--

F: --

P: --

WTI
  • WTI
  • XAUUSD
  • XAGUSD
  • USDX
U.S. EIA Weekly Cushing, Oklahoma Crude Oil Stocks Change

A:--

F: --

P: --

WTI
  • WTI
  • XAUUSD
  • XAGUSD
  • USDX
U.S. EIA Weekly Crude Demand Projected by Production

A:--

F: --

P: --

WTI
  • WTI
  • XAUUSD
  • XAGUSD
  • USDX
U.S. EIA Weekly Gasoline Stocks Change

A:--

F: --

P: --

WTI
  • WTI
  • XAUUSD
  • XAGUSD
  • USDX
U.S. Weekly Treasuries Held by Foreign Central Banks

A:--

F: --

P: --

USDX
  • USDX
  • XAUUSD
  • XAGUSD
  • WTI
FOMC Member Hammack Speaks
South Korea Unemployment Rate (SA) (Sept)

A:--

F: --

P: --

XAUUSD
  • XAUUSD
  • XAGUSD
  • WTI
US President Trump delivered a speech
BOE Gov Bailey Speaks
BOC Gov Macklem Speaks
Euro Zone CPI YoY (Excl. Tobacco) (Sept)

--

F: --

P: --

Canada Existing Home Sales MoM (Sept)

--

F: --

P: --

Euro Zone Core CPI Final MoM (Sept)

--

F: --

P: --

Euro Zone Core CPI Final YoY (Sept)

--

F: --

P: --

Euro Zone Trade Balance (Not SA) (Aug)

--

F: --

P: --

Euro Zone HICP Final YoY (Sept)

--

F: --

P: --

Euro Zone HICP Final MoM (Sept)

--

F: --

P: --

Euro Zone Trade Balance (SA) (Aug)

--

F: --

P: --

India Deposit Gowth YoY

--

F: --

P: --

Canada New Housing Starts (Sept)

--

F: --

P: --

U.S. Export Price Index MoM (Sept)

--

F: --

P: --

U.S. Import Price Index YoY (Sept)

--

F: --

P: --

U.S. Import Price Index MoM (Sept)

--

F: --

P: --

U.S. Export Price Index YoY (Sept)

--

F: --

P: --

U.S. Manufacturing Output MoM (SA) (Sept)

--

F: --

P: --

U.S. Industrial Output MoM (SA) (Sept)

--

F: --

P: --

U.S. Capacity Utilization MoM (SA) (Sept)

--

F: --

P: --

U.S. Manufacturing Capacity Utilization (Sept)

--

F: --

P: --

U.S. Industrial Output YoY (Sept)

--

F: --

P: --

U.S. Weekly Total Oil Rig Count

--

F: --

P: --

U.S. Weekly Total Rig Count

--

F: --

P: --

BOE Gov Bailey Speaks
U.K. Rightmove House Price Index YoY (Oct)

--

F: --

P: --

China, Mainland Industrial Output YoY (YTD) (Sept)

--

F: --

P: --

China, Mainland GDP YoY (YTD) (Q3)

--

F: --

P: --

China, Mainland GDP YoY (Q3)

--

F: --

P: --

China, Mainland GDP (Q3)

--

F: --

P: --

China, Mainland GDP QoQ (SA) (Q3)

--

F: --

P: --

China, Mainland Urban Area Unemployment Rate (Sept)

--

F: --

P: --

Canada National Economic Confidence Index

--

F: --

P: --

Q&A with Experts
    • All
    • Chatrooms
    • Groups
    • Friends
    1999kk.king flag
    100 pips 空间
    B&W flag
    1999kk.king
    4155 sell
    @1999kk.kingok
    Tâmia FX Club flag
    B&W
    mohon sinyal emas
    yes
    5817144 flag
    ANYONE SEEYING SELL OPPORTUNITY LIKE ME?
    Tâmia FX Club flag
    Tâmia FX Club flag
    good morning
    B&W flag
    Tâmia FX Club
    good morning
    @Tâmia FX Clubselamat pagi juga
    Luminoux flag
    Tâmia FX Club
    good morning
    @Tâmia FX Clubgood morning from here
    Topnotch W flag
    will gold continue falling?
    sonam flag
    hi everyone 👋
    sonam flag
    xauusd buy now 4148.4145 Sl 4135 target 4155.4160.4165.4170.open
    5799022 flag
    sonam
    xauusd buy now 4148.4145 Sl 4135 target 4155.4160.4165.4170.open
    @sonam Thanks Pro
    sonam flag
    sonam
    xauusd buy now 4148.4145 Sl 4135 target 4155.4160.4165.4170.open
    xauusd buy TP 1 Achieved 100 pip's Hit
    sonam flag
    5799022
    @sonam Thanks Pro
    @Visitor5799022welcome 🤗
    sonam flag
    sonam
    xauusd buy now 4148.4145 Sl 4135 target 4155.4160.4165.4170.open
    xauusd buy All TP Achieved 320+ pip's Hit 🎯
    sonam flag
    Sanjeev Ku flag
    oh my item today giving long call. all tp hit of my item.
    B&W flag
    sinyal emas lagi dong
    Eon flag
    Good morning guys
    Eon flag
    What is Fed Warsh up to this morning?
    Type here...
    Add Symbol or Code

      No matching data

      All
      Recommend
      Stocks
      Cryptocurrencies
      Central Banks
      Trump Updates
      Featured News
      • All
      • Russia-Ukraine Conflict
      • Middle East Flashpoint
      • All
      • Russia-Ukraine Conflict
      • Middle East Flashpoint
      Search
      Products

      Charts Free Forever

      Chats Q&A with Experts
      Screeners Economic Calendar Data Tools
      Membership Features
      Data Warehouse Market Trends Institutional Data Policy Rates Macro

      Market Trends

      Market Sentiment Order Book Forex Correlations

      Top Indicators

      Charts Free Forever
      Markets

      News

      24/7 Analysis Education

      Latest Views

      Latest Update

      Signals

      Copy Rankings Latest Signals Become a signal provider AI Rating
      Contests
      Brokers

      Overview Brokers Assessment Rankings Regulators News Claims
      Broker listing Forex Brokers Comparison Tool Live Spread Comparison Scam
      Q&A Complaint Scam Alert Videos Tips to Detect Scam
      More

      Business
      Events
      Careers About Us Advertising Help Center

      White Label

      Broker API

      Data API

      Web Plug-ins

      Affiliate Program

      Awards Institution Evaluation IB Seminar Salon Event Exhibition
      Vietnam Thailand Singapore Dubai
      Fans Party Investment Sharing Session
      FastBull Summit BrokersView Expo
      Recent Searches
        Top Searches
          Markets
          Analysis
          User
          24/7
          Economic Calendar
          Education
          Data
          • Names
          • Latest
          • Prev

          View All

          No data

          Scan to Download

          Faster Charts, Chat Faster!

          Download
          English
          • English
          • Español
          • العربية
          • Bahasa Indonesia
          • Bahasa Melayu
          • Tiếng Việt
          • ภาษาไทย
          • Français
          • Italiano
          • Türkçe
          • Русский язык
          • 简中
          • 繁中
          Open Account
          Search
          Products
          Charts Free Forever
          Markets
          News
          Signals

          Copy Rankings Latest Signals Become a signal provider AI Rating
          Contests
          Brokers

          Overview Brokers Assessment Rankings Regulators News Claims
          Broker listing Forex Brokers Comparison Tool Live Spread Comparison Scam
          Q&A Complaint Scam Alert Videos Tips to Detect Scam
          More

          Business
          Events
          Careers About Us Advertising Help Center

          White Label

          Broker API

          Data API

          Web Plug-ins

          Affiliate Program

          Awards Institution Evaluation IB Seminar Salon Event Exhibition
          Vietnam Thailand Singapore Dubai
          Fans Party Investment Sharing Session
          FastBull Summit BrokersView Expo

          Why a Convertible Bond Can Fall When Its Stock Rises: The Conversion Premium

          zhan chen
          Summary:

          A stock can rise while a convertible loses money. Use conversion value and the ending conversion premium to calculate price returns and break-even conditions, then include trading costs.

          A hypothetical convertible falls 3.2% while its underlying stock rises 10%. With the conversion ratio unchanged, those prices imply that the conversion premium has fallen from 25% to 10%. This describes the relationship between the two prices; explaining why the bond was repriced still requires information about its terms and the market.

          The useful question is therefore more precise than “Am I bullish on the stock?” It is: how much of the bond’s purchase price is supported by current conversion value, and what premium must still be present when I sell? The distinction matters most when a seemingly modest move in the stock is being used to justify a much larger price paid for the convertible.
          Why a Convertible Bond Can Fall When Its Stock Rises: The Conversion Premium_1

          Start with the shares, not the bond’s face value

          For a conventional fixed-ratio convertible, let F be face value, K the contractual conversion price and S the current share price. The conversion ratio is q = F ÷ K. Conversion value, also called parity, is V = q × S. Using bond price B on a consistent monetary basis, the market conversion premium is p = B ÷ V − 1.

          Consider a hypothetical bond with face value 100 and a fixed conversion price of 20. It represents five shares. With the stock at 24, conversion value is 120. A bond price of 150 therefore carries a 25% premium to conversion value: 150 ÷ 120 − 1. The 50% excess over face value is a different number and answers a different question.

          Nor is the contractual conversion price of 20 the investor’s effective stock acquisition cost after paying 150 for the bond. Dividing that purchase price by five gives 30 per share. The conversion price determines the share count; under the assumed terms it is not an additional cash exercise payment. Immediately exchanging the purchased bond for five shares worth 120 would give up 30 of value, or 20% of the 150 outlay, before costs. A 25% premium over parity is not a 25% loss measured against purchase cost.

          These numbers are an original illustration, not a quoted security. The two valuation snapshots use the same currency and unchanged conversion terms. The example has no coupon accrual, coupon payment, dividend, tax, transaction cost or currency movement between snapshots. Prices are monetary amounts per 100 face value. It is a comparison before any redemption or conversion event, not an assumed maturity payoff.

          Pair stock-price scenarios with ending conversion premiums

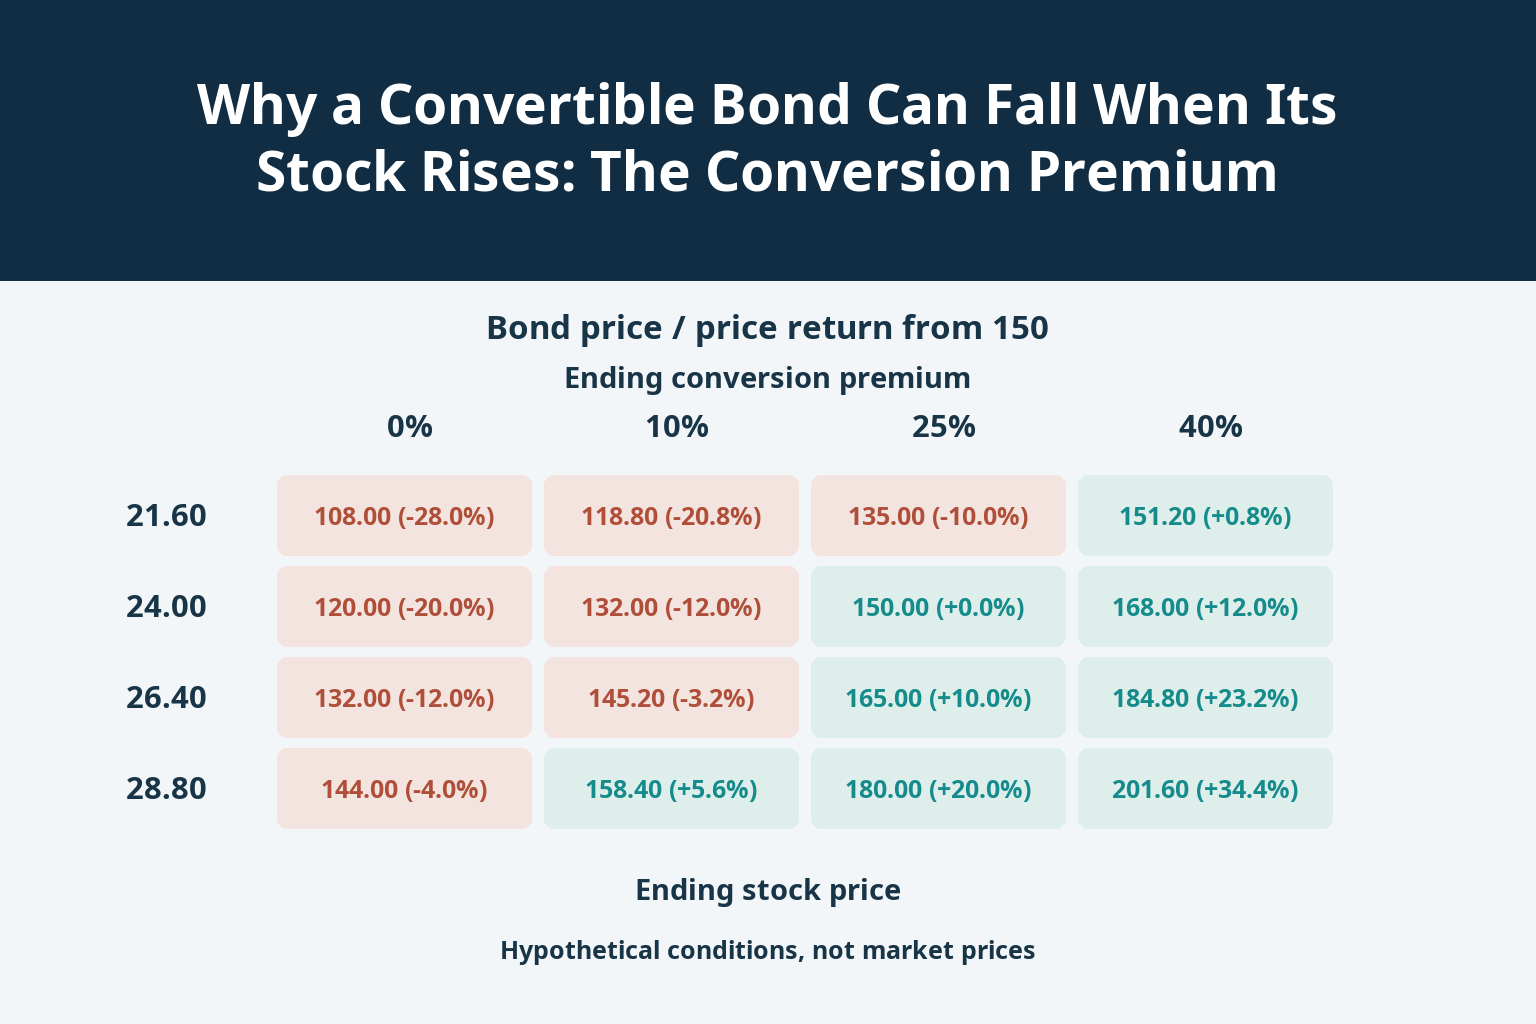
          Suppose the stock rises from 24 to 26.40. Five shares are then worth 132. If the bond still trades at a 25% conversion premium, its price is 165, matching the stock’s 10% gain in this particular scenario. If the ending premium is instead 10%, the bond is worth 132 × 1.10 = 145.20. Relative to the 150 purchase price, that is a loss of 4.80, or 3.2%.

          The matrix varies both inputs. Every cell shows the ending bond price, followed by its price return from 150. The column headings are ending conversion premiums, not bond returns. Each cell is a separate conditional quote scenario; the table does not assign probabilities or estimate fair prices.

          Hypothetical bond price and return from 150; fixed conversion ratio of five shares
          Ending stock price
          (stock return)
          0% premium10% premium25% premium40% premium
          21.60 (−10%)108.00 (−28.0%)118.80 (−20.8%)135.00 (−10.0%)151.20 (+0.8%)
          24.00 (0%)120.00 (−20.0%)132.00 (−12.0%)150.00 (0.0%)168.00 (+12.0%)
          26.40 (+10%)132.00 (−12.0%)145.20 (−3.2%)165.00 (+10.0%)184.80 (+23.2%)
          28.80 (+20%)144.00 (−4.0%)158.40 (+5.6%)180.00 (+20.0%)201.60 (+34.4%)

          Reading across the 26.40 row shows why a correct view on equity direction can still produce very different bond results. Reading down the 10% premium column shows how much stock appreciation is needed to overcome the initial premium. Even a 20% stock gain leaves a 4% bond loss if the ending premium is zero. Conversely, the upper-right cell gives a small bond gain despite a stock decline because it assumes a much larger ending premium; that is a condition, not a claim that premiums will cushion falling markets.

          The break-even premium is a decision threshold

          With a fixed conversion ratio, the exact price-return identity is:

          1 + bond price return = (1 + stock price return) × (1 + ending premium) ÷ (1 + starting premium).

          For the 10% stock gain and 25% starting premium, setting the bond return to zero gives an ending premium of 1.25 ÷ 1.10 − 1 = 13.6364%. The premium can fall by about 11.36 percentage points from 25% before the bond’s gross price gain disappears. A 10% ending premium is below that threshold, so the bond loses money in the illustration.

          The equation can be reversed. If the ending premium is assumed to be 10%, the stock must reach 150 ÷ (5 × 1.10) = 27.2727 to support the original bond price. That is a 13.6364% stock gain from 24. If the ending premium is zero, the required stock price is 30, a 25% gain. Neither result predicts where the stock or premium will go; each states what would have to be true for price break-even.

          Do not subtract percentage points from the stock return

          A premium falling from 25% to 10% is a decline of 15 percentage points. It does not mean that the bond loses 15% before adding the stock’s 10% gain. The relevant multiplier changes from 1.25 to 1.10, a 12% reduction. Combining it with the stock move gives 1.10 × 0.88 − 1 = −3.2%.

          An amount-based check reaches the same answer. First mark the five-share conversion value from 120 to 132 while retaining the old 25% premium: the bond rises from 150 to 165. Then apply the new 10% premium to the new conversion value: the price falls by 19.80 to 145.20. The net change is 15 − 19.80 = −4.80. That staged attribution is order-dependent, but the final price and the multiplicative identity are not.

          A conversion premium is an observed ratio, not a pricing engine

          The matrix explains how two quoted prices fit together. It does not prove that the premium is an independent cause of every bond move. Premium is calculated from the bond and stock prices themselves. It can compress simply because conversion value rises faster than the bond; identifying why the bond was repriced requires additional information about the instrument and the market.

          Time remaining, conversion restrictions and the issuer’s credit position cannot be recovered from the premium alone. Holding the premium fixed in a table is also not an estimate of the bond’s actual equity sensitivity. The identity contains no volatility model, credit valuation or forecast of investor demand. It should not be presented as any of those things.

          For the same reason, the convertible with the lowest premium is not automatically the cheapest security. A comparison needs compatible conversion rights, remaining terms, issuer risk, currency and executable prices. A low or negative displayed premium is a prompt to check the data and terms, not proof of a profit that can be locked in by converting and selling shares.

          Move from displayed prices to an investor’s cash result

          Use bond and stock observations from the same time, confirm the effective conversion price and check whether the bond quote includes accrued interest. A changed conversion ratio invalidates the fixed-five-share return identity. Stock-price adjustment conventions, delayed last trades and bid–ask spreads can also make a screen comparison misleading. A conversion value is not a promise that shares can be obtained and sold instantly at that value.

          The table excludes costs. Adding an entry charge of 0.50 and an exit charge of 0.50 to the 150-to-145.20 scenario changes the cash return to (145.20 − 0.50) ÷ (150 + 0.50) − 1 = −3.85%, rounded. With those charges, the gross sale price must reach 151 to recover the 150.50 entry outlay after the 0.50 exit cost. At a stock price of 26.40, that requires an ending conversion premium of about 14.3939%, rather than the cost-free 13.6364%. For an interest-paying bond, use actual accrued interest at each settlement and add coupons received once. Price return and total return then need not match, which is also central to distinguishing a quoted bond yield from an investor’s holding-period return.

          A practical comparison finishes with three explicit inputs: the actual purchase outlay, the share value implied by the current conversion terms, and a range of possible exit premiums. The stock view supplies only one of them. The break-even calculation makes the missing assumption visible before a price target on the equity is mistaken for a return target on the convertible.

          Risk Warnings and Disclaimers
          You understand and acknowledge that there is a high degree of risk involved in trading. Following any strategies or investment methods may lead to potential losses. The content on the site is provided by our contributors and analysts for information purposes only. You are solely responsible for determining whether any trading assets, securities, strategy, or any other product is suitable for investing based on your own investment objectives and financial situation.
          Add to Favorites
          Share
          FastBull
          Copyright © 2026 FastBull Ltd

          728 RM B 7/F GEE LOK IND BLDG NO 34 HUNG TO RD KWUN TONG KLN HONG KONG

          TelegramInstagramTwitterfacebooklinkedin
          App Store Google Play Android Windows
          Products
          Charts

          Chats

          Q&A with Experts
          Screeners
          Economic Calendar
          Data
          Tools
          Membership
          Features
          Function
          Markets
          Copy Trading
          Latest Signals
          Contests
          24/7
          Analysis
          Education
          Company
          Careers
          About Us
          Contact Us
          Advertising
          Download FastBull
          Help Center
          Feedback
          User Agreement
          Privacy Policy
          Personal Information Protection Statement
          Business

          White Label

          Broker API

          Data API

          Web Plug-ins

          Poster Maker

          Affiliate Program

          Risk Disclosure

          The risk of loss in trading financial instruments such as stocks, FX, commodities, futures, bonds, ETFs and crypto can be substantial. You may sustain a total loss of the funds that you deposit with your broker. Therefore, you should carefully consider whether such trading is suitable for you in light of your circumstances and financial resources.

          No decision to invest should be made without thoroughly conducting due diligence by yourself or consulting with your financial advisors. Our web content might not suit you since we don't know your financial conditions and investment needs. Our financial information might have latency or contain inaccuracy, so you should be fully responsible for any of your trading and investment decisions. The company will not be responsible for your capital loss.

          Without getting permission from the website, you are not allowed to copy the website's graphics, texts, or trademarks. Intellectual property rights in the content or data incorporated into this website belong to its providers and exchange merchants.

          Not Logged In

          Log in to access more features

          Connect Broker
          Become a signal provider
          Help Center
          Customer Service
          Dark Mode
          Price Up/Down Colors

          Log In

          Sign Up

          Position
          Layout
          Fullscreen
          Default to Chart
          The chart page opens by default when you visit fastbull.com