• Trade
  • Markets
  • Copy
  • Contests
  • 24/7
  • Calendar
  • Q&A
  • Chats
Screeners
SYMBOL
LAST
BID
ASK
HIGH
LOW
NET CHG.
%CHG.
SPREAD
SOURCE
SPX
S&P 500 Index
7712.57
7712.57
7712.57
7748.42
7668.03
+21.84
+ 0.28%
--
--
DJI
Dow Jones Industrial Average
52495.88
52495.88
52495.88
52689.81
51910.92
+529.85
+ 1.02%
--
--
IXIC
NASDAQ Composite Index
26424.81
26424.81
26424.81
26601.72
26179.74
-6.07
-0.02%
--
--
USDX
US Dollar Index
101.590
101.590
101.670
101.590
101.550
+0.110
+ 0.11%
--
--
EURUSD
Euro / US Dollar
1.12242
1.12242
1.12251
1.12367
1.12241
-0.00120
-0.11%
--
--
GBPUSD
Pound Sterling / US Dollar
1.33718
1.33718
1.33729
1.33798
1.33687
-0.00065
-0.05%
--
--
XAUUSD
Gold / US Dollar
4118.56
4118.56
4119.01
4131.71
4111.92
-6.44
-0.16%
--
--
WTI
Light Sweet Crude Oil
98.116
98.116
98.151
98.167
97.592
+0.231
+ 0.24%
--
--

Community Accounts

Signal Accounts
--
Profit Accounts
--
Loss Accounts
--
View More

Become a signal provider

Sell trading signals to earn additional income

View More

Guide to Copy Trading

Get started with ease and confidence

View More

Signal Accounts for Members

All Signal Accounts

Best Return
  • Best Return
  • Best P/L
  • Best MDD
Past 1W
  • Past 1W
  • Past 1M
  • Past 1Y

All Contests

  • All
  • Recommend
  • Stocks
  • Cryptocurrencies
  • Central Banks
  • Trump Updates
  • Featured News
Top News Only
Share

Shares Of South Korean Data Center Technology Company Elice Rose 16% After Plunging 32% On Its First Day Of Trading In South Korea

Share

South Korea's Imports From October 1 To 20 Increased By 42.8% Year-on-Year

Share

South Korea's Exports In The First 20 Days Of October Increased By 105.4% Year-on-Year

Share

Japan's Exports To China Rose 8.6% Year-on-Year In September, Exports To The United States Increased By 22.9%, And Exports To The European Union Increased By 10.5%

Share

Japan's Imports Rose 18.9% Year-on-Year In September, Compared With An Estimated 20.4%

Share

The CEO Of Citadel Securities Criticized Trump's Tax Cut Policy, Saying The U.S. Has No Fiscal Space Left

Share

Nvidia Is Reportedly In Talks To Invest Hundreds Of Millions Of Dollars In Firmus

Share

Negotiations On Steel And Aluminum Tariffs Between The US And Mexico Have Stalled, And A Trade Agreement May Be Delayed Until After The US Midterm Elections

Share

The Houthi Rebels In Yemen Claimed That Saudi Arabia Launched 93 Attacks In 24 Hours

Share

Market News: South Korea Has Asked Banks To Avoid Competing To Issue Bonds

Share

The US Side Stated That Progress Has Been Made In Russia-Ukraine Peace Negotiations, Bitcoin Remained Range-bound, And The Three Major US Stock Indices Closed Mixed

Share

Witkov Will Present A Peace Proposal To Putin After His Meeting With Zelensky

Share

Shares Of Australian Data Center Developer NEXTDC Fell 44% After The Company Lowered Its Earnings Outlook

Share

Applying Voltage Can Change The Magnetic State Of A Four-layer Graphene Material

Share

AI Agents Can Spontaneously Form A Vocabulary System

Share

Japanese And Russian Officials Met On Tuesday To Discuss A Number Of Current Issues

Share

New York Gold Futures Broke Through $4,150 Per Ounce, Up 0.16% On The Day

Share

Reserve Bank Of Australia Deputy Governor: September Labor Market Report Slightly Weaker Than Expected. Unemployment Remains Low, But The Labor Market Is Softening

Share

Spot Gold Broke Through $4,130 Per Ounce, Up 0.10% On The Day

Share

Reserve Bank Of Australia Deputy Governor: We Cannot Target Current Inflation, But It Is Still Important

TIME
ACT
FCST
PREV
IMPACT
U.K. Unemployment Rate (Sept)

A:--

F: --

P: --

GBPUSD
  • GBPUSD
  • XAUUSD
  • XAGUSD
  • WTI
  • USDX
U.K. Unemployment Claimant Count (Sept)

A:--

F: --

P: --
GBPUSD
  • GBPUSD
  • XAUUSD
  • XAGUSD
  • WTI
  • USDX
U.K. 3-Month ILO Employment Change (Aug)

A:--

F: --

P: --

GBPUSD
  • GBPUSD
  • XAUUSD
  • XAGUSD
  • WTI
  • USDX
U.K. Average Weekly Earnings (3-Month Average, Excluding Bonuses) YoY (Aug)

A:--

F: --

P: --
GBPUSD
  • GBPUSD
  • XAUUSD
  • XAGUSD
  • WTI
  • USDX
U.K. Average Weekly Earnings (3-Month Average, Including Bonuses) YoY (Aug)

A:--

F: --

P: --

GBPUSD
  • GBPUSD
  • XAUUSD
  • XAGUSD
  • WTI
  • USDX
Euro Zone Current Account (SA) (Aug)

A:--

F: --

P: --
EURUSD
  • EURUSD
  • XAUUSD
  • XAGUSD
  • WTI
  • USDX
Euro Zone Current Account (Not SA) (Aug)

A:--

F: --

P: --
EURUSD
  • EURUSD
  • XAUUSD
  • XAGUSD
  • WTI
  • USDX
U.K. 10-Year Note Auction Yield

A:--

F: --

P: --

GBPUSD
  • GBPUSD
  • XAUUSD
  • XAGUSD
  • WTI
  • USDX
Germany ZEW Current Conditions Index (Oct)

A:--

F: --

P: --

EURUSD
  • EURUSD
  • XAUUSD
  • XAGUSD
  • WTI
  • USDX
Euro Zone ZEW Economic Sentiment Index (Oct)

A:--

F: --

P: --

EURUSD
  • EURUSD
  • XAUUSD
  • XAGUSD
  • WTI
  • USDX
Euro Zone ZEW Current Conditions Index (Oct)

A:--

F: --

P: --

EURUSD
  • EURUSD
  • XAUUSD
  • XAGUSD
  • WTI
  • USDX
Euro Zone Construction Output YoY (Aug)

A:--

F: --

P: --

EURUSD
  • EURUSD
  • XAUUSD
  • XAGUSD
  • WTI
  • USDX
Euro Zone Construction Output MoM (SA) (Aug)

A:--

F: --

P: --
EURUSD
  • EURUSD
  • XAUUSD
  • XAGUSD
  • WTI
  • USDX
Germany ZEW Economic Sentiment Index (Oct)

A:--

F: --

P: --

EURUSD
  • EURUSD
  • XAUUSD
  • XAGUSD
  • WTI
  • USDX
U.S. New Housing Starts Annualized MoM (SA) (Sept)

A:--

F: --

P: --
USDX
  • USDX
  • XAUUSD
  • XAGUSD
  • WTI
U.S. Building Permits MoM (SA) (Sept)

A:--

F: --

P: --

USDX
  • USDX
  • XAUUSD
  • XAGUSD
  • WTI
U.S. Annual New Housing Starts (SA) (Sept)

A:--

F: --

P: --
USDX
  • USDX
  • XAUUSD
  • XAGUSD
  • WTI
U.S. Total Building Permits (SA) (Sept)

A:--

F: --

P: --

USDX
  • USDX
  • XAUUSD
  • XAGUSD
  • WTI
U.S. Weekly Redbook Index YoY

A:--

F: --

P: --

XAUUSD
  • XAUUSD
  • XAGUSD
  • WTI
  • USDX
U.S. Pending Home Sales Index (Sept)

A:--

F: --

P: --

USDX
  • USDX
  • XAUUSD
  • XAGUSD
  • WTI
U.S. Pending Home Sales Index YoY (Sept)

A:--

F: --

P: --

USDX
  • USDX
  • XAUUSD
  • XAGUSD
  • WTI
U.S. Pending Home Sales Index MoM (SA) (Sept)

A:--

F: --

P: --

USDX
  • USDX
  • XAUUSD
  • XAGUSD
  • WTI
U.S. API Weekly Gasoline Stocks

A:--

F: --

P: --

WTI
  • WTI
  • XAUUSD
  • XAGUSD
  • USDX
U.S. API Weekly Refined Oil Stocks

A:--

F: --

P: --

WTI
  • WTI
  • XAUUSD
  • XAGUSD
  • USDX
U.S. API Weekly Crude Oil Stocks

A:--

F: --

P: --

WTI
  • WTI
  • XAUUSD
  • XAGUSD
  • USDX
U.S. API Weekly Cushing Crude Oil Stocks

A:--

F: --

P: --

WTI
  • WTI
  • XAUUSD
  • XAGUSD
  • USDX
South Korea PPI MoM (Sept)

A:--

F: --

P: --

XAUUSD
  • XAUUSD
  • XAGUSD
  • WTI
  • USDX
Japan Imports YoY (Sept)

A:--

F: --

P: --

USDJPY
  • USDJPY
  • XAUUSD
  • XAGUSD
  • WTI
  • USDX
Japan Goods Trade Balance (SA) (Sept)

A:--

F: --

P: --

USDJPY
  • USDJPY
  • XAUUSD
  • XAGUSD
  • WTI
  • USDX
Japan Exports YoY (Sept)

A:--

F: --

P: --

USDJPY
  • USDJPY
  • XAUUSD
  • XAGUSD
  • WTI
  • USDX
U.K. Input PPI MoM (Not SA) (Sept)

--

F: --

P: --

U.K. Input PPI YoY (Not SA) (Sept)

--

F: --

P: --

U.K. Output PPI YoY (Not SA) (Sept)

--

F: --

P: --

U.K. Output PPI MoM (Not SA) (Sept)

--

F: --

P: --

U.K. Core CPI YoY (Sept)

--

F: --

P: --

U.K. Core CPI MoM (Sept)

--

F: --

P: --

U.K. Core Retail Prices Index YoY (Sept)

--

F: --

P: --

U.K. Retail Prices Index YoY (Sept)

--

F: --

P: --

U.K. CPI MoM (Sept)

--

F: --

P: --

U.K. Retail Prices Index MoM (Sept)

--

F: --

P: --

U.K. CPI YoY (Sept)

--

F: --

P: --

Turkey Capacity Utilization (Oct)

--

F: --

P: --

Indonesia 7-Day Reverse Repo Rate

--

F: --

P: --

Indonesia Loan Growth YoY (Sept)

--

F: --

P: --

Indonesia Deposit Facility Rate (Oct)

--

F: --

P: --

Indonesia Lending Facility Rate (Oct)

--

F: --

P: --

South Africa Core CPI YoY (Sept)

--

F: --

P: --

South Africa CPI YoY (Sept)

--

F: --

P: --

U.S. MBA Mortgage Application Activity Index WoW

--

F: --

P: --

South Africa Retail Sales YoY (Aug)

--

F: --

P: --

Mexico Retail Sales MoM (Aug)

--

F: --

P: --

BOE Gov Bailey Speaks
U.S. EIA Weekly Heating Oil Stock Changes

--

F: --

P: --

U.S. EIA Weekly Crude Oil Imports Changes

--

F: --

P: --

U.S. EIA Weekly Crude Stocks Change

--

F: --

P: --

U.S. EIA Weekly Cushing, Oklahoma Crude Oil Stocks Change

--

F: --

P: --

U.S. EIA Weekly Crude Demand Projected by Production

--

F: --

P: --

U.S. EIA Weekly Gasoline Stocks Change

--

F: --

P: --

Q&A with Experts
    • All
    • Chatrooms
    • Groups
    • Friends
    RPGFX flag
    Benjamin Tailor
    🫣🫣btc🥴🥴
    @Benjamin Tailor What is happening in Bitcoin? It seems to be amusing you
    RPGFX flag
    ROHIM
    Semua ini terdeteksi dengan Gamma Level
    @ROHIM Gamma level? Is that like a trading tool or indicator or something of such nature?
    RPGFX flag
    Osaghae Cephas
    @EuroTraderhave u shorted can I tag along since u said it's an high probability short
    @Osaghae Cephas Which pair is that, like the one you guys are talking about shorting
    Osaghae Cephas flag
    EuroTrader
    @Osaghae Cephasyou see the time frame. That chart is on the weekly time frame by the way
    @EuroTraderI see
    Osaghae Cephas flag
    RPGFX
    @Osaghae Cephas Which pair is that, like the one you guys are talking about shorting
    @RPGFXBrent
    RPGFX flag
    Osaghae Cephas
    @RPGFXBrent
    @Osaghae Cephas oh, I see
    RPGFX flag
    Osaghae Cephas
    @RPGFXBrent
    @Osaghae CephasMany of you are interested in Brent, even Nawdhir sold it
    1999kk.king flag
    59''
    1999kk.king flag
    26''
    1999kk.king flag
    4123 buy
    Benjamin Tailor flag
    now how expect in btc?
    Skylark flag
    Benjamin Tailor
    now how expect in btc?
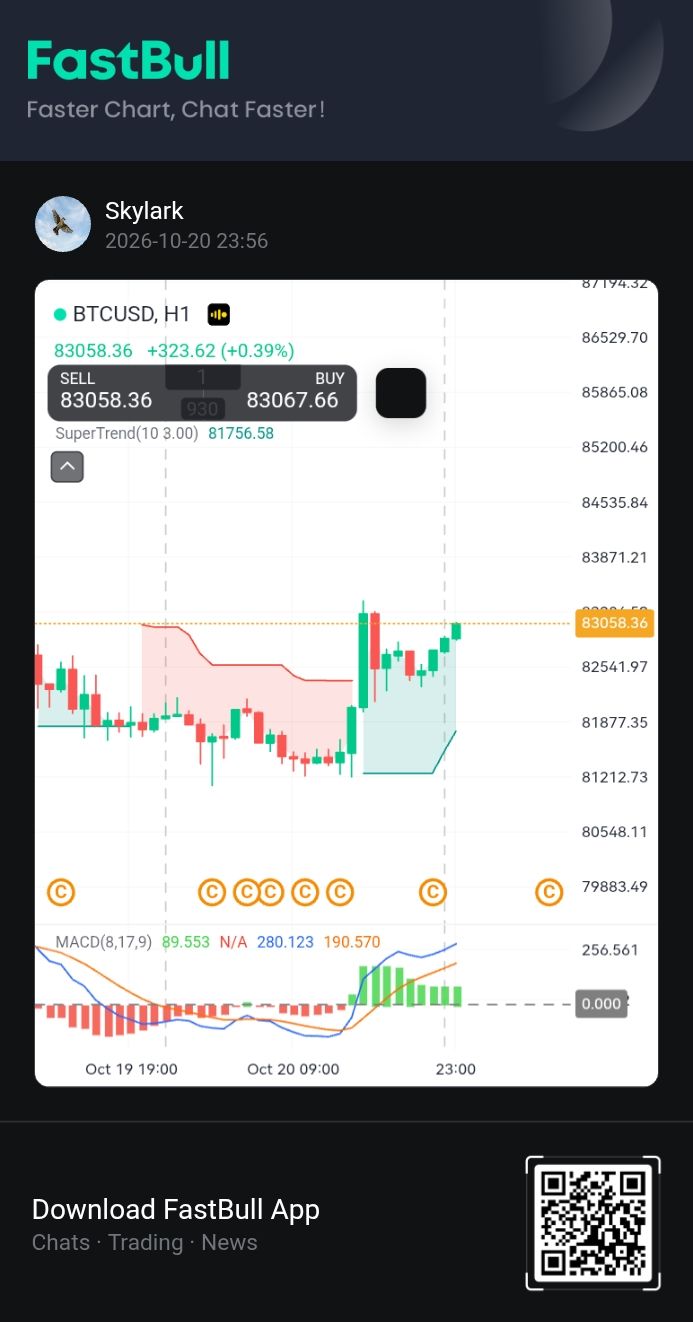
    @Benjamin TailorBTC is looking bullish I will pull a chart now on BTC H1 so you'll see and check it out
    Skylark flag
    Benjamin Tailor flag
    thAnk u
    5867177 flag
    helloy
    Benjamin Tailor flag
    hi
    Skylark flag
    5867177
    helloy
    @Visitor5867177yea hello visitor welcome How are you today? what happening on your end ??
    Benjamin Tailor flag
    Don't trust anyone in trading blindly.
    Benjamin Tailor flag
    good morninh
    Benjamin Tailor flag
    morning *
    Type here...
    Add Symbol or Code

      No matching data

      All
      Recommend
      Stocks
      Cryptocurrencies
      Central Banks
      Trump Updates
      Featured News
      • All
      • Russia-Ukraine Conflict
      • Middle East Flashpoint
      • All
      • Russia-Ukraine Conflict
      • Middle East Flashpoint
      Search
      Products

      Charts Free Forever

      Chats Q&A with Experts
      Screeners Economic Calendar Data Tools
      Membership Features
      Data Warehouse Market Trends Institutional Data Policy Rates Macro

      Market Trends

      Market Sentiment Order Book Forex Correlations

      Top Indicators

      Charts Free Forever
      Markets

      News

      24/7 Analysis Education

      Latest Views

      Latest Update

      Signals

      Copy Rankings Latest Signals Become a signal provider AI Rating
      Contests
      Brokers

      Overview Brokers Assessment Rankings Regulators News Claims
      Broker listing Forex Brokers Comparison Tool Live Spread Comparison Scam
      Q&A Complaint Scam Alert Videos Tips to Detect Scam
      More

      Business
      Events
      Careers About Us Advertising Help Center

      White Label

      Broker API

      Data API

      Web Plug-ins

      Affiliate Program

      Awards Institution Evaluation IB Seminar Salon Event Exhibition
      Vietnam Thailand Singapore Dubai
      Fans Party Investment Sharing Session
      FastBull Summit BrokersView Expo
      Recent Searches
        Top Searches
          Markets
          Analysis
          User
          24/7
          Economic Calendar
          Education
          Data
          • Names
          • Latest
          • Prev

          View All

          No data

          Scan to Download

          Faster Charts, Chat Faster!

          Download
          English
          • English
          • Español
          • العربية
          • Bahasa Indonesia
          • Bahasa Melayu
          • Tiếng Việt
          • ภาษาไทย
          • Français
          • Italiano
          • Türkçe
          • Русский язык
          • 简中
          • 繁中
          Open Account
          Search
          Products
          Charts Free Forever
          Markets
          News
          Signals

          Copy Rankings Latest Signals Become a signal provider AI Rating
          Contests
          Brokers

          Overview Brokers Assessment Rankings Regulators News Claims
          Broker listing Forex Brokers Comparison Tool Live Spread Comparison Scam
          Q&A Complaint Scam Alert Videos Tips to Detect Scam
          More

          Business
          Events
          Careers About Us Advertising Help Center

          White Label

          Broker API

          Data API

          Web Plug-ins

          Affiliate Program

          Awards Institution Evaluation IB Seminar Salon Event Exhibition
          Vietnam Thailand Singapore Dubai
          Fans Party Investment Sharing Session
          FastBull Summit BrokersView Expo

          Box Spread Financing: Calculate the Borrowing Rate After Fees

          zhan chen
          Summary:

          A short box can exchange cash today for a fixed payment later. Rebuild the four option legs, calculate the rate on usable net proceeds and test whether fees or withdrawal restrictions erase the apparent saving.

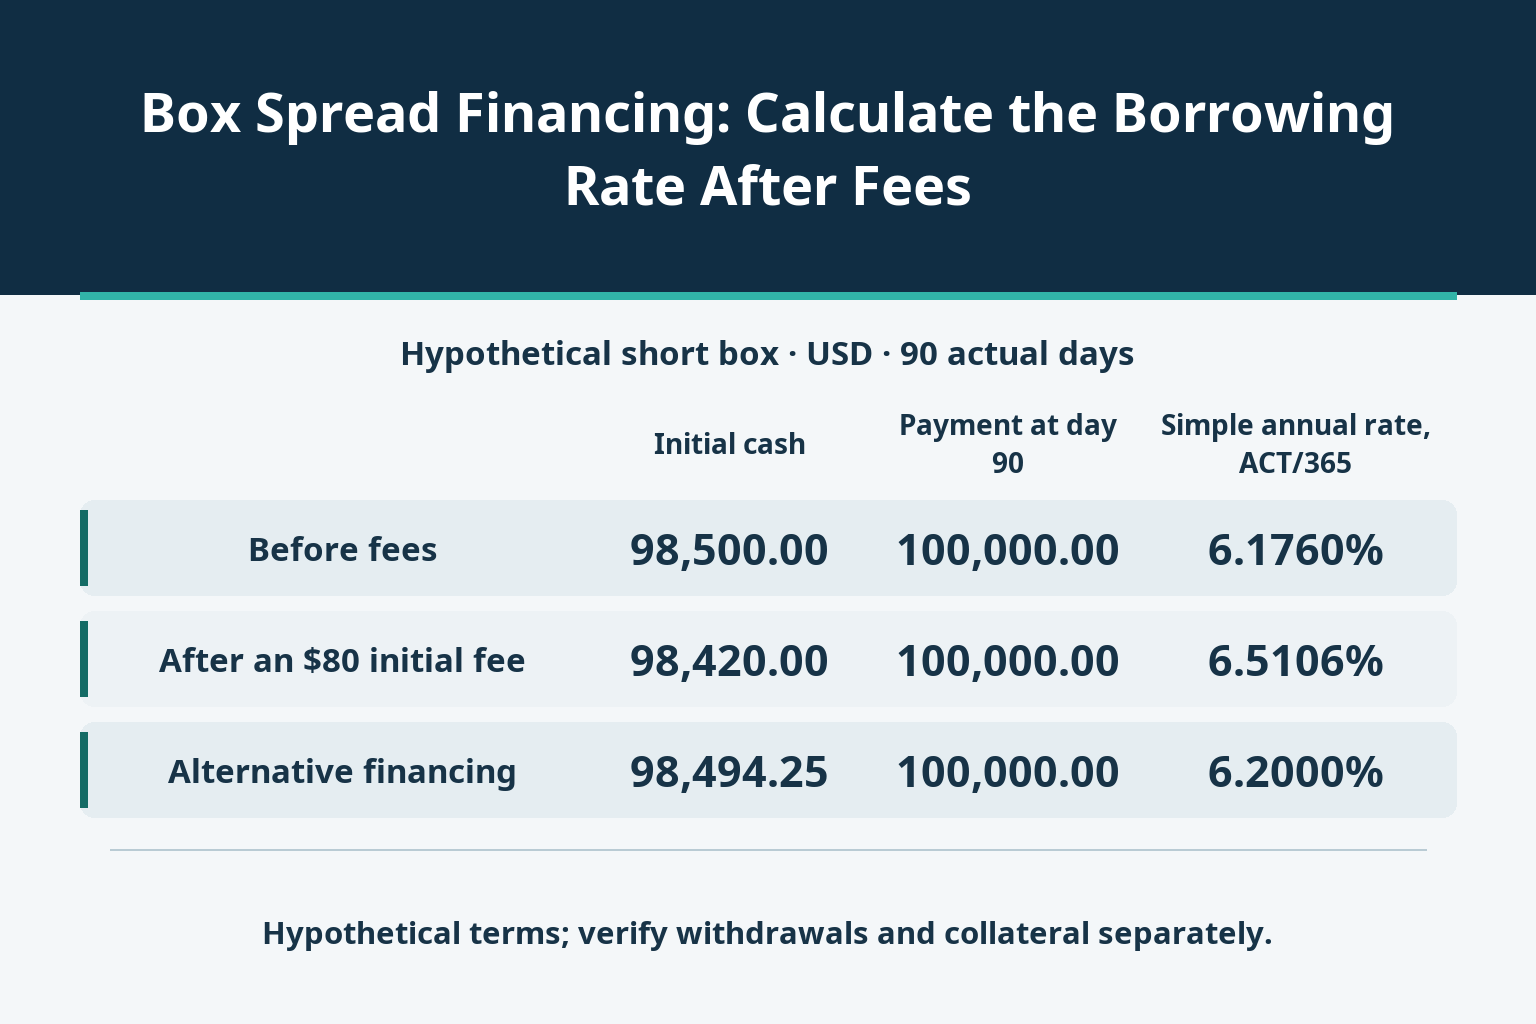
          A short box that brings in $98,500 and pays out $100,000 ninety days later has an implied borrowing cost. It does not follow that the cost is attractive. In the hypothetical example below, an $80 initial fee raises the simple ACT/365 annual rate from about 6.1760% to 6.5106%, above a comparable 6.2% alternative.

          The practical question is how much cash can actually be used, on what date, against which final obligation. A fixed option payoff answers only part of it. The financing comparison also needs execution costs, withdrawal permission and the cash demands of collateral.
          Box Spread Financing: Calculate the Borrowing Rate After Fees_1

          Build the liability from the four legs

          Assume one European, cash-settled index-option series with a $100 multiplier. Sell the 5,000 call, buy the 6,000 call, buy the 5,000 put and sell the 6,000 put, one contract each. All four legs share the expiry, exercise-settlement definition and final index value S. These are hypothetical strikes and prices, not a live SPX quote.

          The table shows settlement cash, with money received positive and money paid negative. Premiums and fees are separate. Between the strikes, the short call pays −100(S−5,000) and the short put pays −100(6,000−S), totaling −$100,000. Below both strikes, the puts produce the same liability; above both, the calls do. The result follows from the payoff identity, not merely from three sample outcomes.

          Final index SShort 5,000 callLong 6,000 callLong 5,000 putShort 6,000 putNet cash, USD
          4,500.000.000.0050,000.00-150,000.00-100,000.00
          5,500.00-50,000.000.000.00-50,000.00-100,000.00
          6,500.00-150,000.0050,000.000.000.00-100,000.00

          Read the net credit as financing cash

          Assume the complete package executes for a $98,500 net option credit. Total initial commissions and other modeled charges are $80, paid on the same day; there are no final charges or other cash movements in this example. Usable initial proceeds are therefore $98,420. The ninety-day period runs from actual receipt of those funds to the actual final payment, not automatically from the order date to the option-expiry label.

          The final $100,000 includes repayment of the cash raised and the financing charge. Subtracting the option credit gives $1,500 before fees; using the cash after fees gives $1,580. Neither amount is an additional loss to add again after calculating the borrowing rate.

          Calculate the rate on the money received

          For initial proceeds P, final payment F and d actual days, the simple ACT/365 annual cost is (F/P − 1) × 365/d. Before fees: (100,000/98,500 − 1) × 365/90 ≈ 6.1760%. After the $80 fee: (100,000/98,420 − 1) × 365/90 ≈ 6.5106%.

          Dividing $1,500 by the final $100,000 instead gives about 6.0833% annualized, a different denominator. It understates the borrowing rate measured on cash received. An effective annual calculation, (F/P)^(365/d) − 1, is another convention; do not compare it directly with a simple annual loan rate or assume the trade can be rolled at an unchanged rate.

          Financing caseInitial cashPayment at day 90Simple annual rate, ACT/365
          Before fees98,500.00100,000.006.1760%
          After an $80 initial fee98,420.00100,000.006.5106%
          Alternative financing98,494.25100,000.006.2000%

          Find the fee threshold before calling it cheaper

          Suppose alternative financing uses the same cash dates and a simple ACT/365 rate of 6.2%. For a final payment of $100,000, it provides 100,000/(1 + 0.062 × 90/365) ≈ $98,494.25 initially. The box's pre-fee $98,500 credit exceeds this by only about $5.75. Total initial fees must be below $5.7477468 to retain a cost advantage; equality means equal cost.

          At an $80 fee the advantage has reversed. Another way to compare equal borrowing amounts is to finance $98,420 at 6.2%: repayment would be about $99,924.61, versus the box's $100,000. The difference is about $75.39. These are alternative views of the same stipulated comparison, not two charges to add together.

          Verify withdrawals and collateral separately

          A premium credit in the account is not evidence that the broker permits an external withdrawal. Obtain the permitted cash amount, its availability date, the account's margin treatment and the applicable collateral terms. If the money cannot leave when required, the structure has not met the external funding need, regardless of its displayed rate.

          The final liability can remain fixed while the assets supporting it fall in value. Additional collateral, a reduced lending value or forced position closure can create an earlier cash demand. The example does not quantify that demand or the opportunity cost of collateral. Its fee-adjusted rate includes only the stated costs and cannot be presented as a universal all-in borrowing cost.

          Keep the contract and exit conditions intact

          All legs must use the same relevant contract series and settlement value. Mixing morning- and afternoon-settled contracts, different expiries or American-style exercise changes the cash-flow structure. Entering separate legs also exposes execution prices and interim positions; use the executable price of the complete package for the financing comparison.

          If the position must be closed early, obtain the executable package close-out price, new fees and the date collateral will be released. The fixed $100,000 expiry payment is not today's exit quote. The directional behavior of a bull call spread and its payoff limits is useful background, but adding a second spread creates a financing identity only when all contract terms match.

          A compact funding check

          Write down the four signed positions and prove the final cash obligation. Reconcile the executable option credit to actual net proceeds, then confirm the receipt and payment dates. Calculate both alternatives with the same annualization, cash amount and cost coverage. Finally test withdrawal access, collateral stress and an early exit. A small quoted-rate edge matters only if it survives all of these checks.

          Risk Warnings and Disclaimers
          You understand and acknowledge that there is a high degree of risk involved in trading. Following any strategies or investment methods may lead to potential losses. The content on the site is provided by our contributors and analysts for information purposes only. You are solely responsible for determining whether any trading assets, securities, strategy, or any other product is suitable for investing based on your own investment objectives and financial situation.
          Add to Favorites
          Share
          FastBull
          Copyright © 2026 FastBull Ltd

          728 RM B 7/F GEE LOK IND BLDG NO 34 HUNG TO RD KWUN TONG KLN HONG KONG

          TelegramInstagramTwitterfacebooklinkedin
          App Store Google Play Android Windows
          Products
          Charts

          Chats

          Q&A with Experts
          Screeners
          Economic Calendar
          Data
          Tools
          Membership
          Features
          Function
          Markets
          Copy Trading
          Latest Signals
          Contests
          24/7
          Analysis
          Education
          Company
          Careers
          About Us
          Contact Us
          Advertising
          Download FastBull
          Help Center
          Feedback
          User Agreement
          Privacy Policy
          Personal Information Protection Statement
          Business

          White Label

          Broker API

          Data API

          Web Plug-ins

          Poster Maker

          Affiliate Program

          Risk Disclosure

          The risk of loss in trading financial instruments such as stocks, FX, commodities, futures, bonds, ETFs and crypto can be substantial. You may sustain a total loss of the funds that you deposit with your broker. Therefore, you should carefully consider whether such trading is suitable for you in light of your circumstances and financial resources.

          No decision to invest should be made without thoroughly conducting due diligence by yourself or consulting with your financial advisors. Our web content might not suit you since we don't know your financial conditions and investment needs. Our financial information might have latency or contain inaccuracy, so you should be fully responsible for any of your trading and investment decisions. The company will not be responsible for your capital loss.

          Without getting permission from the website, you are not allowed to copy the website's graphics, texts, or trademarks. Intellectual property rights in the content or data incorporated into this website belong to its providers and exchange merchants.

          Not Logged In

          Log in to access more features

          Connect Broker
          Become a signal provider
          Help Center
          Customer Service
          Dark Mode
          Price Up/Down Colors

          Log In

          Sign Up

          Position
          Layout
          Fullscreen
          Default to Chart
          The chart page opens by default when you visit fastbull.com