Markets
News
Analysis
User
24/7
Economic Calendar
Education
Data
- Names
- Latest
- Prev


Signal Accounts for Members
All Signal Accounts
All Contests


U.K. Trade Balance Non-EU (SA) (Oct)A:--
F: --
P: --
U.K. Trade Balance (Oct)A:--
F: --
P: --
U.K. Services Index MoMA:--
F: --
P: --
U.K. Construction Output MoM (SA) (Oct)A:--
F: --
P: --
U.K. Industrial Output YoY (Oct)A:--
F: --
P: --
U.K. Trade Balance (SA) (Oct)A:--
F: --
P: --
U.K. Trade Balance EU (SA) (Oct)A:--
F: --
P: --
U.K. Manufacturing Output YoY (Oct)A:--
F: --
P: --
U.K. GDP MoM (Oct)A:--
F: --
P: --
U.K. GDP YoY (SA) (Oct)A:--
F: --
P: --
U.K. Industrial Output MoM (Oct)A:--
F: --
P: --
U.K. Construction Output YoY (Oct)A:--
F: --
P: --
France HICP Final MoM (Nov)A:--
F: --
P: --
China, Mainland Outstanding Loans Growth YoY (Nov)A:--
F: --
P: --
China, Mainland M2 Money Supply YoY (Nov)A:--
F: --
P: --
China, Mainland M0 Money Supply YoY (Nov)A:--
F: --
P: --
China, Mainland M1 Money Supply YoY (Nov)A:--
F: --
P: --
India CPI YoY (Nov)A:--
F: --
P: --
India Deposit Gowth YoYA:--
F: --
P: --
Brazil Services Growth YoY (Oct)A:--
F: --
P: --
Mexico Industrial Output YoY (Oct)A:--
F: --
P: --
Russia Trade Balance (Oct)A:--
F: --
P: --
Philadelphia Fed President Henry Paulson delivers a speech
Canada Building Permits MoM (SA) (Oct)A:--
F: --
P: --
Canada Wholesale Sales YoY (Oct)A:--
F: --
P: --
Canada Wholesale Inventory MoM (Oct)A:--
F: --
P: --
Canada Wholesale Inventory YoY (Oct)A:--
F: --
P: --
Canada Wholesale Sales MoM (SA) (Oct)A:--
F: --
P: --
Germany Current Account (Not SA) (Oct)A:--
F: --
P: --
U.S. Weekly Total Rig CountA:--
F: --
P: --
U.S. Weekly Total Oil Rig CountA:--
F: --
P: --
Japan Tankan Large Non-Manufacturing Diffusion Index (Q4)--
F: --
P: --
Japan Tankan Small Manufacturing Outlook Index (Q4)--
F: --
P: --
Japan Tankan Large Non-Manufacturing Outlook Index (Q4)--
F: --
P: --
Japan Tankan Large Manufacturing Outlook Index (Q4)--
F: --
P: --
Japan Tankan Small Manufacturing Diffusion Index (Q4)--
F: --
P: --
Japan Tankan Large Manufacturing Diffusion Index (Q4)--
F: --
P: --
Japan Tankan Large-Enterprise Capital Expenditure YoY (Q4)--
F: --
P: --
U.K. Rightmove House Price Index YoY (Dec)--
F: --
P: --
China, Mainland Industrial Output YoY (YTD) (Nov)--
F: --
P: --
China, Mainland Urban Area Unemployment Rate (Nov)--
F: --
P: --
Saudi Arabia CPI YoY (Nov)--
F: --
P: --
Euro Zone Industrial Output YoY (Oct)--
F: --
P: --
Euro Zone Industrial Output MoM (Oct)--
F: --
P: --
Canada Existing Home Sales MoM (Nov)--
F: --
P: --
Euro Zone Total Reserve Assets (Nov)--
F: --
P: --
U.K. Inflation Rate Expectations--
F: --
P: --
Canada National Economic Confidence Index--
F: --
P: --
Canada New Housing Starts (Nov)--
F: --
P: --
U.S. NY Fed Manufacturing Employment Index (Dec)--
F: --
P: --
U.S. NY Fed Manufacturing Index (Dec)--
F: --
P: --
Canada Core CPI YoY (Nov)--
F: --
P: --
Canada Manufacturing Unfilled Orders MoM (Oct)--
F: --
P: --
Canada Manufacturing New Orders MoM (Oct)--
F: --
P: --
Canada Core CPI MoM (Nov)--
F: --
P: --
Canada Manufacturing Inventory MoM (Oct)--
F: --
P: --
Canada CPI YoY (Nov)--
F: --
P: --
Canada CPI MoM (Nov)--
F: --
P: --
Canada CPI YoY (SA) (Nov)--
F: --
P: --
Canada Core CPI MoM (SA) (Nov)--
F: --
P: --


No matching data
Latest Views
Latest Views
Trending Topics
Top Columnists
Latest Update
White Label
Data API
Web Plug-ins
Affiliate Program
View All

No data
Key takeaway:
Analysts predict XRP could hit $20–$27 in 2025.
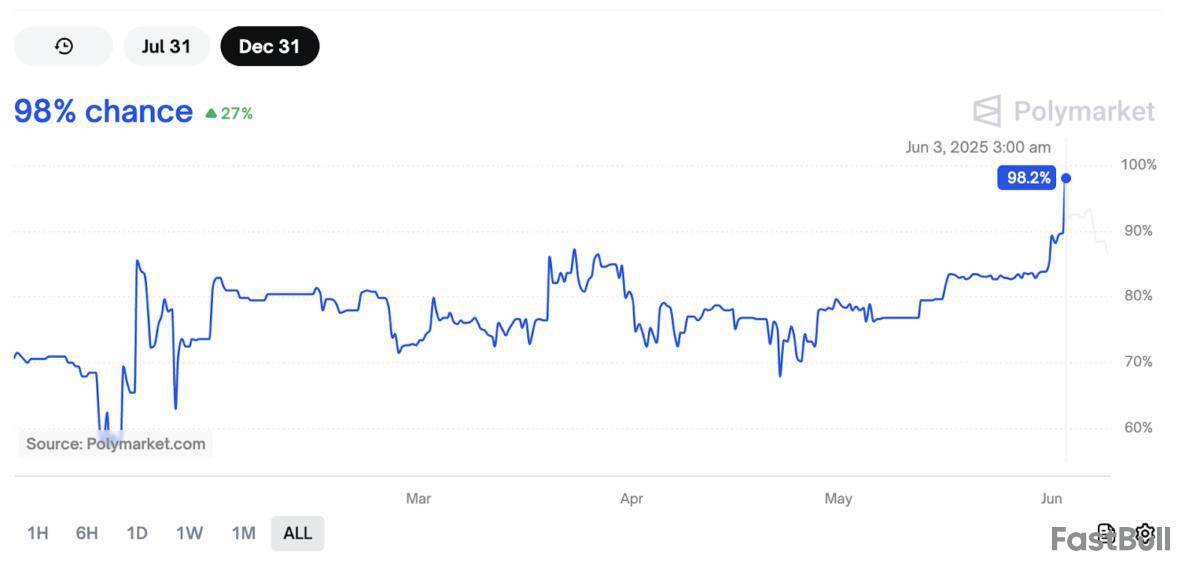
XRP ETF approval odds jump to 98% on Polymarket.
XRP recouped all the losses made between June 4 and June 6, and hovers around $2.26, up 9.7% from its local low of $2.06.
Analysts believe the altcoin could rally into double-digits amid increasing optimism of a possible spot XRP ETF approval in 2025.
Approval odds for an XRP ETF jump to 98%
The likelihood of the US Securities and Exchange Commission approving a spot XRP exchange-traded fund (ETF) in 2025 jumped to 98% on June 3, according to Polymarket data.
Multiple spot XRP ETF applications from major players like Bitwise, Grayscale, Franklin Templeton, and 21Shares have intensified pressure on the SEC, signaling robust demand for regulated XRP investment vehicles.
The launch of XRP futures ETFs by the CME Group on May 19, 2025, with $19 million in first-day trading volume, demonstrates market maturity and institutional interest, addressing SEC concerns about regulated derivatives markets.
Three companies across different sectors have unveiled plans to invest over $471 million in XRP treasuries, including Webus International’s $300 million XRP strategic reserve filing with the SEC, further underscoring corporate adoption and growing institutional trust.
Cointelegraph@CointelegraphJun 04, 2025🚨 BREAKING: Chinese firm Webus files with US SEC to raise $300M for $XRP treasury plan and Ripple payments integration. pic.twitter.com/J2dgaCxBfN
These factors and Ripple’s legal clarity after the SEC dropped its lawsuit in March have bolstered market sentiment.
Despite SEC delays on filings, the CME futures market’s success and corporate strategies have driven Polymarket’s approval odds from 68% in April to as high as 98% in early June, reflecting expectations for approvals by Dec. 31.
Approval of these funds could unlock institutional capital, amplifying demand for XRP and potentially driving prices higher, with some analysts predicting $50 if major players like BlackRock step in.
Analysts anticipate XRP price climbing above $25
XRP price has been stuck below $3.00 since Feb. 1, but analysts say that the crypto could see a massive recovery from the current level, with a target of $25 and above.
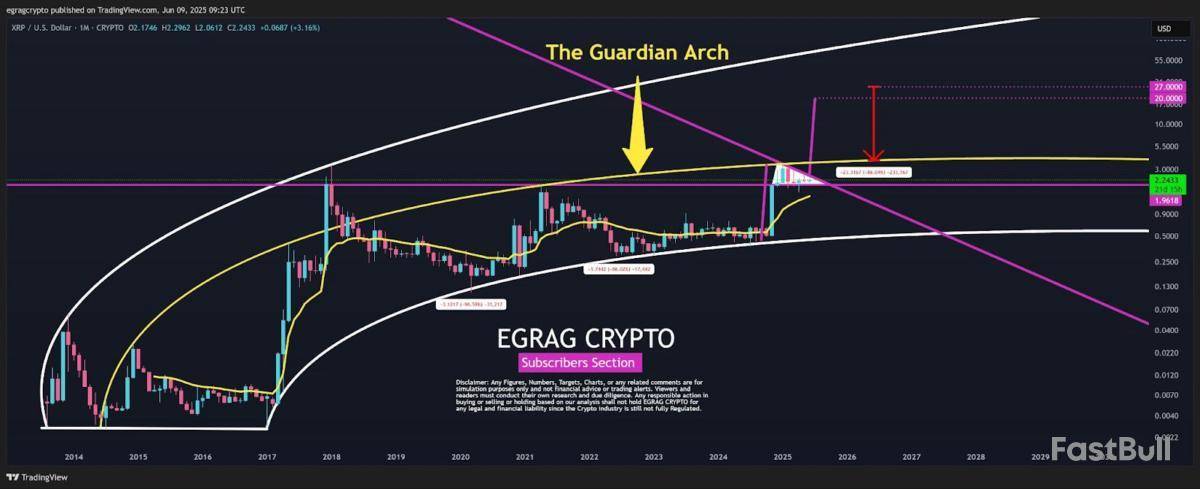
XRP price is “targeting double digits” in 2025, according to popular market analyst Egrag Crypto.
Using his “The Guardian Arch” analysis, the analyst suggested that XRP’s price can rally to $20, potentially topping out at $27 based on past price patterns and timelines.
This analysis uses the relative positions of the 21-week exponential moving average and the 33-week simple moving average as key indicators to identify potential turning points.
The analysis also considers the formation of a bull flag in the monthly time frame, which suggests a continuation of the uptrend toward $20, followed by a possible 86% drop to $3.00 during the bear market.
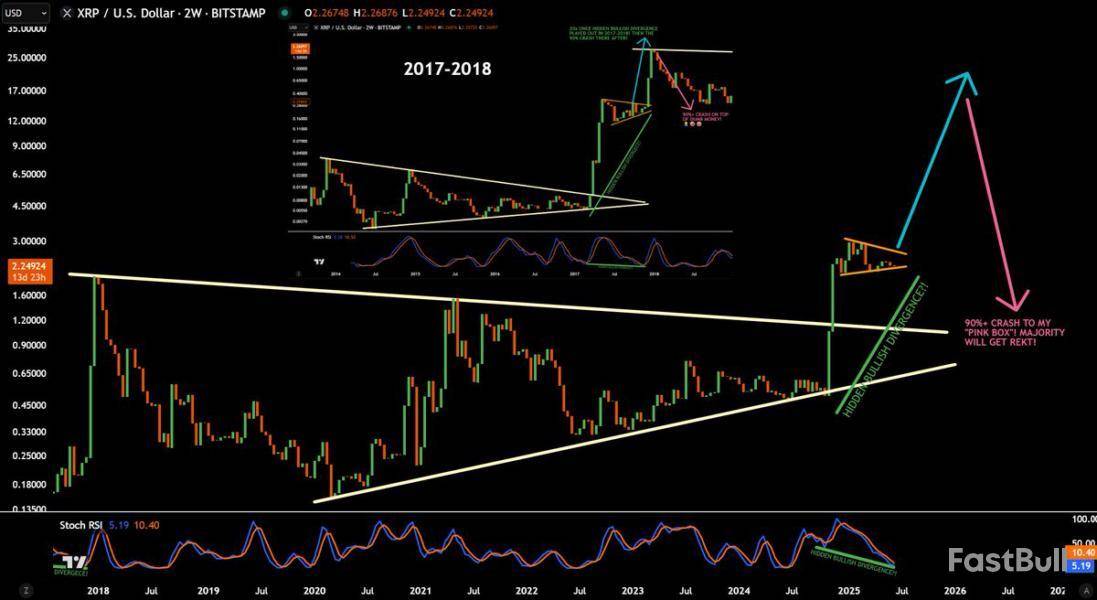
Fellow analyst Jaydee_757 echoes this, saying that XRP’s current technical setup is “comparing the 2017 hidden bullish divergence” in the weekly time frame.
Jaydee_757 explained that the bullish divergence in 2017 led to a 20x rise in XRP price from around $0.0055 to all-time highs above $3.40.
If the 2017 scenario is repeated, a playout of the bullish divergence could see the price rally toward $25 and beyond, representing an over 1,000% increase from current levels.
Jaydee_757 also says that this massive rally could be followed by a 90% price crash during the bear market, suggesting that $25 could mark the top for XRP’s bull cycle in 2025.
These analyses align with previous predictions of XRP reaching $27 based on chart fractals, Eliot wave analysis and Fibonacci extensions.
This article does not contain investment advice or recommendations. Every investment and trading move involves risk, and readers should conduct their own research when making a decision.
Bitcoin's sudden surge past $107,000 is not just a bullish chart moment; it is a liquidation event of epic proportions that has turned the tables on short-sellers in a big way.
In the last few hours, BTC's rapid ascent triggered a wipeout of over $39 million in liquidations, with an impressive $38.95 million from shorts alone, versus a tiny $73K in long positions, according to data visualized on CoinGlass.
That is not just imbalanced — it is a 53,247% skew in favor of long positions, making it one of the most lopsided liquidation snapshots Bitcoin has seen in a while.
Looking at the big picture, we are seeing a total of $65.49 million in crypto liquidations over the past four hours, with shorts accounting for over $61.6 million. It is clear that this was not just a BTC story — it was a marketwide pain for the bears.CoinGlass">
Other major names also got caught up, but nowhere near BTC's scale. Ethereum had $6.58 million in liquidations, while Solana and DOGE had smaller but notable clearing events. But what is interesting is how Bitcoin totally dominated the heatmap, both in raw numbers and relative impact. This suggests a concentrated bear squeeze.
The liquidation heatmap turned a deep shade of red, with shorts lighting up everywhere. Different altcoins like PEPE and SUI followed suit, showing that shorts across various narratives were caught off guard by this sharp BTC breakout.
Unlike typical slow climbs, this was a full-speed, parabolic rise upward, a sudden vertical push likely fueled in part by renewed U.S.-China trade talks in London, which may have reenergized global risk sentiment.
The XRP price is holding strongly above $2, maintaining its momentum as technical indicators show signs of a bullish trend. Notably, a distinct Falling Channel on the XRP price chart suggests that a breakout could be brewing, with a potential rally toward $3.8 in sight.
XRP Price Holds Steady As Bulls Target $3.8
A technical analysis by Rose Premium Signals reveals that XRP is currently flashing strong bullish signals following a breakout from a long-term Falling Channel. Earlier in January, XRP broke past $3 but experienced a strong correction that has kept its price down ever since. Despite the ongoing downtrend, XRP has been firmly holding above the $2 threshold as it prepares for new all-time highs.
Previously, XRP traded within a descending range for several months, forming lower highs and lower lows. However, recent price action has seemingly invalidated this downtrend structure with a decisive breakout above the upper boundary of the Falling Channel, indicating a potential trend reversal and the beginning of a bullish continuation.
The chart shared by Rose Premium Signals on X (formerly Twitter) shows that after the breakout, XRP has been consolidating above the former resistance-turned-support zone, around the $2 level. The analyst confidently states that XRP’s outlook remains inherently bullish despite past downtrends, suggesting that the recent consolidation pattern indicates that bulls are still in control.
Notably, the breakout above the Falling Channel is significant, as it typically implies a strong upside move, especially on higher time frames. Projected price targets based on technical formation are positioned at $2.9520, $3.3967, and $3.8767. Interestingly, the highest projected target exceeds XRP’s all-time high of $3.84 and reflects a 73.54% increase from current price levels.
It’s important to note that these bullish targets forecasted by Rose Premium Signals align with historical resistance zones and measured moves from the Falling Channel breakout. If momentum sustains and market conditions remain favorable, XRP could rally toward these targets over the coming weeks, potentially offering significant upside for long-term holders and traders.
Analyst Says Buy The Dip, With Ideal Entry At $1.85
While forecasting several optimistic targets for XRP, Rose Premium Signals emphasized a strategy of buying the altcoin during dips. This method aims to capitalize on low price points to maximize potential gains as XRP rebounds.
The analyst‘s chart highlights the $1.85 support level with a clear “Buy Here” label, suggesting that this level is considered an ideal entry point should the price revisit it. Currently, XRP is trading at $2.23, meaning a drop to $1.85 would represent a 17.04% decrease. According to the analysis, this support level also marks the base of the recent Falling Channel breakout, providing a favorable risk-reward setup for those looking to enter or expand their positions.
In terms of market movement as well as on-chain activity, XRP is displaying signs of resurgence. The network has previously recorded over 800 million daily transactions, a remarkable number that confirms its importance in the global remittance and payment landscape. The given payment volume data demonstrates that the recent spike in XRP's blockchain activity is more than a random occurrence.
The volume of XRP's on-chain transactions increased several times between May 9 and June 9, reaching close to half a billion dollars on several occasions. The subsequent sharp decline could appear to be a cool-off, but for high-velocity assets like XRP, such volume compression frequently comes before an explosive rebound. XRPScan">
According to the market chart, XRP recently broke through a level of descending resistance, which is a technical move that can spur additional upward movement. The idea that bulls are not done yet has been strengthened by the price's confident bounce from the 200 EMA. Constructive momentum is building as XRP trades above the $2.20 mark and tests the resistance band between $2.26 and $2.30.
Growing buying interest is indicated by the RSI rising out of neutral territory and volume indicators turning upward. There is a strong chance that XRP will retest the 800 million on-chain volume threshold because of this technical and on-chain convergence. A marketwide reevaluation of XRP's usefulness and value could result from such a resurgence, which would indicate actual demand and usage rather than just noise.
XRP is exhibiting indications of a multi-layered resurgence rather than merely rising. There is a greater chance of a push toward $2.70 and possibly higher if payment volumes increase once more and price action stays above the 200 EMA. If the asset continues to have this dual traction on the market and on-chain, the $800 million milestone might not only be reached again but exceeded.
White Label
Data API
Web Plug-ins
Poster Maker
Affiliate Program
The risk of loss in trading financial instruments such as stocks, FX, commodities, futures, bonds, ETFs and crypto can be substantial. You may sustain a total loss of the funds that you deposit with your broker. Therefore, you should carefully consider whether such trading is suitable for you in light of your circumstances and financial resources.
No decision to invest should be made without thoroughly conducting due diligence by yourself or consulting with your financial advisors. Our web content might not suit you since we don't know your financial conditions and investment needs. Our financial information might have latency or contain inaccuracy, so you should be fully responsible for any of your trading and investment decisions. The company will not be responsible for your capital loss.
Without getting permission from the website, you are not allowed to copy the website's graphics, texts, or trademarks. Intellectual property rights in the content or data incorporated into this website belong to its providers and exchange merchants.
Not Logged In
Log in to access more features

FastBull Membership
Not yet
Purchase
Log In
Sign Up