

Markets
News
Analysis
User
24/7
Economic Calendar
Education
Data
- Names
- Latest
- Prev


Signal Accounts for Members
All Signal Accounts
All Contests
 Japan Tankan Small Manufacturing Outlook Index (Q4)
A:--
F: --
P: --
Japan Tankan Large Non-Manufacturing Outlook Index (Q4)A:--
F: --
P: --
Japan Tankan Large Manufacturing Outlook Index (Q4)A:--
F: --
P: --
Japan Tankan Small Manufacturing Diffusion Index (Q4)A:--
F: --
P: --
Japan Tankan Large Manufacturing Diffusion Index (Q4)A:--
F: --
P: --
Japan Tankan Large-Enterprise Capital Expenditure YoY (Q4)A:--
F: --
P: --
 U.K. Rightmove House Price Index YoY (Dec)
A:--
F: --
P: --
 China, Mainland Industrial Output YoY (YTD) (Nov)
A:--
F: --
P: --
China, Mainland Urban Area Unemployment Rate (Nov)A:--
F: --
P: --
 Saudi Arabia CPI YoY (Nov)
A:--
F: --
P: --
 Euro Zone Industrial Output YoY (Oct)
A:--
F: --
P: --
Euro Zone Industrial Output MoM (Oct)A:--
F: --
P: --
 Canada Existing Home Sales MoM (Nov)
A:--
F: --
P: --
Canada National Economic Confidence IndexA:--
F: --
P: --
Canada New Housing Starts (Nov)A:--
F: --
 U.S. NY Fed Manufacturing Employment Index (Dec)
A:--
F: --
P: --
U.S. NY Fed Manufacturing Index (Dec)A:--
F: --
P: --
Canada Core CPI YoY (Nov)A:--
F: --
P: --
Canada Manufacturing Unfilled Orders MoM (Oct)A:--
F: --
P: --
U.S. NY Fed Manufacturing Prices Received Index (Dec)A:--
F: --
P: --
U.S. NY Fed Manufacturing New Orders Index (Dec)A:--
F: --
P: --
Canada Manufacturing New Orders MoM (Oct)A:--
F: --
P: --
Canada Core CPI MoM (Nov)A:--
F: --
P: --
Canada Trimmed CPI YoY (SA) (Nov)A:--
F: --
P: --
Canada Manufacturing Inventory MoM (Oct)A:--
F: --
P: --
Canada CPI YoY (Nov)A:--
F: --
P: --
Canada CPI MoM (Nov)A:--
F: --
P: --
Canada CPI YoY (SA) (Nov)A:--
F: --
P: --
Canada Core CPI MoM (SA) (Nov)A:--
F: --
P: --
Canada CPI MoM (SA) (Nov)A:--
F: --
P: --
Federal Reserve Board Governor Milan delivered a speech U.S. NAHB Housing Market Index (Dec)--
F: --
P: --
 Australia Composite PMI Prelim (Dec)
--
F: --
P: --
Australia Services PMI Prelim (Dec)--
F: --
P: --
Australia Manufacturing PMI Prelim (Dec)--
F: --
P: --
Japan Manufacturing PMI Prelim (SA) (Dec)--
F: --
P: --
U.K. 3-Month ILO Employment Change (Oct)--
F: --
P: --
U.K. Unemployment Claimant Count (Nov)--
F: --
P: --
U.K. Unemployment Rate (Nov)--
F: --
P: --
U.K. 3-Month ILO Unemployment Rate (Oct)--
F: --
P: --
U.K. Average Weekly Earnings (3-Month Average, Including Bonuses) YoY (Oct)--
F: --
P: --
U.K. Average Weekly Earnings (3-Month Average, Excluding Bonuses) YoY (Oct)--
F: --
P: --
 France Services PMI Prelim (Dec)
--
F: --
P: --
France Composite PMI Prelim (SA) (Dec)--
F: --
P: --
France Manufacturing PMI Prelim (Dec)--
F: --
P: --
 Germany Services PMI Prelim (SA) (Dec)
--
F: --
P: --

No matching data
Latest Views
Latest Views
Trending Topics
Top Columnists
Latest Update
White Label
Data API
Web Plug-ins
Affiliate Program
View All
No data
Bitcoin price started a fresh increase from the $98,250 zone. BTC is now consolidating and might aim for a move above the $106,500 resistance.
Bitcoin Price Recovers Ground
Bitcoin price started a fresh increase from the $98,500 zone. BTC gained pace after Trump announced a ceasefire. The price was able to climb above the $102,000 and $103,200 levels.
Besides, there was a break above a key bearish trend line with resistance at $101,500 on the hourly chart of the BTC/USD pair. The pair cleared the 61.8% Fib retracement level of the downward move from the $106,470 swing high to the $98,277 low.
Finally, the price traded close to the $106,000 level. Bitcoin is now trading above $104,000 and the 100 hourly Simple moving average. It is also above the 76.4% Fib retracement level of the downward move from the $106,470 swing high to the $98,277 low.
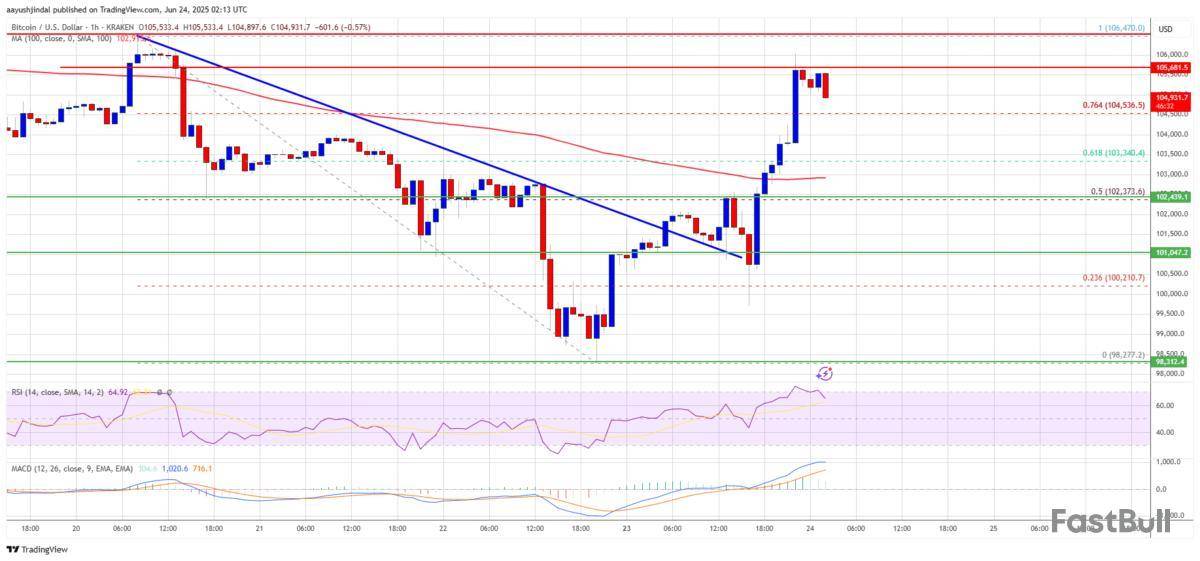
On the upside, immediate resistance is near the $106,000 level. The first key resistance is near the $106,200 level. The next key resistance could be $106,500. A close above the $106,500 resistance might send the price further higher. In the stated case, the price could rise and test the $108,000 resistance level. Any more gains might send the price toward the $110,000 level.
Another Drop In BTC?
If Bitcoin fails to rise above the $106,000 resistance zone, it could start another decline. Immediate support is near the $104,000 level. The first major support is near the $103,500 level.
The next support is now near the $102,500 zone. Any more losses might send the price toward the $101,200 support in the near term. The main support sits at $100,000, below which BTC might struggle to find bids.
Technical indicators:
Hourly MACD – The MACD is now losing pace in the bullish zone.
Hourly RSI (Relative Strength Index) – The RSI for BTC/USD is now above the 50 level.
Major Support Levels – $104,000, followed by $103,500.
Major Resistance Levels – $106,000 and $106,500.
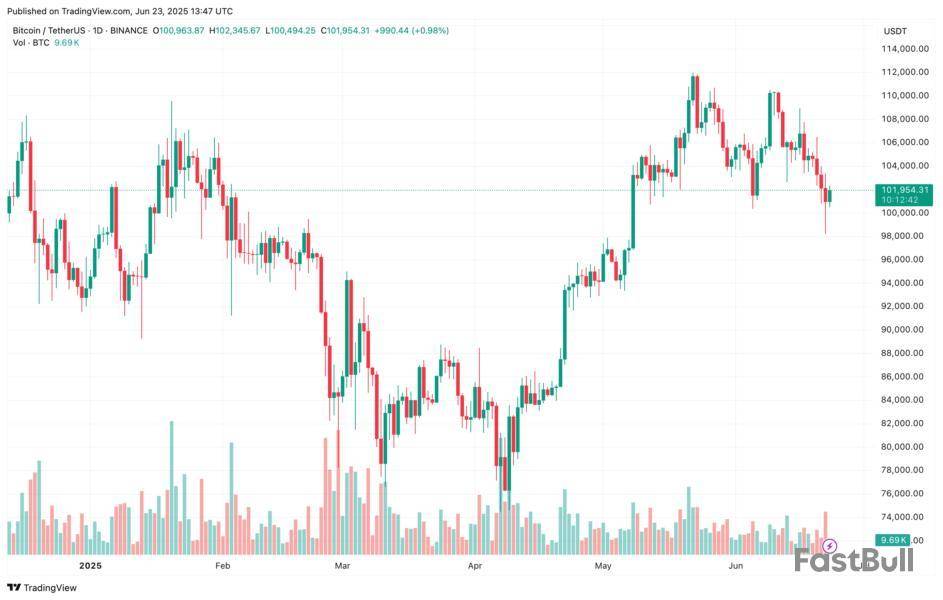
After a brief drop to $98,000 over the weekend, Bitcoin (BTC) has recovered and is now trading above $101,000 at the time of writing. While concerns about a potential double top persist, on-chain data has yet to show any major warning signs.
Bitcoin Undergoing Healthy Consolidation
According to a recent CryptoQuant Quicktake post by contributor Avocado_onchain, despite broader market sentiment turning bearish, BTC has not yet displayed any significant red flags. In fact, the cryptocurrency still appears to be in a consolidation phase.
Notably, the 30-day moving average (MA) of Binary Coin Days Destroyed (CDD) indicates that long-term holders are continuing to hold onto their BTC rather than selling. This suggests that investors remain optimistic about Bitcoin’s potential for further upside in the near term.
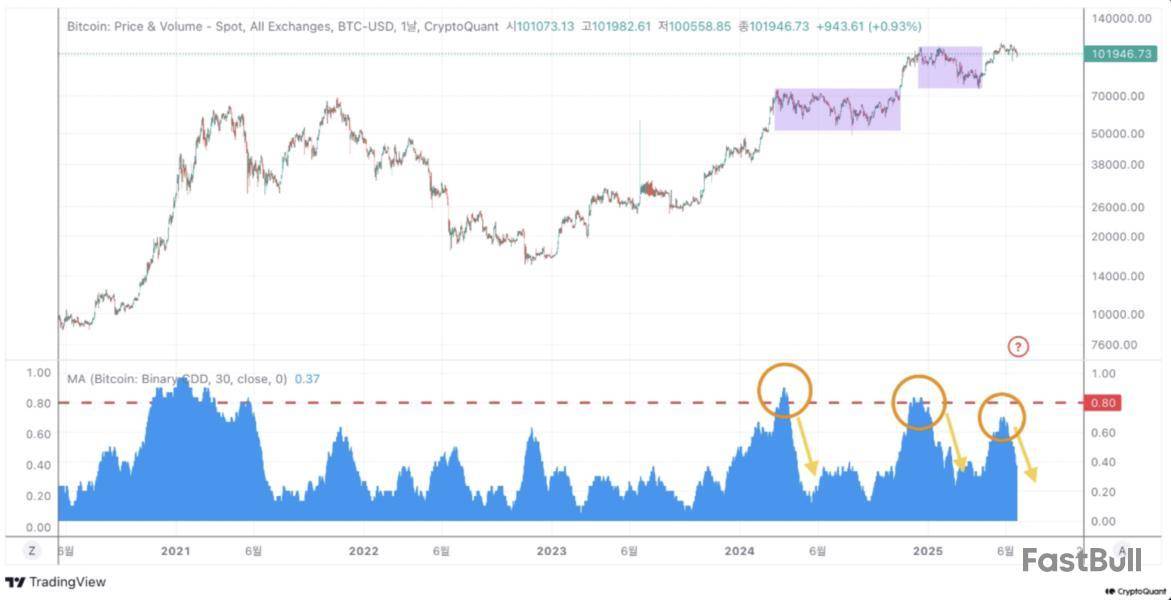
For the uninitiated, the 30-day MA Binary CDD smooths out daily fluctuations to show how frequently long-term Bitcoin holders are moving their coins over a month. A lower value suggests strong holding behavior and accumulation, while a higher value may indicate distribution or selling pressure from experienced holders.
The analyst noted in a previous analysis that when Bitcoin’s Binary CDD exceeded 0.8, it was typically followed by a steep correction. However, this time, the indicator has peaked around 0.6 and is now on the decline – suggesting the market is far from overheating. They added:
Although the data may not align perfectly from cycle to cycle, this moderation below 0.8 still implies the market may be entering a consolidation period, and further price or time correction could follow.
The analyst emphasized that this indicator does not signal the end of the bull run. Rather – similar to the previous two market phases – Bitcoin could be following a “staircase-like movement,” where periods of consolidation are followed by a strong upward leg.
They concluded that BTC historically tends to rally when market attention fades and sentiment remains quiet. Therefore, the current period of low volatility could be a precursor to Bitcoin’s next major move to the upside.
Are BTC Bears In Trouble?
While the current bearish sentiment may have raised hopes for further price pullback for the largest cryptocurrency by reported market cap, both technical and on-chain indicators suggest otherwise.
For example, short positions have been rising sharply within the $100,000–$110,000 range, increasing the likelihood of a short squeeze – which could drive BTC to a new all-time high (ATH).
That said, some caution is warranted, as short-term holders have been selling during recent dips, showing a lack of confidence in Bitcoin’s ability to sustain its upward trajectory. At press time, BTC trades at $101,954, up 1.1% in the past 24 hours.
As volatility engulfs the cryptocurrency market amid war tensions, on-chain data shows that the Bitcoin short-term holders are selling at a loss.
Bitcoin Short-Term Holders Just Made Large Exchange Inflows At A Loss
In a new post on X, CryptoQuant author Axel Adler Jr has talked about how the Bitcoin short-term holders have reacted to the price volatility that has come alongside rising tensions in the Middle East following US strikes on three nuclear facilities in Iran.
The short-term holders (STHs) refer to the BTC investors who purchased their coins within the past 155 days. The other side of the network, the holders with a holding time greater than 155 days, are termed as the long-term holders (LTHs). The former group contains the new entrants and low conviction holders, who generally panic easily whenever some change occurs in the market. On the other hand, the latter cohort includes the veterans of the market, who tend to sit tight through crashes and rallies alike.
As such, given the recent sharp price action that has occurred in the sector, the STHs are likely to have made some moves. And indeed, on-chain data would confirm so.
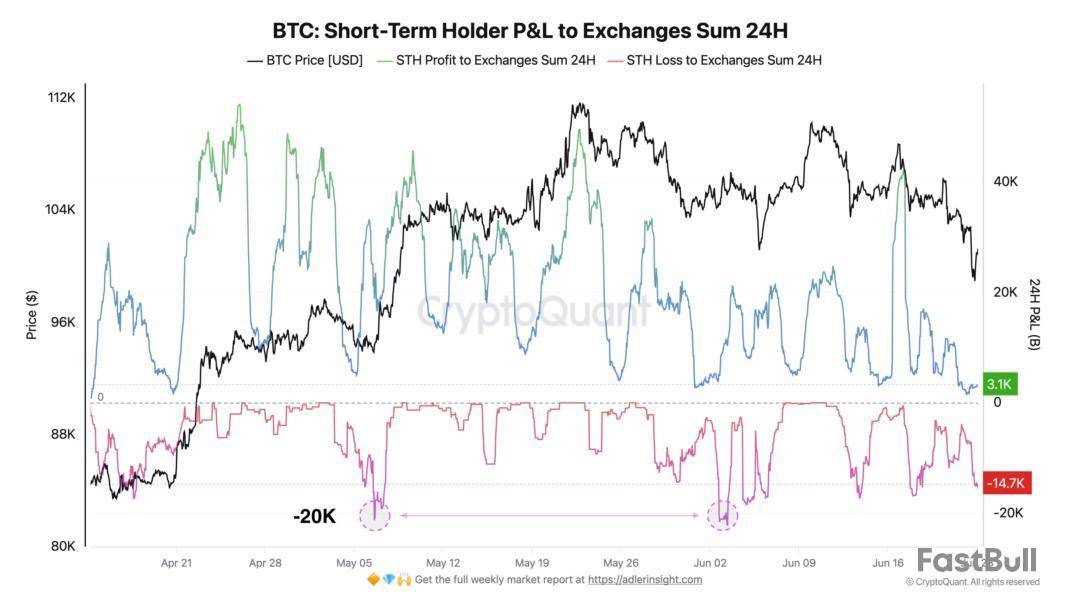
The above chart, shared by the analyst, shows the data for the profit and loss exchange deposit transactions that the STHs as a whole are making. Investors usually transfer to these centralized platforms when they want to sell, so inflows going to them can provide hints about whether selling is elevated or not.
From the graph, it’s visible that the loss transactions going to the exchanges from this cohort have amounted to 14,700 BTC, which, although lower than the two major capitulation events from the past couple of months, is significant. Thus, it would appear that some of the STHs have reacted to the news by exiting the market, even if it means taking a loss.
It’s also apparent from the chart that the profitable transfers have remained relatively low at 3,100 BTC. This is likely down to the fact that the STHs are left with little profit following the price decline, as the on-chain analytics firm Glassnode has pointed out in an X post.
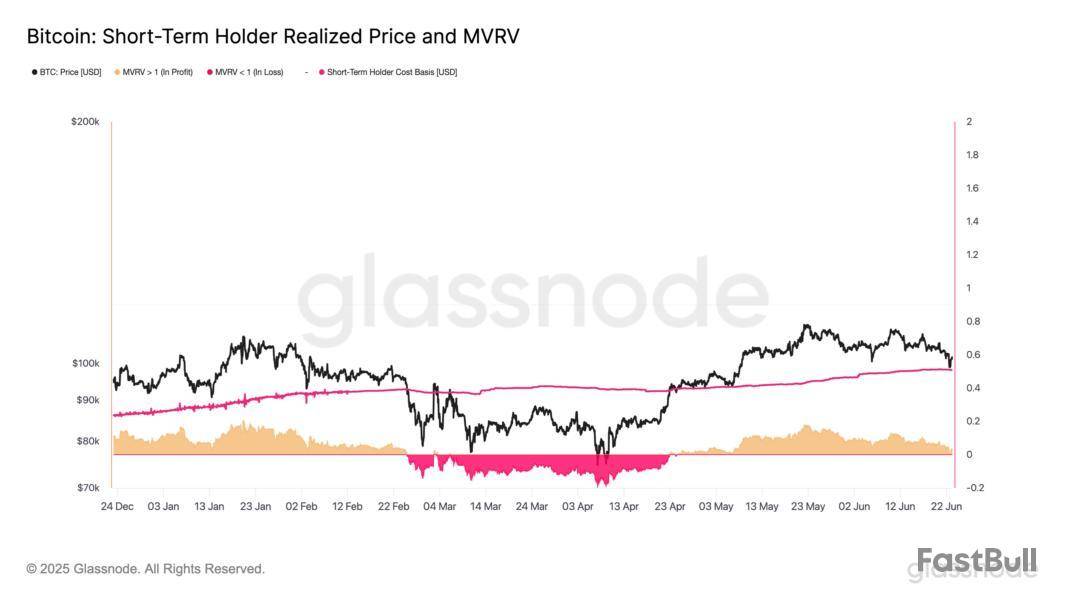
In the chart, the trend of the STH Realized Price is displayed. This indicator keeps track of the Bitcoin cost basis or acquisition level of the average STH. During the crash, the price almost retested the line, and even after the rebound, it remains close to it, meaning the profit margin for the cohort is still tight.
BTC Price
At the time of writing, Bitcoin is trading around $101,300, down over 5% in the last week.
Bitcoin, Ethereum and other major cryptocurrencies gained notably in price on Monday evening as U.S. President Donald Trump announced that Iran and Israel agreed to a ceasefire.
According to The Block's cryptocurrency price page, bitcoin rose 4.5% in the past 24 hours to trade at $105,458, rising from its dip of around $100,500 earlier on Monday. Ether saw a larger gain of 8.86% to $2,424.5.
Altcoin prices also rose significantly on Monday. XRP gained 7.4% to $2.16, while Solana jumped 9.85% to $144.8. The GMCI 30 Index, which measures the performance of top 30 cryptocurrencies, added 7% in the past 24 hours.
“Conflict cooled and clarity returned … With the Iran-Israel ceasefire easing tensions, capital flowed back in," said Vincent Liu, chief investment officer at Kronos Research. "Institutions stayed steady—Bitcoin pushed past $106K, driven by renewed confidence and geopolitical relief.”
The conflict between Iran and Israel, stemming from decades of ideological and political differences, escalated in recent weeks to involve multiple missile and drone strikes. Over the weekend, the U.S. military launched strikes on Iran, causing the crypto market to falter.
At around 6 p.m. on Monday, Trump announced in his Truth Social post that Iran and Israel have "fully agreed" to a complete and total ceasefire in about six hours.
"Officially, Iran will start the CEASEFIRE and, upon the 12th Hour, Israel will start the CEASEFIRE and, upon the 24th Hour, an Official END to THE 12 DAY WAR will be saluted by the World," Trump wrote.
Kronos Research's Liu said the market now looks to see whether this peace agreement-fueled rally would shift to a longer bull run.
"Focus now shifts to follow-through, are institutions buying ETFs, how are trade talks unfolding, and is the dollar strengthening?" Liu wrote. "The ceasefire lit the fire, but macro signals will keep it burning."
Disclaimer: The Block is an independent media outlet that delivers news, research, and data. As of November 2023, Foresight Ventures is a majority investor of The Block. Foresight Ventures invests in other companies in the crypto space. Crypto exchange Bitget is an anchor LP for Foresight Ventures. The Block continues to operate independently to deliver objective, impactful, and timely information about the crypto industry. Here are our current financial disclosures.
© 2025 The Block. All Rights Reserved. This article is provided for informational purposes only. It is not offered or intended to be used as legal, tax, investment, financial, or other advice.
728 RM B 7/F GEE LOK IND BLDG NO 34 HUNG TO RD KWUN TONG KLN HONG KONG


White Label
Data API
Web Plug-ins
Poster Maker
Affiliate Program
The risk of loss in trading financial instruments such as stocks, FX, commodities, futures, bonds, ETFs and crypto can be substantial. You may sustain a total loss of the funds that you deposit with your broker. Therefore, you should carefully consider whether such trading is suitable for you in light of your circumstances and financial resources.
No decision to invest should be made without thoroughly conducting due diligence by yourself or consulting with your financial advisors. Our web content might not suit you since we don't know your financial conditions and investment needs. Our financial information might have latency or contain inaccuracy, so you should be fully responsible for any of your trading and investment decisions. The company will not be responsible for your capital loss.
Without getting permission from the website, you are not allowed to copy the website's graphics, texts, or trademarks. Intellectual property rights in the content or data incorporated into this website belong to its providers and exchange merchants.
Not Logged In
Log in to access more features

FastBull Membership
Not yet
Purchase


Log In
Sign Up


