Markets
News
Analysis
User
24/7
Economic Calendar
Education
Data
- Names
- Latest
- Prev


Signal Accounts for Members
All Signal Accounts
All Contests


U.K. Trade Balance (Oct)A:--
F: --
P: --
U.K. Services Index MoMA:--
F: --
P: --
U.K. Construction Output MoM (SA) (Oct)A:--
F: --
P: --
U.K. Industrial Output YoY (Oct)A:--
F: --
P: --
U.K. Trade Balance (SA) (Oct)A:--
F: --
P: --
U.K. Trade Balance EU (SA) (Oct)A:--
F: --
P: --
U.K. Manufacturing Output YoY (Oct)A:--
F: --
P: --
U.K. GDP MoM (Oct)A:--
F: --
P: --
U.K. GDP YoY (SA) (Oct)A:--
F: --
P: --
U.K. Industrial Output MoM (Oct)A:--
F: --
P: --
U.K. Construction Output YoY (Oct)A:--
F: --
P: --
France HICP Final MoM (Nov)A:--
F: --
P: --
China, Mainland Outstanding Loans Growth YoY (Nov)A:--
F: --
P: --
China, Mainland M2 Money Supply YoY (Nov)A:--
F: --
P: --
China, Mainland M0 Money Supply YoY (Nov)A:--
F: --
P: --
China, Mainland M1 Money Supply YoY (Nov)A:--
F: --
P: --
India CPI YoY (Nov)A:--
F: --
P: --
India Deposit Gowth YoYA:--
F: --
P: --
Brazil Services Growth YoY (Oct)A:--
F: --
P: --
Mexico Industrial Output YoY (Oct)A:--
F: --
P: --
Russia Trade Balance (Oct)A:--
F: --
P: --
Philadelphia Fed President Henry Paulson delivers a speech
Canada Building Permits MoM (SA) (Oct)A:--
F: --
P: --
Canada Wholesale Sales YoY (Oct)A:--
F: --
P: --
Canada Wholesale Inventory MoM (Oct)A:--
F: --
P: --
Canada Wholesale Inventory YoY (Oct)A:--
F: --
P: --
Canada Wholesale Sales MoM (SA) (Oct)A:--
F: --
P: --
Germany Current Account (Not SA) (Oct)A:--
F: --
P: --
U.S. Weekly Total Rig CountA:--
F: --
P: --
U.S. Weekly Total Oil Rig CountA:--
F: --
P: --
Japan Tankan Large Non-Manufacturing Diffusion Index (Q4)--
F: --
P: --
Japan Tankan Small Manufacturing Outlook Index (Q4)--
F: --
P: --
Japan Tankan Large Non-Manufacturing Outlook Index (Q4)--
F: --
P: --
Japan Tankan Large Manufacturing Outlook Index (Q4)--
F: --
P: --
Japan Tankan Small Manufacturing Diffusion Index (Q4)--
F: --
P: --
Japan Tankan Large Manufacturing Diffusion Index (Q4)--
F: --
P: --
Japan Tankan Large-Enterprise Capital Expenditure YoY (Q4)--
F: --
P: --
U.K. Rightmove House Price Index YoY (Dec)--
F: --
P: --
China, Mainland Industrial Output YoY (YTD) (Nov)--
F: --
P: --
China, Mainland Urban Area Unemployment Rate (Nov)--
F: --
P: --
Saudi Arabia CPI YoY (Nov)--
F: --
P: --
Euro Zone Industrial Output YoY (Oct)--
F: --
P: --
Euro Zone Industrial Output MoM (Oct)--
F: --
P: --
Canada Existing Home Sales MoM (Nov)--
F: --
P: --
Euro Zone Total Reserve Assets (Nov)--
F: --
P: --
U.K. Inflation Rate Expectations--
F: --
P: --
Canada National Economic Confidence Index--
F: --
P: --
Canada New Housing Starts (Nov)--
F: --
P: --
U.S. NY Fed Manufacturing Employment Index (Dec)--
F: --
P: --
U.S. NY Fed Manufacturing Index (Dec)--
F: --
P: --
Canada Core CPI YoY (Nov)--
F: --
P: --
Canada Manufacturing Unfilled Orders MoM (Oct)--
F: --
P: --
Canada Manufacturing New Orders MoM (Oct)--
F: --
P: --
Canada Core CPI MoM (Nov)--
F: --
P: --
Canada Manufacturing Inventory MoM (Oct)--
F: --
P: --
Canada CPI YoY (Nov)--
F: --
P: --
Canada CPI MoM (Nov)--
F: --
P: --
Canada CPI YoY (SA) (Nov)--
F: --
P: --
Canada Core CPI MoM (SA) (Nov)--
F: --
P: --
Canada CPI MoM (SA) (Nov)--
F: --
P: --


No matching data
Latest Views
Latest Views
Trending Topics
Top Columnists
Latest Update
White Label
Data API
Web Plug-ins
Affiliate Program
View All

No data
XRP price started a fresh increase above $2.450. The price is now showing positive signs but faces a major hurdle near the $2.620 level.
XRP Price Struggles Near Resistance
XRP price found support and started a strong recovery wave above $2.20, like Bitcoin and Ethereum. The price was able to climb above the $2.250 and $2.320 levels to enter a positive zone.
There was a decent increase above the 61.8% Fib retracement level of the downward move from the $3.05 swing high to the $1.40 swing low. However, the price seems to be facing a major barrier near the $2.650 level. Besides, there is a key bearish trend line forming with resistance at $2.650 on the hourly chart of the XRP/USD pair.
The price is now trading above $2.520 and the 100-hourly Simple Moving Average. If there is a fresh upward move, the price might face resistance near the $2.60 level.

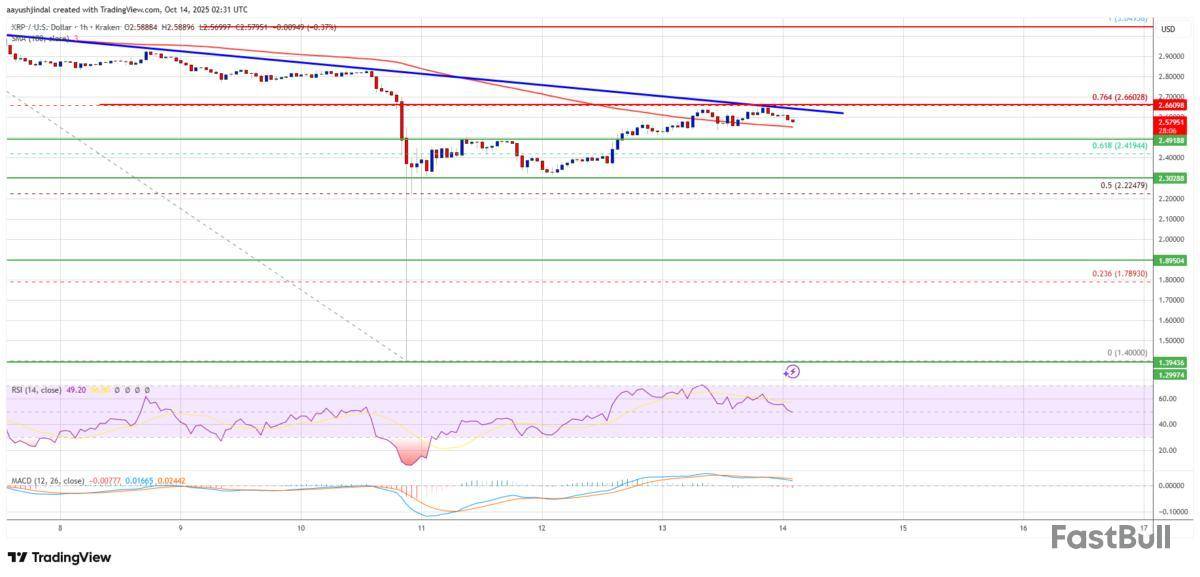
The first major resistance is near the $2.650 level and the trend line. It is close to the 76.4% Fib retracement level of the downward move from the $3.05 swing high to the $1.40 swing low. A clear move above the $2.650 resistance might send the price toward the $2.70 resistance. Any more gains might send the price toward the $2.720 resistance. The next major hurdle for the bulls might be near $2.80.
Another Drop?
If XRP fails to clear the $2.650 resistance zone, it could start a fresh decline. Initial support on the downside is near the $2.550 level. The next major support is near the $2.50 level.
If there is a downside break and a close below the $2.50 level, the price might continue to decline toward $2.30. The next major support sits near the $2.2680 zone, below which the price could continue lower toward $2.220.
Technical Indicators
Hourly MACD – The MACD for XRP/USD is now losing pace in the bullish zone.
Hourly RSI (Relative Strength Index) – The RSI for XRP/USD is now near the 50 level.
Major Support Levels – $2.50 and $2.30.
Major Resistance Levels – $2.60 and $2.650.
Solana again finds itself in the spotlight after allegations of inflating its 100,000 TPS performance claim.
But what’s the real technical truth behind this controversy—and can the latest SOL Price FUD derail the network’s ongoing recovery?
When Technical Metrics Get Misunderstood
Following the Crypto Black Friday last week, Solana highlighted the network’s resilience under extreme demand, reporting that “raw transactions spiked to 6,000–10,000 per second”. Meanwhile, Brennan Watt, Core Engineering VP at Anza, a Solana-focused software company, stated that the network handled up to 100,000 transactions per second (TPS). This performance occurred during the US tariff announcement–driven market volatility.
This immediately sparked a heated debate across social media. Several users accused Solana of “fabricating” the 100,000 TPS milestone.
“Solana couldn’t even keep their story straight. The official account accidentally posted the real TPS (raw 6k, actual 1,800 true TPS) before their engineer cooked up the fake 100k number.” One X user wrote.
Solana’s team and ecosystem contributors quickly reacted.
Matt Sorg, Technology VP at Solana Foundation, explained that validators ingest the 100,000 TPS figure as transactions. These include duplicates and reverted transactions not finalized on-chain, differing from Ethereum’s mempool filtering mechanism.
“It’s not useless for Solana. It’s understood in our technical world, and you’re right that it doesn’t have a direct comparison to Ethereum due to how the mempool works,” said Matt Sorg.
Similarly, Marcantonio, Head of DeFi at Galaxy, defended Solana’s metric as a valid measure of transaction ingress rate—indicating how much the validator pipeline can handle—not the number of finalized transactions. The technical nuance indicates that analysts misinterpreted the 100,000 TPS claim rather than it being fabricated. This reveals how competitors weaponize raw performance metrics in the ongoing Ethereum–Solana rivalry.
SOL Price Recovers Strongly: FUD Fails to Break the Trend
While the technical debate continues, the SOL price tells a different story—rallying sharply after the recent flash crash. According to multiple analysts, the $180 zone was previously a major resistance zone. Traders have successfully retested it as support, reinforcing Solana’s multi-year ascending trendline from 2022.

In addition, the on-chain URPD data shared by X shows that the central accumulation zone at $224 has decreased from 7.47% (11/10) to 5.89% (13/10). This means that holders have taken profit on more than 18 million SOL and moved them to the support zone of $172-$197.

Traders still consider the $166-$177 zone strong support, as it has served as an accumulation zone since August. The current price has recovered above $190 after hitting a low of $168 on October 11. The $215-$224 zone is now an important resistance level, with a large accumulation volume that needs to be processed.
In the current situation, monitoring the stock market’s reaction and information about the Solana ETF can provide an effective trading strategy. If the SOL price stabilizes above $190 and shows signs of consolidation at $172-$197, this could be an opportunity to act.
As of this writing, SOL is trading at $208.92, up 5.9% over the past 24 hours. This makes it the top-performing cryptocurrency among the top 40 by market capitalization.
Two recent SEC decisions are changing how crypto exchange-traded funds (ETFs) come to market. But despite rising excitement, experts say an ETFs might not launch in October and that the much-discussed October 19b-4 deadlines are not actual launch dates.
SEC Simplifies ETF Approvals
The U.S. Securities and Exchange Commission (SEC) has agreed to streamline how ETFs are approved, replacing the slow case-by-case approach with Generic Listing Standards (GLS).
The change will allow crypto ETFs to be listed more efficiently once other regulatory steps are complete. The SEC also allowed Dimensional Fund Advisors to add an ETF share class to its mutual funds, and more than 70 fund companies are waiting to do the same.
However, progress is now paused. The ongoing U.S. government shutdown has furloughed SEC staff, including those who review and process ETF registrations. Until the government reopens, no new ETFs can move forward.
“Ignore the October Deadlines,” Analyst Explains
ETF analyst Xethalis said that investors are misunderstanding what the October 19b-4 filings mean.
“Basically we’re waiting on the government to reopen (probably).,” he explained. “Litecoin 19b4 deadline was Oct 2. Solana 19b4 deadline was Oct 10. Those (as well as for XRP, BCH and AVAX, etc) were obviated by the Generic Listing Standards (GLS).”
Greg Xethalis@xethalisOct 13, 2025There’s some confusion around the SEC and spot ETPs.
Quick update for folks —> Basically we’re waiting on the government to reopen (probably).
Litecoin 19b4 deadline was Oct 2. Solana 19b4 deadline was Oct 10. Those (as well as for XRP, BCH and AVAX, etc) were obviated by…
The 19b-4 process covers exchange rule filings, not ETF launch approvals. These filings were cleared, but each fund must still complete registration under the 1933 and 1934 Acts. That includes submitting Form S-1 and Form 8-A, both of which need SEC review.
Since those reviews are paused, no ETF can go live yet. Xethalis said that some issuers, like Canary LTC, Bitwise SOL, and Grayscale SOL, have removed “delaying amendments” to speed up approval. But this does not mean a Halloween launch is guaranteed.
What Happens Next
When the government reopens, exchanges such as NYSE Arca, CBOE BZX, and NASDAQ could start listing these ETFs. The groundwork is ready. Many spot crypto ETPs — including those for Solana and Litecoin — have cleared their main rule steps.
Still, it’s a waiting game.
XRP Price Moves With the News
The uncertainty around ETF timing hasn’t stopped XRP from moving sharply. After a 41% flash, XRP recovered to $2.40 and is holding above support as trading activity jumps.
Volumes are up 160% from the monthly average as both retail and institutional players adjust their positions. The SEC was expected to review several spot XRP ETF filings from Grayscale, Bitwise, 21Shares, and WisdomTree between October 18 and 25, but those dates are now uncertain.
If approvals come after the shutdown ends, analysts say XRP could push for a weekly close above $3.11. Resistance remains between $3 and $3.65, with support near $2.65.
Regulatory Context
Ripple gained ground earlier this year when a U.S. court ruled that XRP is not a security in secondary market sales. The decision gave XRP more legal clarity in the U.S. Still, Ripple’s push for a national banking charter continues, and the outcome is expected soon.
For now, the regulatory path matters more than price action. Until the SEC resumes operations, no XRP ETF can launch, no matter how soon filings appear to be ready.
Following Bitcoin’s (BTC) brutal sell-off on October 9, which saw the top cryptocurrency by market cap flash crash to $102,000 before recovering most of its losses, on-chain signals now show that there has been a noticeable decline in the Bitcoin network usage for most of 2025.
Bitcoin On-Chain Fundamentals Losing Strength?
According to a CryptoQant Quicktake post by contributor TeddyVision, Bitcoin’s Network Activity Index has been consistently trending below its 365-day moving average (MA) for most of 2025. The decline shows a structural slowdown in the Bitcoin network’s on-chain usage.
For the uninitiated, the Bitcoin Network Activity Index measures how actively users are interacting on-chain – tracking metrics like transaction counts, active addresses, and transfer volumes. A rising index suggests growing organic usage and adoption, while a declining one indicates slowing network engagement.
To recall, the Bitcoin network activity surged ahead of price back in 2023-24. At the time, Bitcoin price witnessed organic expansion in price, primarily driven by genuine on-chain usage.
However, the trend has changed significantly in 2025. For the most part, this year saw Bitcoin liquidity circulating off-chain, while on-chain traffic has dwindled. As a result, the Network Activity Index has tumbled below the 365-day MA.

That said, BTC price has held between $100,000 to $120,000, creating a widening gap between the digital asset’s valuation and network fundamentals. The CryptoQuant analyst remarked:
Capital keeps rotating, but not expanding – most flows happen off-chain, through ETFs, custodians, and synthetic exposure, while genuine on-chain demand remains subdued.
TeddyVision stated that the recent capital rotation in the Bitcoin market is not indicative of its strength, but rather it is just “momentum running on fumes.” The analyst added that when the Bitcoin network usage stagnates while price keeps on increasing, valuations stop reflecting adoption and start tracking assumptions.
To conclude, although Bitcoin is not collapsing just yet, the fall in its network usage activity speaks volumes about its falling fundamentals. That said, all may not be over for BTC just yet.
In an X post, crypto analyst Titan of Crypto noted that the Bitcoin bull market is not over yet. The analyst stated that a Bitcoin bear market will only start if it loses the 50-day Simple Moving Average (SMA) on the weekly chart.

Q4 2025 Bullish For BTC?
While the recent flash crash to $102,000 may have spooked BTC bulls, several industry experts are still confident that the digital asset will continue to make new record highs in the last quarter of 2025.
Crypto market expert Ash Crypto recently predicted that BTC is likely to hit as high as $180,000 in Q4 2025. Similarly, fresh data from Binance suggests that BTC could be on track to $130,000.
In the same vein, noted crypto analyst Egrag recently forecasted that BTC only needs a minor catalyst to surge to $175,000. At press time, BTC trades at $114,076, up 0.8% in the past 24 hours.

Ethereum price started a fresh recovery above $4,120. ETH is now showing positive signs and might rise further toward the $4,400 level.
Ethereum Price Gains Traction
Ethereum price started a recovery wave above the $3,850 level, like Bitcoin. ETH price formed a base and was able to recover above the $4,000 level.
The price cleared the 50% Fib retracement level of the main drop from the $4,758 swing high to the $3,422 low. The bulls were able to push the price above the $4,200 pivot level. Besides, there is a key bullish trend line forming with support at $4,150 on the hourly chart of ETH/USD.
Ethereum price is now trading above $4,200 and the 100-hourly Simple Moving Average. On the upside, the price could face resistance near the $4,250 level. The next key resistance is near the $4,400 level.

The first major resistance is near the $4,440 level and the 76.4% Fib retracement level of the main drop from the $4,758 swing high to the $3,422 low. A clear move above the $4,400 resistance might send the price toward the $4,500 resistance. An upside break above the $4,500 region might call for more gains in the coming sessions. In the stated case, Ether could rise toward the $4,550 resistance zone or even $4,650 in the near term.
Another Decline In ETH?
If Ethereum fails to clear the $4,300 resistance, it could start a fresh decline. Initial support on the downside is near the $4,150 level and the trend line. The first major support sits near the $4,120 zone.
A clear move below the $4,120 support might push the price toward the $4,050 support. Any more losses might send the price toward the $3,950 region in the near term. The next key support sits at $3,880.
Technical Indicators
Hourly MACD – The MACD for ETH/USD is gaining momentum in the bullish zone.
Hourly RSI – The RSI for ETH/USD is now above the 50 zone.
Major Support Level – $4,150
Major Resistance Level – $4,300
JPMorgan is looking to scale up its blockchain and crypto exposure and is now developing plans to offer cryptocurrency trading services, according to a company executive.
Custodying crypto directly is currently off the table, however.
Speaking on CNBC’s Squawk Box Europe on Monday, JPMorgan’s global head of markets and digital assets, Scott Lucas, was asked if the banking giant would follow competitors such as Citibank into custodying crypto for its clients.
In response, Lucas explained that it’s not on the “horizon near-term” for the bank, but emphasized that it is looking to offer crypto trading services.
“I think Jamie [Dimon] was pretty clear on investor day that we’re going to be involved in the trading of that, but custody is not on the table at the moment,” he said, adding that:
Lucas said JPMorgan is currently exploring what “the right custodians” would look like for the firm. 
JPMorgan’s ‘and’ approach to crypto
During the interview, Lucas referenced JPMorgan’s “and” approach several times, explaining that the bank is looking to capitalize on multiple opportunities in the sector, rather than focusing on one prospect versus another.
“I think when it comes to how we approach this, we’re very much taking an ‘and’ approach. There’s the existing market and there’s opportunities to do new things. And those ‘and’ opportunities aren’t exclusive to one or the other,” he said.
JPMorgan has gradually started to take a more expansive approach to crypto and blockchain in 2025, with partnerships with industry giants such as Coinbase being a key example.
The increased engagement appears to be partly led by a change in tone from its once crypto-skeptical CEO, Jamie Dimon.
After a long history of bashing the crypto space, Dimon stated in August that he had become a “believer in stablecoins” and said he sees value in blockchain tech.
Speaking on JPMorgan’s deposit token JPMD, which launched in a pilot phase on Base in June, Lucas said that while the banking giant is enthusiastic about its potential to service institutional clients, it’s also keeping an eye on stablecoins.
“So when it comes to JPMD, I think it’s really exciting, there’s a real opportunity for us to think about how we can offer different services for our clients on the cash side. As well as responding to client demand to do things like stablecoins,” he said, adding:
In terms of the broader blockchain space, Lucas also stated that JPMorgan doesn’t see only one network, such as Ethereum, taking over the market and becoming the main hub of activity.
Instead, he sees numerous opportunities for the bank to potentially jump in on in the near future.
“I don’t think there’ll be one, and actually we expected some consolidation in that space and now we’re seeing a bunch of new layer 1s being rolled out... so there’s a lot to play for when it comes to the public blockchain, we certainly see opportunity there and we will be doing things in that space in the coming quarters,” he said.
The Stablecoin market is once again proving to be one of the most important indicators for crypto recovery after one of the most violent crashes in recent history. On Friday, Bitcoin plunged to $103,000 within minutes, triggering a wave of panic across the market as overleveraged positions were wiped out and Altcoins lost more than 80% of their value in the same period. The sudden correction left investors questioning whether this marked the end of the bull phase or simply a reset before the next leg up.
Despite the chaos, key onchain data paints a more optimistic picture. Top analyst Darkfost highlights that the supply of ERC-20 stablecoins continues to grow, especially on Binance, the exchange that remains the undisputed leader in trading volume. This surge in stablecoin reserves suggests that liquidity is quietly rebuilding beneath the surface, as investors prepare for re-entry rather than full-scale retreat.
In crypto cycles, rising stablecoin balances often act as a precursor to renewed buying pressure, indicating that capital is sitting on the sidelines, waiting for the right moment to return. As volatility cools down, the stablecoin supply could play a decisive role in shaping the market’s next major move.
Liquidity Surges As Binance Hits Record High Reserves
Darkfost shared data showing that the ERC-20 stablecoin supply on Binance has seen a massive surge over the past two months, rising by $10 billion since August, from $32 billion to $42 billion. This marks the highest level of ERC-20 stablecoin reserves ever recorded on the exchange, a significant milestone that signals renewed liquidity inflows into the market.

This sharp increase in stablecoin reserves suggests two major dynamics at play. First, investors continue to deploy capital into the crypto market through stablecoins, a common precursor to renewed accumulation and trading activity. Second, Binance’s dominance in global trading volume remains unchallenged, with increasing user participation demanding more available liquidity on the platform.
While part of this increase may stem from investors rotating capital back into stablecoins after the recent market crash, this explanation alone doesn’t capture the full picture. Binance typically adjusts its reserves in response to active trading behavior, meaning this spike is more likely linked to rising demand and capital readiness than to risk aversion.
Despite recent volatility and sharp liquidations, the data show that liquidity is flowing back in, positioning the market for a potential rebound. If this trend continues, stablecoin accumulation on Binance could serve as the foundation for the next major leg up across Bitcoin and the broader crypto ecosystem.
Stablecoin Dominance Spikes: Capital Rotates After Market Crash
The chart shows a sharp rise in stablecoin dominance, which recently spiked above 9% before cooling to around 8.15%. This move reflects a rapid flight to liquidity following last week’s extreme volatility, when Bitcoin plunged below $105K and altcoins saw significant losses. Historically, such spikes in stablecoin dominance indicate that traders are exiting risk assets to hold stablecoins, waiting for market stabilization before redeploying capital.

Interestingly, the pullback from 9% to 8% suggests that the panic phase may already be easing. The market appears to be entering a reaccumulation phase, where stable capital is preparing for the next major move. On a technical level, stablecoin dominance remains well above its 50-day and 200-day moving averages, signaling persistent strength in liquidity reserves.
If dominance continues to consolidate near these highs while Bitcoin stabilizes, it could create the foundation for renewed inflows into risk assets. In other words, money hasn’t left the market—it’s waiting on the sidelines. Stablecoin dominance above 8% generally marks periods of strong capital positioning, often preceding new market uptrends. The current setup, therefore, highlights growing investor caution but also a buildup of dry powder that could soon reenter the market.
Featured image from ChatGPT, chart from TradingView.com
White Label
Data API
Web Plug-ins
Poster Maker
Affiliate Program
The risk of loss in trading financial instruments such as stocks, FX, commodities, futures, bonds, ETFs and crypto can be substantial. You may sustain a total loss of the funds that you deposit with your broker. Therefore, you should carefully consider whether such trading is suitable for you in light of your circumstances and financial resources.
No decision to invest should be made without thoroughly conducting due diligence by yourself or consulting with your financial advisors. Our web content might not suit you since we don't know your financial conditions and investment needs. Our financial information might have latency or contain inaccuracy, so you should be fully responsible for any of your trading and investment decisions. The company will not be responsible for your capital loss.
Without getting permission from the website, you are not allowed to copy the website's graphics, texts, or trademarks. Intellectual property rights in the content or data incorporated into this website belong to its providers and exchange merchants.
Not Logged In
Log in to access more features

FastBull Membership
Not yet
Purchase
Log In
Sign Up